Ng, CC
and
Yap, Moi
and
Cheng, YT
and
Hsu, GS
(2017)
Hybrid Ageing
Patterns for Face Age Estimation.
Image and Vision Computing, 69. pp.
92-102. ISSN 0262-8856
Downloaded from:
http://e-space.mmu.ac.uk/619011/
Version:
Accepted Version
Publisher:
Elsevier
DOI:
https://doi.org/10.1016/j.imavis.2017.08.005
Usage rights:
Creative Commons: Attribution-Noncommercial-No
Deriva-tive Works 4.0
Hybrid Ageing Patterns for Face Age Estimation
Choon-Ching Nga, Moi Hoon Yapa,∗, Yi-Tseng Chengb, Gee-Sern Hsub
aManchester Metropolitan University, Chester Street, Manchester, M1 5GD, UK bNational Taiwan University of Science and Technology, Taipei, Taiwan
Abstract
Wrinkles can be embedded in several image-based applications as a descriptor for human skin. However, wrinkle-based age estimation research has not been widely addressed. In this paper, we introduce a Multi-scale Wrinkle Patterns (MWP) representation, investigate the effect of wrinkles on face age estima-tion and propose Hybrid Ageing Patterns (HAP) for face age estimaestima-tion. To define the wrinkle regions more precisely, a template consisting of 10 regions constructed relatively to a set of automatically located facial landmarks is used. We extract the multi-scale wrinkles in each region and encode them into MWP. We use Support Vector Regression to estimate age from the combination of such patterns. The performance of the algorithms is assessed by using Mean Absolute Error (MAE) on three state-of-the-art datasets - FG-NET, FERET and MORPH. We observe that MWP produces a comparable MAE of 4.16 on FERET to the state of the art. Finally we propose HAP, which combines the features from MWP and the Facial Appearance Model (FAM), and demonstrate improved performance on FERET and MORPH with MAE of 3.02 (±2.92) and 3.68 (±2.98), respectively. Therefore, we conclude that MWP is an important complementary feature for face age estimation.
Keywords: Age estimation, wrinkle detection, facial appearance model, line tracking, support vector regression.
∗Corresponding author
1. INTRODUCTION
Automatic face age estimation is an important, yet largely unsolved, chal-lenging problem. This challenge can be attributed to (i) large intra-subject variations and (ii) large inter-subject similarity. The large intra-subject varia-tions include craniofacial growth and changes on skin texture, meanwhile, the
5
inter-subject similarities are gender and race.
Conventionally, age estimation methods are based on appearance features. Appearance features are computed or modelled for an entire face that comprises shape and texture [1]. For facial ageing research, many algorithms [2, 3, 4, 5] use the appearance parameters produced by the facial appearance model (FAM)
10
[1] and age manifold [6, 7]. FAM is a generative model that constructs the target subject’s face by a set of hidden parameters [8] while manifold learning is a non-linear dimensionality reduction approach. Faces at different ages can be generated under a similar subspace with varying parameters for controlling the shape and texture. However, age progression modelling is highly complex
15
due to large intra-subject variation and inter-subject similarity [9]. In addition, dimensional reduction of principal components analysis (PCA) in FAM is a form of averaging which smooths out wrinkles as there is no correspondence from one individual to another [10].
To investigate the effect of wrinkles on face age estimation algorithms,
ac-20
curate wrinkle detection is an important task in face analysis [11, 12]. Judge-ments are typically made on neutral and frontal face images because it is the most commonly found in the datasets. The majority of the latest works on wrinkle assessment are based on clinical perspective (subjective assessment). Clinician perspective focuses on the level of wrinkle severity which is assessed
25
using either descriptive or photographically-calibrated scales [13]. The subjec-tive assessment limits the scientific study of detailed wrinkles information in terms of location, density and depth. On the other hand, computer vision al-gorithms are capable of extracting these information and formed an objective assessment [14]. Choi et. al. [10] studied the local feature extraction for age
estimation. They claimed that the facial wrinkles and skin texture are very important information for age estimation. With age increasing, facial wrinkles are increased and spots or blotches are appeared on skin texture. These aging features are generally shown as high frequency components on images. However, there was no validation on the extracted wrinkles. This implies that age
esti-35
mation using wrinkle features still a challenging problem. Therefore, a reliable and accurate computerised wrinkle detection method is crucial for this study. The following observations outline the limitations of existing wrinkle-based age estimation studies:
1. Conventionally, a significant user interaction is required for identifying
40
the facial wrinkles. It is time consuming and subjective, depending on the user expertise.
2. Existing wrinkle-based features [15, 10] are not robust for face age esti-mation. They are either weakly represented or not validated against the ground truth.
45
3. Conventional features such as local binary patterns (LBP) require high dimension representation and computational expensive.
The main contributions of this paper are:
1. Multi-scale Wrinkle Patterns (MWP) is proposed as a feature represen-tation for facial wrinkles. This represenrepresen-tation includes wrinkle location,
50
intensity and density, which is a better descriptor than conventional local features.
2. Hybrid Ageing Patterns (HAP) is proposed as a new feature representation for face age estimation. It is a fusion of FAM and MWP to form a new complementary feature representation.
55
This paper is organised into the following sections: Section 2 discusses the related work on face age estimation; Section 3, 4, and 5 outlines MWP, HAP and Support Vector Regression (SVR), respectively; Section 6 presents the results and discussion; finally, the conclusion is summarized in Section 7.
2. RELATED WORK 60
The process of age estimation attempts to label a facial image automatically with the exact age (year) or the age group (year range) of the individual face. By deriving significant features from faces of known ages, the age of an individual face can be estimated by solving the inverse problem using the same feature-extraction technique. Although many algorithms have been proposed since 1994
65
[16, 17, 18], age estimation is still a challenging problem due to three reasons [2]. First, face age progression is uncontrolled and personalized. Such special characteristics of ageing variation cannot be captured easily due to the large variations conveyed by human faces. Second, there is no complete facial ageing dataset with chronological ages. It is hard to collect a large facial image set
70
of people throughout their life which are sufficient to present detailed aging progression. Third, it is difficult to define an absolute ageing pattern that can be used to quantify one particular age. For example, these are invalid arguments: two wrinkles at the eye corner is classified as age 20; three wrinkles as 30 years old. Such arguments fail to predict the age between 20-30 and misleading. Thus,
75
a robust ageing representation is needed to cope with the identified problem.
2.1. Face Age Estimation
Age estimation methods can be broadly classified as global and local ap-proaches. In the former, a common way is to capture the variability in the facial appearance by using FAM and then apply the regression method for
pre-80
dicting the age. For the local approach, this refers to representing local features such as wrinkles, spots and pores in an ageing pattern and then the correspond-ing age is estimated by regression. One might think that local features can only be used for age group classification, Ng et al. [19] has proven that a specific age can be learned and estimated from the wrinkle-based features. They present
85
wrinkle by the pixel intensity values at different wrinkle locations.
Lanitis et al. [20] proposed an age estimation method using a quadratic ageing function to identify the relationship between age and appearance param-eters. Using weighted appearance specific (WAS), the ageing function for the
Figure 1: A comparison between original and reconstructed face images of FAM. The top row is a male subject of 60 years old and the bottom row is a female subject of 30 years old taken from FERET dataset. The reconstructed images removed the noise as well as the wrinkles (dotted green line).
unseen face is predicted by the weighted sum of the known ageing functions,
90
where the weights are determined by the Mahalanobis distance from the test image to the training images. Later, they proposed three hierarchical architec-tures to further improve their ageing function. Among them, the function of appearance age-specific (AAS) achieved the best performance because it handles the face image clusters separately according to both the appearance and the age
95
group. They managed to achieve the mean absolute errors (MAE) of 8.06 and 14.83 using WAS and AAS, respectively [21]. However, the ageing function does not take into consideration the uniqueness of ageing variation such as temporal, communal, personalized characteristics of human ageing.
Geng et al. [2] proposed an idea known as ageing pattern subspace (AGES)
100
which makes use of FAM parameters. The main idea of AGES is to find the miss-ing pattern in the agemiss-ing subspace by usmiss-ing PCA and Expectation Maximization (EM) method. They argued that the concepts of identity and time are naturally integrated into the facial ageing subspace. However, the AGES method is less representative due to the appearance model only encoding the image intensities
105
without considering other ageing characteristics such as wrinkles. Moreover, the use of PCA on appearance parameters might lose significant features
be-Figure 2: Sample images from the benchmark datasets with the age labelled. The first row shows the face images from FG-NET [22]. The second row shows the images from FERET [23]. The third row shows the images from MORPH [24].
cause the least important variance could be either noise or ageing information. Among recent approaches, the best MAE for FG-NET, using a leave one person out (LOPO) approach was 4.25 by Chao et al. [5]. They applied label-sensitive
110
learning and age-oriented learning to capture the complicated appearance pa-rameters for age estimation. They claimed that the intrinsic ordinal relationship among human ages is considered but the fundamental problem is the FAM pa-rameters. Although the FAM-based features provide sufficient information for detailed age estimation, they do not include a comprehensive characterization
115
of wrinkles or quantifiable wrinkles due to the dimensionality reduction in PCA [10]. Fig. 1 illustrates the wrinkles appeared on the original images but not on the reconstructed images.
2.2. Face Datasets
The popular datasets for age estimation include FG-NET [22] (with an
av-120
erage resolution of approximately 500x400), FERET [23] (with resolution of 512x768) and MORPH [24] (with resolution of 200x240 or 400x480). FG-NET
comprises 1002 images of 82 subjects in the age range of 0-69 years. Since the images were retrieved from real-life albums of different subjects, the face im-ages have a lot of variations in terms of illuminations and pose. FERET is a
125
comprehensive dataset with 2366 images of 994 subjects that presents multi-ple problems related to face recognition such as illumination variations, pose variations, and facial expressions. Moreover, it consists of a few hundred age-separated face images of subjects with the age difference of 18 months or more and the age range is between 10 and 70. MORPH is the most recent dataset and
130
it was collected by the Face Ageing Group at the University of North Carolina at Wilmington for the purpose of face biometrics applications. For this exper-iment, 2000 images are randomly selected to validate the performance. Fig. 2 illustrates some sample images from FG-NET, FERET and MORPH datasets with different age, gender and ethnicity.
135
2.3. Wrinkles Pattern
The skin changes associated with ageing are the focus of many surgical and non-surgical procedures aimed to improve the appearance of skin [25].
Knowl-140
edge of skin histology will deepen the understanding of cutaneous changes as-sociated with ageing and will promote optimal cosmetic and functional patient outcomes. Due to these reasons, research into age estimation by using local features has gained increasing attention, e.g., bio-inspired features (BIF) [26], kernel-based local binary patterns (KLBP) [27] and wrinkles [19].
145
As mentioned in [9, 28], wrinkle-based features such as skin texture are more effective for face representation because they inherently contains spatial locality and orientation selectivity. These properties allow for simplicity of feature ex-traction and avoid the extensive modelling of FAM. Aznar-Casanova et al. [15] investigated the influence of wrinkles on face age judgements. Their experiments
150
were based on the types of wrinkles and quantitative contribution of wrinkles. They found that the amount of wrinkles on the perceived face age had more
in-fluence than the types of wrinkles. Although their works sounds interesting, the whole experiment is based on human judgement. [29] proposed a combination rule of the facial ratios and wrinkle index for age group classification. These
155
criteria were suggested by craniofacial research and the observation that aging skin develops wrinkles. A snakelet is a small snake segment designed to find a small individual curve segment in an image. A wrinkle geography map drops multiple snakelets in polygonal regions, where wrinkles may typically be found. Their focus is concentrated on the wrinkles on forehead, next to the eyes and
160
near the cheek bones. If several curves are found in a particular region, they claimed that wrinkles exist in that region. However, there are at least two prob-lems need to be addressed. First, there was no objective validation against the extracted wrinkles. Lines found by the snakelet could be wrinkles or noises. Sec-ond, facial alignment was not done automatically. Wrinkle geography map was
165
placed manually for dropping the snakelets. [30] investigated the appearance-age features for appearance-age estimation. The features are wrinkle, freckle, shape, hair and colour where these features are distributed at different parts of face such as forehead, eye corners, eye bags, nasalobial. Published computerised approaches on age estimation based on wrinkle features are limited [31, 32, 33, 34, 35].
170
Most of them were focused on age group classification instead of specific age estimation.
Yang and Ai [36] applied local binary pattern histograms (LBPH) as aging descriptors. Given a restricted local patch, the Chi square distance between the extracted LBPH and a reference histogram is used as a measure of confidence
175
belonging to the reference class. They claimed that the error rate of age classifi-cation is as low as 7.88% on the FERET dataset. However, LBPH is weakened by the sparse nature of local binary pattern (LBP) representation [27]. The current state-of-the-art method, kernel-based local binary patterns (KLBP), is proposed by Ylioinas et al. [27]. It generates sign and magnitude features
180
through face patches. They claimed that the sparse nature of LBP representa-tion is improved by the proposed kernel estimator. However, this method is not yet tested on FERET dataset. G¨unay and Nabiyev [37] proposed age estimation
based on local Radon features. The idea is to transform an image pixel into an equivalent geometric Radon vector. The authors reported the performance of
185
the local Radon features is better on FG-NET (6.18) than FERET (6.98). It is a norm that local method requires image with higher resolution, but local Radon features seems to work better on images with lower resolution. Existing methods on wrinkles patterns for age estimation are limited, with low accuracy and not tested across different datasets.
190
In this work, we introduce a new complementary feature pattern, MWP, to overcome the problem of poor representation of wrinkles information in the state of the art. We explores the performance of MWP on face age estimation and subsequently proposed a new feature pattern, HAP, by combining MWP and FAM [2] to form a stronger feature representation. To date, no studies have
195
investigated the use of wrinkles patterns as complementary feature of FAM in face age estimation.
3. MULTI-SCALE WRINKLE PATTERNS
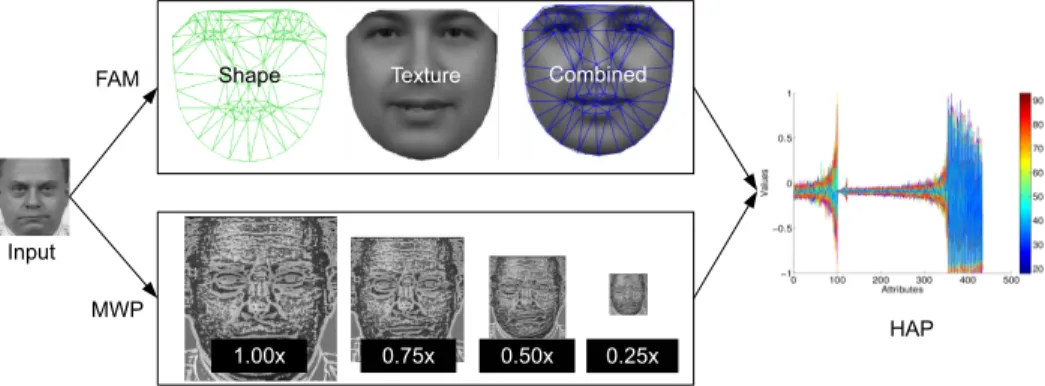
Fig. 3 is an overview of our proposed multi-scale wrinkle patterns. It consists of four steps: seeding, wrinkles detection using line tracking, Region of Interests
200
(ROI) masking and wrinkle pattern representation.
3.1. Seeding
Given a warped image I, it is scaled with different ratios s and denoted as I(s) wheres∈ {s1, s2, . . . , sα} withα indicates the total number of scales. Since wrinkles present in different sizes, a multi-scale image preserve different
205
types of wrinkles. In this case, we set α = 4 and s ∈ {1.00,0.75,0.50,0.25}
wheres= 1.00 represents the original image scale ands= 0.50 represents half of the original image scale. For each scale, the directional gradient ∂I∂x,∂I∂y
of I is computed from the greyscale image. Let ∂I∂y denoted as I, therefore I
emphasizes a horizontal variation and is used as the input for calculating the
210
Figure 3: Multi-scale Wrinkle Patterns. It consists of four steps: seeding, line tracking, ROI masking and pattern representation. Note that 1.00x means the original size of FERET image and ten regions of masking are forehead, glabella, upper eyelids, crows feet, lower eyelids, cheeks, nasolabial grooves, upper lips, marionette and lower lips.
present, eigenvalue analysis of the Hessian filter is assessed. Wrinkles can be considered as edges with special curvatures on a face and the major orientations of such edges are in the horizontal direction. We propose the following Hessian filter imposed on the horizontal gradientI at location (x, y),
215 Hσ(x, y) = Ha,σ(x, y) Hb,σ(x, y) Hb,σ(x, y) Hc,σ(x, y) (1)
whereσ is the filter scale;Ha,σ,Hb,σ andHc,σ are the second derivatives ofI along horizontal, diagonal and vertical directions, respectively. The parameter
σis set to four whereσ∈ {1,3,5,7}to extract the wrinkles from four different filter scales. The computation ofHa,σ,Hb,σ andHc,σare approximated by the following convolutions with Gaussian kernels:
220
Ha,σ(x, y) =I(x, y)∗ G1,σ(i, j) (2)
Hc,σ(x, y) =I(x, y)∗ G1,σT (i, j) (4) The second derivative of a Gaussian kernel at filter scaleσgenerates a probe kernel that measures the contrast at the selective scale in the direction of the derivative. They are given by
G1,σ(i, j) = 1 2πσ4 " M2 i,j σ2 −1 # e −M2i,j+Ni,j2 2σ2 (5) G2,σ(i, j) = 1 2πσ6[Mi,jNi,j]e −M2i,j+Ni,j2 2σ2 (6)
whereMandN are the matrices with vertical and horizontal directions as
Mi,j=−3σ+i−1 (7)
Ni,j=−3σ+j−1 (8)
where the range ofi andj is [−3σ,3σ]. Since wrinkles are similar to the
pat-225
terns of ridge and valley, the Gaussian kernels are designed in the same way. To determine the texture orientation, eigenvalues λ1 and λ2 of the Hessian at specific scale are given by
λ1,σ = 1 2 Ha,σ+Hc,σ+ q (Ha,σ− Hc,σ) 2 + 4H2 b,σ (9) λ2,σ = 1 2 Ha,σ+Hc,σ− q (Ha,σ− Hc,σ) 2 + 4H2 b,σ (10)
λ1,σ andλ2,σ are used to compute the curvilinear likeness measureE[38], where it is a value corresponding to how much a pixel looks like part of a curve, which
230
is defined as the following:
Eσ= 0 ifλ2,σ ≤0 e− Rσ 2β2 1 1−e− Sσ 2β2 2 , otherwise (11)
whereβ1 controls the sensitivity of the filter to the measurement of Rand the default value is 0.5;β2depends on the greyscale range of the curvilinear pattern of interest and controls the sensitivity of the filter to the measurement ofS and the default value is 15 [38];RandS are defined as:
235 Rσ = λ 1,σ λ2,σ 2 , λ2,σ 6= 0 (12) Sσ=λ21,σ+λ 2 2,σ (13)
In this work, we are interested in ridge patterns which represent seeds. λ1 and
λ2 highlight the data of interest and discard noisy patterns [38]. In all scales, if λ2 is positive, then seeds are detected as shown in (11). Moreover, if the maximum of E is greater than zero at any scales, then seeds are detected as well. Due to the curvilinear pattern being analyzed at different values ofσ, the
240
responseEmax of the Hessian filter will be the maximum at a scaleσas
Emax(x, y) = max
σ [Eσ(x, y)] (14)
An initial seed mask of MWP (as D, respectively) is generated and it is defined as D(x, y) = 0 ifEmax(x, y)≤0 I(x, y) otherwise (15)
3.2. Wrinkles Detection using Line Tracking
To date the best wrinkles detector is Hessian Line Tracking (HLT) [39]. This
245
section summarises HLT algorithm and further validation of its performance on ten face regions will be presented in the results section (Section 4).
Hessian Line Tracking. LetCp,r be denoted as a set of candidates pixels to a particular center pixel or seedD(x, y) wherep represents the number of
sampling points and r is the radius of the neighbourhood. These sampling
250
points aroundD(x, y) lie at Cartesian coordinates as,
(xθ, yθ) = (x+rcosθ, y+rsinθ) (16) where θ ∈ {0◦,180◦,45◦,225◦,135◦,315◦} and (xθ, yθ) ∈ Cp,r. In this work, we set (p, r) = (6,1) where tracking of vertical directions are excluded because we assume that the majority of wrinkles is horizontal. Let g~1 denote the first background pixel located ˆspixel(s) away from the candidate pixel and letg~2 a
255
background pixel located ˆs pixel(s) away from the candidate pixel but in the opposite direction. The cross-sectional profile parameterV is estimated as
Vˆs(xθ, yθ) =Iˆs(g~1) +Isˆ(g~2)− D(x, y)−I(xθ, yθ) (17) where ˆs ∈ {1,2, . . . ,10}. If the current pixel belongs to the set of wrinkles, the cross-sectional parameterV has a large positive value. If the current pixel belongs to the background, the contrast between background pixels, current
260
pixels and candidate pixels have similar values, thus V has a negative value or is near to zero. The winner pixelw~ with maximum positive cross-sectional profile, exceeding a predefined positive thresholdς, is defined as
~
w= arg max
C
{Vˆs(xθ, yθ)> ς} (18)
where w~ could be one of the elements of C or null if none is larger than ς.
ς is an important threshold in identifying the intensity difference between the
265
current pixel and the candidate pixel relative to the background pixels. The default value ofς is 9, which is the best threshold we have explored for FERET dataset. Ifw~ is not null, then the confidence array F(w~) is increased by one and the next pixel to be tracked isI(w~). Ifw~ isnull, the next candidate pixel is drawn from the seeds. Note that the tracked pixel is unique from candidate
270
pixels, otherwise the tracking will be redundant. Once multi-scale line tracking is completed for all scales ˆs, the initial wrinkle mapBis generated by consulting
Figure 4: Line tracking. Each column shows different degrees of tracking and each row presents how the multi-scale tracking works. Red is the current seedD(x, y), green is the candidate pixel with certain degreeI(xθ, yθ) and blue is the background pixel with a particular scale
Iˆs(g1~), Iˆs(g2~).
the confidence array as
B(x, y) = 1 ifF(x, y)≥ξ 0 otherwise (19)
whereξ is the amount of scale ˆsand in this work, ξ= 10. Note thatw, ~~ g1, ~g2 refer to a particular position (x, y).
275
Fig. 4 illustrates the line tracking processes on different degrees and scales. Red is the current seedD(x, y), green is the candidate pixel with certain degree
I(xθ, yθ) and blue is the background pixel with a particular scaleIˆs(g~1), Iˆs(g~2). First, a seed is drawn from D. Then, candidate pixels C and background pix-els g~1, ~g2 are derived from it with ˆs = 1 and θ = 0◦. Cross-sectional profile
280
Vsˆ(xθ, yθ) is computed as (17). After that, the computation is repeated for dif-ferent degrees in order to determine the winner pixelw~. The confidence array
Fis incremented by one if a winner pixel is found. Next, the tracking continues with either winner pixel or a seed drawn from D. Once the tracking is com-pleted for the whole image, ˆs is increased to the next scale and the calculation
285
continues until the last scale. Finally, the initial wrinkle mapBis generated by validating the confidence arrayF as (19).
3.3. ROI Masking
In order to extract the wrinkle from a specific region, a standard template first introduced in Ng et. al. [19] is utilised to normalise the face. A mean
290
face from each dataset is used to register and standardise the template. To identify the facial landmarks, the center of eyes and mouth of each face image are derived from the Face++ detector[40]. Once the landmarks are identified, a linear transformation is determined between face image and template through the Procrustes analysis [41]. Then, a warped image is generated by an affine
295
geometric transformation. Due to the limitations of the Face++ detector, we observed a small number of detection errors which were identified and corrected manually. Fig. 3 illustrates the warped image and ten predefined regions of interest. The regions are forehead, glabella, upper eyelids, crows feet (or eye corners), lower eyelids (or eyebag), cheeks, nasolabial grooves (or nasolabial
300
folds), upper lips, marionette and lower lips. The ten face regions are binary images represented by Zi where i = 1,2,3, ..., γ and γ = 10. Note that the template size is 512 x 768 pixels. With consistent area size for the ten face regions, all regions are used to construct the wrinkle patterns, which produce a standard feature vector subsequently used for training and testing. From the
305
wrinkle mapBand region of interestZi, the wrinkle imageJi is defined as
Ji(x, y) = I(x, y) ifB(x, y)∩ Zi(x, y) = 1 0 otherwise (20)
Figure 5: An illustration of MWP patterns. (a) Original image, (b) MWP patterns after wrinkle detection using HLT (pink lines) where the green values of each region are the log of wrinkle intensity followed by wrinkle density.
3.4. Pattern Representation
Let MWP ={f1,f2, . . . ,fψ,g1,g2, . . . ,gψ}, whereψ =α×γ. Note that, in this work, we set total image scaleα= 4 and total wrinkle regionsγ= 10. The wrinkle intensityfi of one particular region is defined as
310 fi= log wt X x=1 ht X y=1 Ji(x, y) (21)
wherewt andhtare the width and height ofJ. The wrinkle densitygi of one particular region,Zi, is defined as
gi= area1(i)
area2(i)
(22) wherearea1 is the wrinkle area found in a particular regioniandarea2 is the area of regioni. Fig. 5 shows a full face example on how wrinkle intensity and
Figure 6: An illustration of HAP patterns. The graph of HAP demonstrates the normalised feature values and the colour bar shows the actual age of each instance. There are approxi-mately 500 instances and 435 features used for this illustration. 1.00x means the original size of input and 0.50x shows the half size of input, and so on. Note that the original input image is taken from FERET dataset.
density are generated after wrinkle detection.
315
4. HYBRID AGEING PATTERNS
Chen et al. [42] explored the facial feature fusion and model selection for age estimation. They found that the feature fusion with model selection can achieve significant improvement for age estimation over single feature representation. However, their results were only tested on FAM and LBP. LBP is a texture
320
descriptor but not designed for facial wrinkle. Therefore, an expansion to the similar idea but a better feature representation is proposed to overcome the limitation. Here we propose a new hybrid feature representation, HAP, a fusion of FAM and MWP for face age estimation. FAM is capable of representing the face appearance in a set of hidden parameters while MWP produces facial
325
wrinkles pattern as complementary feature to FAM.
FAM is a generative parametric model that consists of shape, texture and combined appearance of a human face. It is a model where PCA is used to project high dimension of face shapes and textures into a low dimension of principal component parameters. Automatic detected landmarks by FACE++
330
FAM [1] are repeated here for convenience. Lets and t denote a synthesized shape and texture of a face image in the reference frame, and let ¯sand ¯tdenote the corresponding sample means. New instances are now generated by adjusting the principal component scores,bs andbtin
335
s= ¯s+ Φsbs (23)
t= ¯t+ Φtbt (24)
where Φsand Φt are matrices of column eigenvectors of the shape and texture dispersions estimated from the training set. To obtain a combined shape and texture parameterisation, c, the values of bs and bt over the training set are combined into b= Wsbs bt = WsΦTs (s−¯s) ΦTt (t−¯t) (25)
A suitable weighting between pixel distances and pixel intensities is carried
340
out through the diagonal matrix Ws. To make the normalised measures of pixel distance and pixel intensities commensurate, the shape model scores are typically weighted by the square root of the ratio between the sums of the texture and shape eigenvalues.
To recover any correlation between shape and texture, the two eigen-spaces
345
are usually coupled through a third principal component transform as
b= Φcc= Φc,s Φc,t c (26)
andbis the FAM features of each image as FAM ={b1, b2,· · ·, bn}wherebi ∈b andnis the total number of FAM features of each image.
Fig. 6 shows an illustration of HAP patterns. First, the features of a warped image (input) are extracted by FAM and MWP. Then, a hybrid pattern is
350
HAP ={b1, b2,· · ·, bn, d1, d2,· · · , dm} where bi∈FAM,di∈MWP and m+n is the total number of HAP features of each image.
5. SUPPORT VECTOR REGRESSION
According to Guo et al. [7], the linear regression cannot model the complex
355
aging process. Therefore, a non-linear regression function may be required in practice to adequately model the data. It can be obtained using kernels such as polynomial, Gaussian radial basis function (RBF) and universal Pearson VII function based kernels (PUK). A kernel method is an algorithm that depends on the data only through dot-products [43]. It is replaced by the kernel functions
360
which calculate the variations in a high dimensional space. Therefore, it extends the ability of a linear classifier to generate non-linear decision boundaries and apply a classifier to data that have no obvious fixed-dimensional vector space representation, for example, data in bio-informatics and signal processing.
SMO is an iterative algorithm for solving the optimization problem by
op-365
erating on a fixed size subset of the training set at a time. SMO breaks this problem into a series of smallest possible sub-problems, which are then solved analytically [44]. SMO algorithm puts chunking to the extreme by iteratively selecting working sets of size two and optimizing the target function with re-spect to them. One advantage of using working sets of size two is that the
370
optimization sub-problem can be solved analytically.
In this work, we implemented age estimation experiments by using the WEKA toolbox [45]. The regression algorithm is support vector regression (SVR) with SMO and PUK kernel [46] and parameters are detected through grid search. Let~x, ~y ∈ <N denote input vectors of SVR, the PUK kernelκis
375 defined by, κ(~xi, ~yi) = 1 " 1 + 2 q |~xi−~yi| 2√ 2(1/ω)−1/σ˜ 2#ω (27)
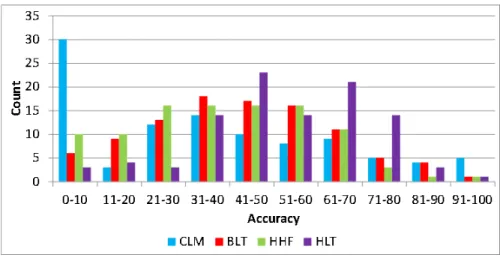
Figure 7: Wrinkle detection accuracy on 100 FERET forehead images. Overall, HLT achieved accuracy of 76% while CLM, BLT and HHF only hit 41%, 54% and 48%, respectively.
where the parameters ω and ˜σcontrol the half-width and the tailing factor of the peak of the Pearson VII function. In this way, the PUK kernel will lead to a symmetric matrix with ones on the diagonal and all other entries ranging between the values 0 and 1 for any arbitrary pair of (~xi, ~yi). The PUK kernel
380
is robust and has an equal or even stronger mapping power as compared to the standard kernel functions, which leads to an equal or better generalization performance of SMO [47].
6. EXPERIMENTAL RESULTS AND DISCUSSION
The experimental results are organised into two parts: First part justifies
385
the choice of wrinkle detection algorithm; Second part assesses the performance of MWP and HAP for face age estimation.
6.1. Automatic Wrinkle Detection
To validate the wrinkle detection algorithm, we follow the protocol of re-cently published papers [14, 39]. The wrinkle detection method was validated
390
eval-uate its performance on FERET forehead dataset and then on the other nine face regions.
6.1.1. Evaluation on FERET Forehead Dataset
A subset of 100 images of FERET is randomly selected and the wrinkles
395
are manually annotated. We compare the performance of four most recent wrinkle detection algorithms - Cula Method (CLM) [48], Hybrid Hessian Fil-ter (HHF) [14], Batool line tracking (BLT) [49] and HLT [39] to the man-ual annotation using Jaccard Similarity Index (JSI) [50]. The Jaccard index,
J(A, B) =|A∩B|/|A∪B|, whereAandB denote the set of pixels in two
dif-400
ferent coders’ annotations. In order to validate the correctness of the wrinkle detection method, accuracy is defined asaccuracy =PN
i=1wi, whereN is the total number of images in the experiment and w is the logical output of J;
wi = 1 if Ji >40%, otherwise wi = 0. Any overlap between A and B larger or equal to 40% is considered as correct detection [51]. For detailed protocol
405
of wrinkle detector evaluation, please refer Ng et al. [14]. Fig. 7 shows the accuracy of wrinkle detection. In 100 images, results showed that HLT achieves better than others with an accuracy of 76%, where CLM is 41%, BLT is 54% and HHF is 48%, with an STD of 15.20%, 12.28%, 5.98 and 0.46%.
6.1.2. Evaluation on Other Face Regions 410
From the 90 images randomly selected from FERET dataset, we cropped each image using the predefined region of interest with 10 images for each region. The ground truths are annotated by a dermatologist, as illustrated in Fig. 8.
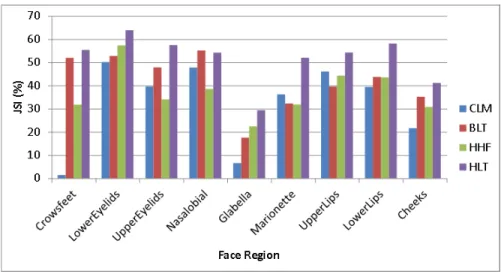
Fig. 9 shows the average JSI of wrinkle detection for each face region. The experimental results showed that BLT hits the best result on Nasalobial and
415
HLT outperforms others in all the remaining regions. The average JSI of all regions for CLM, BLT, HHF and HLT is 35.10%, 42.69%, 38.01% and 52.10%. This experiment further validate Ng et al. method [39] and proved that HLT performed better than the state-of-the-art wrinkle detector. Hence, it is used to extract the wrinkles in MWP.
Figure 8: Manual annotation on ten face regions: (a) forehead, (b) lower eyelids, (c) upper eyelids, (d) lower lips, (e) upper lips, (f) nasalobial, (g) crows feet, (h) glabella, (i) mari-onette and (j) cheeks. Ground truths are green lines and these images are resized for better illustration.
6.2. Face Age Estimation
The most commonly used performance metric for age estimation is Mean Ab-solute Error (MAE) [2]. The MAE is defined as the average of the abAb-solute er-rors between estimated age and the ground truth, MAE =PN
k=1 ˆl k−lk /N , wherelkis the ground truth age for thek-th test image, ˆlk is the estimated age,
425
andN is the total number of test images.
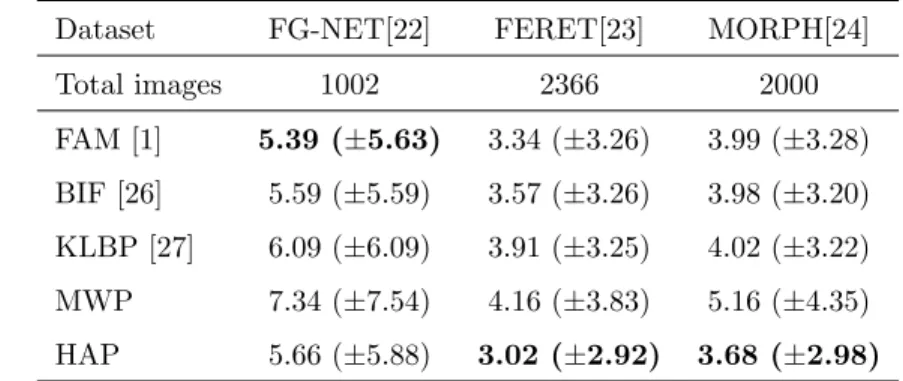
Table 1 shows a comparison of the performance of the proposed method and the state of the art on three datasets. Although the MAE of MWP is the highest among the descriptors (FAM, BIF, KLBP and MWP), it required less computation times (training and prediction) than others under the same
envi-430
ronment. When running the algorithms on FERET dataset, the computation times (feature dimension) of FAM, BIF, KLBP and MWP are 83.99 seconds (300 units), 1892.69 seconds (7464 units), 6352.59 seconds (32769 units) and 36.74 seconds (160 units), respectively.
We noticed that HAP has the lowest MAE for FERET and MORPH, but
Figure 9: Average accuracy (JSI) of wrinkle detection for the other nine face regions.
not for FG-NET. The results showed that the fusion of MWP as complementary features for FAM outperformed on FERET and MORPH, but not FG-NET. This is due to the images in FG-NET were retrieved from real-life albums, which included variation in illumination, pose, expression, beards, moustaches and spectacles. In addition, some of the scanned images are not clear and do
440
not have sufficient texture information.
In Appendix A, Table 2 shows a comprehensive age group analysis of face age estimation from Table 1. For FGNET and FERET, ages are divided into five groups whereage1= 15,age2= 35,age3= 45 andage4= 55; for MORPH,age1
= 18,age2 = 28,age3 = 38 andage4= 48. These parameters were determined
445
based on the age range of dataset. From these results, we noticed that the errors of each method are very similar from one group to another group. It could be the same noise extracted from the same group images. However, we observed that HAP performed better than MWP in all age groups. This implies that FAM features combined with MWP greatly improve the performance of face
450
age estimation.
With the advancements of technology and camera resolution, we believe that MWP can be used as a complementary features for FAM in face age estimation.
Table 1: Comparison of MAE results on three popular datasets. Bold indicates the best MAE of age estimation for each dataset.
Dataset FG-NET[22] FERET[23] MORPH[24]
Total images 1002 2366 2000 FAM [1] 5.39 (±5.63) 3.34 (±3.26) 3.99 (±3.28) BIF [26] 5.59 (±5.59) 3.57 (±3.26) 3.98 (±3.20) KLBP [27] 6.09 (±6.09) 3.91 (±3.25) 4.02 (±3.22) MWP 7.34 (±7.54) 4.16 (±3.83) 5.16 (±4.35) HAP 5.66 (±5.88) 3.02 (±2.92) 3.68 (±2.98)
With better representation of wrinkles descriptor using MWP, the fusion of FAM and MWP has formed a new feature pattern, HAP, for face age estimation.
455
6.3. Discussion
The idea of this work is based on the intensity distribution of facial wrinkles on the predefined wrinkle regions. It is useful to identify a simple yet powerful pattern from wrinkles. However, we noted three issues that affect the perfor-mance of our proposed method MWP. First is the mask of wrinkle regions.
460
Although this has been set to the size of mask using a mean face, we noticed that some of the face cannot fit the mask very well due to large variations of cranial ratio and occlusions such as forehead hair and moustaches. Second, there are false detections of landmarks in a few images detected by the Face++ detector. Although majority were identified and corrected manually, there are
465
some cases with minor errors in alignment. Finally, a robust wrinkle-based features is highly dependent on the performance of wrinkle detection method. With further improvement of the line tracking algorithm, the wrinkle patterns are better represented.
Moreover, the appearance of wrinkle is affected by other factors such as
470
facial expressions and cosmetic treatment. Wrinkles are highly associated with facial expression. It is worth investigating the expression effect on wrinkle and how it would affect the performance of age estimation. Even though wrinkles
are highly associated with aging, we observed individual differences that some individuals have less wrinkles than others. Therefore, an extensive analysis with
475
additional aging features are necessary to address such limitation in the context of age estimation.
While achieving good performance on face age estimation, wrinkle-based patterns would also be useful for broader applications. Generally speaking, there are at least three scenarios where wrinkle-based patterns could be helpful:
480
1. The potential use of wrinkles in the soft biometric applications, e.g. face verification in the presence of age progression [52, 9, 5, 53]. Aging variation poses a serious problem to automatic face recognition systems. As the demand for automatic recognition and surveillance systems is increasing in the last few decades, it would be interesting to explore how
wrinkle-485
based features could contribute to this field.
2. In cosmetology, dermatologists are interested in locating and removing face wrinkles in order to achieve skin rejuvenation [48, 11]. Currently, most systems require expert intervention to manually locate and iden-tify wrinkles. Such process is time-consuming and prone to human error.
490
Therefore, an automatic wrinkle quantification system will aid to human decision in cosmetology.
3. For any facial applications such as face recognition [9, 54], facial expression recognition [55, 56], age estimation or synthesis [17, 18, 57], it is interesting to render or interpret face images in terms of facial attributes. FAM is well
495
known in capturing distinct patterns emerging from the facial appearance. However, the validity of FAM projection in age progression is in fact highly doubtful due to the dimensionality reduction by PCA. Therefore, this problem can be alleviated by the use of local-based wrinkle patterns. In this paper, an investigation of wrinkle-based feature representation for
500
face age estimation is a typical example of scenario 3. Further analysis of wrinkle-based patterns in the aforementioned three scenarios will open the door for promising future research.
7. CONCLUSION
This paper investigated the use of wrinkles pattern as complementary
fea-505
tures for FAM. First, we proposed a novel method (MWP) based on multi-scale wrinkle patterns to improve the wrinkles representation. By deriving wrin-kles with the multi-scale filters across ten face regions, wrinkle patterns are extracted. Then, HAP is proposed for face age estimation. HAP is a fusion of MWP and FAM, which is used to train the classifier and then predict the
510
age of faces. The performance of HAP are assessed and validated using three popular datasets - FG-NET, FERET and MORPH. The results showed HAP (FAM+MWP) outperforms the state of the art with a MAE of 3.02 (±2.92) on FERET and 3.68 (±2.98) on MORPH. The MAE of HAP on FG-NET is slightly higher but comparable to FAM. We conclude that using wrinkle as
complemen-515
tary features could improve the performance of FAM in face age estimation. The methods proposed and experiments presented in this paper have signif-icant impact on wrinkle representation and the design of face age estimation. The results in this study will motivate the research in using automated wrinkle representation for soft biometric studies and face age estimation. Future work
520
will focus on improving the accuracy of wrinkles detection, the impact of vertical wrinkle lines on face age estimation and the implication of automated wrinkles detector in soft biometric.
Acknowledgment
This work was supported by the joint fund of Royal Society (IE141338) and
525
Taiwan Ministry of Science and Technology (awarded to Moi Hoon Yap and Gee-Sern Hsu). The authors would like to thanks Phillips et al. [23] for the FERET dataset. The authors gratefully thank Ylioinas et al. [27] and Batool et al. [49] for the implementation of KLBP and BLT.
References 530
[1] T. Cootes, G. Edwards, C. Taylor, Active appearance models, IEEE Trans. on Pattern Analysis and Machine Intelligence 23 (6) (2001) 681–685. [2] X. Geng, Z. Zhou, K. Smith-Miles, Automatic age estimation based on
facial aging patterns, IEEE Trans. on Pattern Analysis and Machine Intel-ligence 29 (12) (2007) 2234–2240.
535
[3] C. Chen, Y. Chang, K. Ricanek, Y. Wang, Face age estimation using model selection, in: IEEE Conference on Computer Vision and Pattern Recogni-tion Workshops, IEEE, 2010, pp. 93–99.
[4] K.-Y. Chang, C.-S. Chen, Y.-P. Hung, Ordinal hyperplanes ranker with cost sensitivities for age estimation, in: IEEE Conference on Computer
540
Vision and Pattern Recognition (CVPR), IEEE, 2011, pp. 585–592. [5] W.-L. Chao, J.-Z. Liu, J.-J. Ding, Facial age estimation based on
label-sensitive learning and age-oriented regression, Pattern Recognition 46 (3) (2013) 628 – 641. doi:10.1016/j.patcog.2012.09.011.
[6] Y. Fu, T. Huang, Human age estimation with regression on discriminative
545
aging manifold, IEEE Trans. on Multimedia 10 (4) (2008) 578–584. [7] G. Guo, Y. Fu, C. Dyer, T. Huang, Image-based human age estimation by
manifold learning and locally adjusted robust regression, IEEE Trans. on Image Processing 17 (7) (2008) 1178–1188.
[8] X. Gao, Y. Su, X. Li, D. Tao, A review of active appearance models,
550
IEEE Trans. on Systems, Man, and Cybernetics, Part C: Applications and Reviews 40 (2) (2010) 145–158.
[9] Z. Li, U. Park, A. K. Jain, A discriminative model for age invariant face recognition, IEEE Trans. on Information Forensics and Security 6 (3) (2011) 1028–1037.
[10] S. E. Choi, Y. J. Lee, S. J. Lee, K. R. Park, J. Kim, Age estimation using a hierarchical classifier based on global and local facial features, Pattern Recognition 44 (6) (2011) 1262–1281.
[11] N. Batool, R. Chellappa, Detection and inpainting of facial wrinkles using texture orientation fields and Markov random field modeling, IEEE Trans.
560
On Image Processing 23 (9) (2014) 3773–3788.
[12] N. Batool, R. Chellappa, Modeling of facial wrinkles for applications in computer vision, in: Advances in Face Detection and Facial Image Analysis, Springer, 2016, pp. 299–332.
[13] K. Tsukahara, Y. Takema, H. Kazama, Y. Yorimoto, T. Fujimura, S.
Mori-565
waki, T. Kitahara, M. Kawai, G. Imokawa, A photographic scale for the assessment of human facial wrinkles, Journal of Cosmetic Science 51 (2) (2000) 127–139.
[14] C.-C. Ng, M. Yap, N. Costen, B. Li, Automatic wrinkle detection using hybrid Hessian filter, in: The 12th Asian Conference on Computer Vision,
570
Springer International Publishing, 2014, pp. 609–622.
[15] J. Aznar-Casanova, N. Torro-Alves, S. Fukusima, How much older do you get when a wrinkle appears on your face? Modifying age estimates by number of wrinkles, Aging, Neuropsychology, and Cognition 17 (4) (2010) 406–421.
575
[16] Y. Kwon, N. da Vitoria Lobo, Age classification from facial images, in: IEEE Conference on Computer Vision and Pattern Recognition, IEEE, 1994, pp. 762–767.
[17] N. Ramanathan, R. Chellappa, S. Biswas, Computational methods for modeling facial aging: a survey, Journal of Visual Languages & Computing
580
[18] Y. Fu, G. Guo, T. Huang, Age synthesis and estimation via faces: a survey, IEEE Trans. on Pattern Analysis and Machine Intelligence 32 (11) (2010) 1955–1976.
[19] C.-C. Ng, M. Yap, N. Costen, B. Li, Will wrinkle estimate the face age?,
585
in: Proceedings of the IEEE International Conference on Systems, Man, and Cybernetics (SMC2015), 2015, pp. 2418–2423.
[20] A. Lanitis, C. Draganova, C. Christodoulou, Comparing different classifiers for automatic age estimation, IEEE Trans. on Systems, Man, and Cyber-netics 34 (1) (2004) 621–628.
590
[21] X. Geng, Z. Zhou, Y. Zhang, G. Li, H. Dai, Learning from facial aging patterns for automatic age estimation, in: Proceedings of the 14th annual ACM international conference on Multimedia, ACM, 2006, pp. 307–316. [22] FGNET aging dataset, http://www-prima.inrialpes.fr/FGnet/ (accessed
on September 2012).
595
[23] P. Phillips, H. Moon, S. Rizvi, P. Rauss, The feret evaluation methodol-ogy for face-recognition algorithms, IEEE Trans. on Pattern Analysis and Machine Intelligence 22 (10) (2000) 1090–1104.
[24] K. Ricanek, T. Tesafaye, Morph: a longitudinal image database of normal adult age-progression, in: 7th Int. Conf. on Automatic Face and Gesture
600
Recognition, IEEE, 2006, pp. 341–345.
[25] J. Khavkin, D. Ellis, Aging skin: histology, physiology, and pathology., Facial plastic surgery clinics of North America 19 (2) (2011) 229.
[26] G. Guo, G. Mu, Y. Fu, T. S. Huang, Human age estimation using bio-inspired features, in: IEEE Conference on Computer Vision and Pattern
605
Recognition, IEEE, 2009, pp. 112–119.
[27] J. Ylioinas, A. Hadid, X. Hong, M. Pietik¨ainen, Age estimation using local binary pattern kernel density estimate, in: Image Analysis and Processing– ICIAP, Springer, 2013, pp. 141–150.
[28] K. Mikolajczyk, C. Schmid, A performance evaluation of local descriptors,
610
IEEE Trans. on Pattern Analysis and Machine Intelligence 27 (10) (2005) 1615–1630.
[29] Y. Kwon, N. da Vitoria Lobo, Age classification from facial images, Com-puter Vision and Image Understanding 74 (1) (1999) 1–21.
[30] H. Takimoto, Y. Mitsukura, M. Fukumi, N. Akamatsu, A design of gender
615
and age estimation system based on facial knowledge, in: International Joint Conference SICE-ICASE, IEEE, 2006, pp. 3883–3886.
[31] W.-B. Horng, C.-P. Lee, C.-W. Chen, Classification of age groups based on facial features, Tamkang Journal of Science and Engineering 4 (3) (2001) 183–192.
620
[32] R. Iga, K. Izumi, H. Hayashi, G. Fukano, T. Ohtani, A gender and age estimation system from face images, in: SICE 2003 Annual Conference, Vol. 1, IEEE, 2003, pp. 756–761.
[33] H. Fukai, H. Takimoto, Y. Mitsukura, M. Fukumi, Apparent age estimation system based on age perception, in: SICE, 2007, pp. 2808–2812.
625
[34] C. Shan, Learning local features for age estimation on real-life faces, in: Proceedings of the 1st ACM international workshop on Multimodal perva-sive video analysis, ACM, 2010, pp. 23–28.
[35] R. Jana, D. Datta, R. Saha, Age estimation from face image using wrinkle features, Procedia Computer Science 46 (2015) 1754–1761.
630
[36] Z. Yang, H. Ai, Demographic classification with local binary patterns, Ad-vances in Biometrics (2007) 464–473.
[37] A. G¨unay, V. V. Nabiyev, Age estimation based on local radon features of facial images, in: Computer and Information Sciences III, Springer, 2013, pp. 183–190.
[38] A. F. Frangi, Three-dimensional model-based analysis of vascular and car-diac images, Phd thesis (chapter 2), University Medical Center Utrecht (2001).
[39] C.-C. Ng, M. Yap, N. Costen, B. Li, Wrinkle detection using hessian line tracking, IEEE Access 3 (2015) 1079–1088.
640
[40] E. Zhou, H. Fan, Z. Cao, Y. Jiang, Q. Yin, Extensive facial landmark localization with coarse-to-fine convolutional network cascade, in: IEEE Int. Conf. on Computer Vision Workshops (ICCVW), IEEE, 2013, pp. 386– 391.
[41] C. Goodall, Procrustes methods in the statistical analysis of shape, Journal
645
of the Royal Statistical Society. Series B (Methodological) (1991) 285–339. [42] C. Chen, W. Yang, Y. Wang, K. Ricanek, K. Luu, Facial feature fusion and model selection for age estimation, in: IEEE Int. Conf. on Automatic Face & Gesture Recognition and Workshops, 2011, pp. 200–205.
[43] A. Ben-Hur, J. Weston, A users guide to support vector machines, in: Data
650
Mining Techniques for the Life Sciences, Springer, 2010, pp. 223–239. [44] S. K. Shevade, S. S. Keerthi, C. Bhattacharyya, K. R. K. Murthy,
Improve-ments to the SMO algorithm for SVM regression, IEEE Trans. on Neural Networks 11 (5) (2000) 1188–1193.
[45] M. Hall, E. Frank, G. Holmes, B. Pfahringer, P. Reutemann, I. H. Witten,
655
The weka data mining software: an update, ACM SIGKDD Explorations Newsletter 11 (1) (2009) 10–18.
[46] B. ¨Ust¨un, W. J. Melssen, L. M. Buydens, Facilitating the application of support vector regression by using a universal Pearson VII function based kernel, Chemometrics and Intelligent Laboratory Systems 81 (1) (2006)
660
[47] G. Zhang, H. Ge, Support vector machine with a Pearson VII function kernel for discriminating halophilic and non-halophilic proteins, Computa-tional biology and chemistry 46 (2013) 16–22.
[48] G. O. Cula, P. R. Bargo, A. Nkengne, N. Kollias, Assessing facial
wrin-665
kles: automatic detection and quantification, Skin Research and Technol-ogy 19 (1) (2013) e243–e251.
[49] N. Batool, R. Chellappa, Fast detection of facial wrinkles based on ga-bor features using image morphology and geometric constraints, Pattern Recognition 48 (3) (2015) 642–658.
670
[50] P. Jaccard, Distribution de la flore alpine dans le bassin des dranses et dans quelques r´egions voisines (in French), Bulletin de la Socit Vaudoise des Sciences Naturelles 37 (140) (1901) 241–272.
[51] R. Real, Tables of significant values of Jaccard’s index of similarity, Misc. Zool. 22 (1) (1999) 29–40.
675
[52] H. Ling, S. Soatto, N. Ramanathan, D. W. Jacobs, Face verification across age progression using discriminative methods, IEEE Trans. on Information Forensics and Security 5 (1) (2010) 82–91.
[53] M. Albert, A. Sethuram, K. Ricanek, Implications of adult facial aging on biometrics, Biometrics–Unique and Diverse Applications in Nature,
Sci-680
ence, and Technology (2011) 89–106.
[54] B.-C. Chen, C.-S. Chen, W. Hsu, Face recognition and retrieval using cross-age reference coding with cross-cross-age celebrity dataset, IEEE Transactions on Multimedia PP (99) (2015) 1–1. doi:10.1109/TMM.2015.2420374. [55] Y. Huang, Y. Li, N. Fan, Robust symbolic dual-view facial expression
recog-685
nition with skin wrinkles: local versus global approach, IEEE Trans. on Multimedia 12 (6) (2010) 536–543.
[56] H. Dibeklioglu, A. A. Salah, T. Gevers, Recognition of genuine smiles, IEEE Transactions on Multimedia 17 (3) (2015) 279–294.
[57] H. Han, C. Otto, A. K. Jain, Age estimation from face images: human vs.
690
Appendix A
Table 2: An extended results of Table 1. Bold- the lowest MAE within one particular dataset and the underlined values present the highest and lowest of MAE of age group of each dataset.
Dataset (number of images)
MAE (STD)
FAM BIF KLBP MWP HAP
FGNET (1002) 5.39 (5.63) 5.59 (5.97) 6.09 (6.43) 7.34 (7.54) 5.66 (5.88) yi< age1 (545) 3.79 (3.42) 3.80 (3.29) 4.17 (3.36) 4.84 (4.09) 3.88 (3.48) age1≤yi< age2(355) 4.94 (3.84) 5.05 (3.93) 5.18 (4.25) 6.62 (5.02) 5.41 (4.13) age2≤yi< age3(61) 10.76 (5.52) 11.92 (6.10) 14.34 (4.90) 17.76 (5.48) 10.89 (5.52) age3≤yi< age4(30) 19.73 (7.39) 21.90 (7.01) 25.27 (6.90) 28.52 (7.40) 21.29 (8.67) age4≤yi (11) 30.15 (7.75) 32.22 (7.93) 32.74 (8.88) 38.77 (10.00) 30.03 (8.08) FERET (2366) 3.34 (3.26) 3.57 (3.26) 3.91 (3.24) 4.16 (3.83) 3.02 (2.92) yi< age1 (38 ) 8.98 (4.09) 9.82 (3.44) 8.64 (4.20) 9.30 (5.18) 7.69 (4.07) age1≤yi< age2(1579) 2.86 (2.67) 3.04 (2.72) 3.44 (2.76) 3.76 (3.40) 2.68 (2.55) age2≤yi< age3(474) 2.99 (2.54) 3.58 (2.98) 3.92 (3.18) 4.01 (3.59) 2.77 (2.30) age3≤yi< age4(209) 4.72 (3.61) 4.82 (3.81) 4.94 (3.65) 5.00 (4.17) 3.94 (3.40) age4≤yi (66) 9.54 (6.74) 8.37 (5.52) 9.14 (4.70) 9.33 (6.34) 7.37 (5.48) MORPH (2000) 3.99 (3.28) 3.98 (3.20) 4.02 (3.22) 5.16 (4.35) 3.68 (2.98) yi< age1 (100) 6.74 (5.21) 5.80 (4.58) 6.67 (4.04) 10.93 (6.59) 6.25 (5.18) age1≤yi< age2(500) 3.91 (3.03) 3.99 (2.96) 3.93 (2.92) 4.93 (4.19) 3.46 (2.68) age2≤yi< age3(500) 3.44 (2.87) 3.47 (2.72) 3.19 (2.50) 4.53 (3.42) 3.30 (2.62) age3≤yi< age4(500) 3.65 (2.91) 3.88 (3.07) 3.96 (2.93) 4.94 (3.72) 3.45 (2.51) age4≤yi (400) 4.48 (3.48) 4.25 (3.56) 4.57 (3.97) 5.07 (4.61) 4.09 (3.24)

![Figure 2: Sample images from the benchmark datasets with the age labelled. The first row shows the face images from FG-NET [22]](https://thumb-us.123doks.com/thumbv2/123dok_us/1456126.2694819/7.918.257.662.185.466/figure-sample-images-benchmark-datasets-labelled-shows-images.webp)