by Malin Andersson, Arne Gieseck,
Beatrice Pierluigi and Nick Vidalis
Occ asiOnal PaPer series
nO 90 / July 2008
WaGe GrOWTH DisPersiOn
acrOss THe eurO
area cOunTries
This paper can be downloaded without charge from http://www.ecb.europa.eu or from the Social Science Research Network electronic librar y at http://ssrn.com/abstract_id= 1084929.
In 2008 all ECB publications feature a motif taken from the €10 banknote.
O C C A S I O N A L P A P E R S E R I E S
N O 9 0 / J U L Y 2 0 0 8
by Malin Andersson, Arne Gieseck,
Beatrice Pierluigi and
Nick Vidalis
WAGE GROWTH DISPERSION ACROSS
THE EURO AREA COUNTRIES
SOME STYLISED FACTS
1
1 Comments from Hans-Joachim Klöckers, Gerard Korteweg, Klaus Masuch, Ad van Riet and an anonymous referee as well as editing by Claire Vaudry are gratefully acknowledged.
© European Central Bank, 2008 Address Kaiserstrasse 29 60311 Frankfurt am Main Germany Postal address Postfach 16 03 19 60066 Frankfurt am Main Germany Telephone +49 69 1344 0 Website http://www.ecb.europa.eu Fax +49 69 1344 6000
All rights reserved. Any reproduction, publication or reprint in the form of a different publication, whether printed or produced electronically, in whole or in part, is permitted only with the explicit written authorisation of the ECB or the author(s).
The views expressed in this paper do not necessarily refl ect those of the European Central Bank.
ISSN 1607-1484 (print) ISSN 1725-6534 (online)
CONTENTS
C O N T E N T SABSTRACT 4
EXECUTIVE SUMMARY 5
1 INTRODUCTION 7
2 DISPERSION IN WAGE GROWTH RATES ACROSS EURO AREA COUNTRIES OVER TIME 1 0 3 WAGE GROWTH DISPERSION IN THE
EURO AREA COMPARED TO THAT IN
SELECTED BENCHMARK AREAS 1 4
4 COUNTRY DEVELOPMENTS BEHIND
EURO AREA WAGE GROWTH DISPERSION 1 8
5 FACTORS BEHIND WAGE GROWTH DIFFERENTIALS AMONG THE EURO AREA COUNTRIES 2 1 6 DISPERSION IN NOMINAL WAGE LEVELS
ACROSS EURO AREA COUNTRIES 2 7
6.1 Some stylised facts 2 7
6.2 How much wage level dispersion can be explained by dispersion in
labour productivity levels? 3 1
6.3 Can wage growth dispersion be seen empirically as a longer-term wage level convergence process
across euro area countries? 3 4
7 CO-MOVEMENT OF COMPENSATION
GROWTH RATES ACROSS EURO AREA
COUNTRIES AND SECTORS 3 6
7.1 Some stylised facts 3 6
7.2 Business cyles and wage growth
synchronisation 3 9
REFERENCES 4 1 ANNEX 1
DATA SOURCES AND COVERAGE 4 4
ANNEX 2
THE INCLUSION OF CYPRUS, MALTA AND
SLOVENIA 4 5 ANNEX 3
MEASURES OF DISPERSION 4 6
ANNEX 4
REAL WAGE LEVELS 4 8
ANNEX 5
SYNCHRONISATION OF WAGE GROWTH IN
THE SIX MACRO SECTORS 5 0
EUROPEAN CENTRAL BANK OCCASIONAL
ABSTRACT
This study presents some stylised facts on wage growth differentials across the euro area countries in the years before and in the fi rst eight years after the introduction of Economic and Monetary Union (EMU) in 1999. The study shows that wage growth dispersion, i.e. the degree of difference in wage growth at a given point in time, has been on a clear downward trend since the early 1980s. However, wage growth dispersion across the euro area countries still appears to be higher than the degree of wage growth dispersion within West Germany, the United States, Italy and Spain.
Differences in wage growth rates between individual euro area countries and the euro area in the years before and in the fi rst eight years after the introduction of EMU appear to be positively related to the respective differences between their Harmonised Index of Consumer Prices (HICP) infl ation and average HICP infl ation in the euro area. Conversely, relative wage growth differentials across euro area countries have been somewhat unrelated to relative productivity growth differentials. Some countries combine positive wage growth differentials and negative productivity growth differentials vis-à-vis the euro area average over an extended period – and hence positive unit labour cost growth differentials. These countries run the risk of accumulating competitiveness losses and it is therefore a challenge to ensure that the necessary adjustment mechanisms operate fully, in the sense that wage developments are suffi ciently fl exible and refl ect productivity developments. Wage growth persistence within individual euro area countries – largely refl ecting infl ation persistence and certain institutional factors – might also have contributed somewhat to wage growth differentials across the euro area countries. Moreover, wage level convergence has also played a role in explaining wage growth patterns in the 1980s and the 1990s. However, since 1999, the link between the initial compensation level and the subsequent growth rate of compensation per employee appears barely signifi cant.
The study also shows a limited co-movement of wage growth across countries, even in the context of a high degree of business cycle synchronisation seen in the last few years. This suggests that the impact on wage growth of country-specifi c developments across euro area countries has been larger than the impact of common cyclical developments and external
shocks. This could refl ect the normal and
desirable working of adjustment mechanisms, which – in an optimally functioning currency union with synchronised business cycles – would take place via price and cost and wage developments. On the other hand, structural impediments, for example a relatively low degree of openness in domestically-oriented sectors in some countries, might prevent a stronger link between the degree of synchronisation of wage growth rates and business cycles.
Key words: cross-country wage dispersion, wage and productivity levels across countries and sectors. JEL: E24, E31, C10.
E X E C U T I V E S U M M A R Y EXECUTIVE SUMMARY
Wage growth differentials are a desirable feature of a well-functioning economy. Such differentials are necessary in order to refl ect differences in local labour market conditions, “catching-up” factors, and diverse productivity developments across sectors and regions. In the context of a monetary union and in the absence of adjustment via exchange rate changes, nominal wages also serve as an important vehicle for adjustment via the competitiveness channel.
The objective of this study is to look at some important aspects of nominal wage dynamics in the euro area, as nominal wages appear to have contributed signifi cantly to differences in unit labour cost developments across countries. The study analyses wage growth differentials by considering both the dispersion of wage growth rates across the euro area countries, i.e. the degree of difference in wage growth rates at a given point in time, and by assessing the degree of synchronisation of wage growth across the euro area countries, i.e. the degree of co-movement of wage growth rates over a certain period of time. Moreover, the study presents evidence on wage level developments across the euro area countries, as wage growth differentials might be attributable to catching-up processes in some countries.
The key fi ndings of this study are the following: • The dispersion of wage growth per
employee and per hour across the euro area countries was on a clear downward trend during the 1980s and the early 1990s. Since about 1993, however, most measures suggest that wage growth dispersion has
fluctuated within a relatively narrow
range. Wage growth dispersion exhibited a similar picture in all main sectors (except agriculture) across the euro area countries, but cross-country wage growth dispersion at the sectoral level was larger and its evolution less stable than wage growth dispersion in the total economy.
• The current degree of wage growth dispersion across the euro area countries appears to be higher than the degree of wage growth dispersion within West Germany, the United States, Italy and Spain. The lower degree of dispersion of wage developments within the benchmark economies might be attributable to a much more advanced convergence process fostered by long histories of a shared currency and a higher degree of economic integration, especially labour mobility, inside the four benchmark areas than within the euro area, as well as lower infl ation dispersion in the benchmark areas.
• The decline in wage growth dispersion in the euro area does not stem from lower wage growth differences for some outliers with respect to the euro area average but can be related to declining differentials in most euro area countries. Taking into account the adjustment process in Germany, following unifi cation, the persistence of wage growth differentials across euro area countries appears to be comparable to that in the benchmark areas.
• Certain longer-term factors appear to be behind wage growth differentials among the euro area countries. Differences in wage growth rates between individual euro area countries and the euro area appear to be positively related to the respective differences between their HICP infl ation and average HICP infl ation in the euro area. Conversely, relative wage growth differentials across euro area countries have largely been unrelated to and are generally higher than relative productivity growth differentials. Although for a number of countries the relative wage and productivity growth differentials appear to be small, countries that combine positive wage growth differentials and negative productivity growth differentials vis-à-vis the euro area average over an extended period – and hence positive unit labour cost growth differentials – run the risk of accumulating losses in competitiveness. It is therefore a challenge for those countries
in which relative wage developments exceed relative productivity developments to ensure that the necessary adjustment mechanisms operate fully, in the sense that wage developments are suffi ciently fl exible and refl ect productivity developments. Wage growth persistence within individual euro area countries – largely refl ecting infl ation persistence and certain institutional factors, such as indexation and multi-year contracts – might also have contributed, to some extent, to wage growth differentials across the euro area countries.
• Wage level convergence, albeit still far from being complete, has played a role in explaining wage growth patterns during the 1980s and the 1990s. In this period, growth in compensation per employee had indeed been visibly slower in countries with high initial levels of compensation, while a higher rate of wage growth had been observed in countries with initially low compensation per employee levels. However, in the period after the inception of EMU, the link between the initial compensation level in 1999 and the subsequent average growth rate of compensation per employee appears barely signifi cant. This seems to imply that some convergence of wage levels took place before 1999, bolstered by the completion of the Single Market, while it came broadly to a halt after the inception of Stage 3 of EMU. As wage level convergence is far from complete, it may continue to be a factor behind wage growth dispersion within the euro area for the foreseeable future.
• The modest decline in the dispersion of wage levels was in line with a modest decline in the dispersion of productivity levels between 1993 and 2006. However, for certain individual euro area countries – both for the total economy as well as for their individual sectors – the developments in relative wage levels have not always followed the developments in relative productivity levels.
• Turning to the analysis of wage growth synchronisation, the cross-correlation analysis
suggests that there are no signifi cant
co-movements in wage developments within the euro area. In particular, the rather high and stable degree of business cycle synchronisation seen in recent years does not seem to have coincided with a similar degree of wage growth synchronisation. This suggests that, while the presence of common shocks might have played a role in the synchronisation of business cycles across euro area countries, wage growth remains dominated by country-specifi c factors. A low degree of wage growth synchronisation and a loose link to more synchronised business cycles might, in fact, be desirable, as in an optimal currency union with synchronised business cycles, adjustment to shocks would take place via relative price and cost changes. On the other hand, structural reasons, related for example to a low degree of competition and a relatively low degree of openness in domestically-oriented sectors in some countries, might also prevent a stronger link between the degree of synchronisation of wage growth rates and business cycle synchronisation in these sectors. This might be considered a potential source for concern, in particular to the extent that such factors prevent relative wage growth developments to follow relative productivity developments.
I I N T R O D U C T I O N 1 INTRODUCTION
Wage growth differentials are a desirable feature of a well-functioning economy. Such differentials are necessary in order to refl ect differences in local labour market conditions, “catching-up” factors, and diverse productivity developments across regions. In the context of a monetary union and in the absence of adjustment via nominal exchange rate changes, nominal wages also serve as an important vehicle for adjustment via the competitiveness channel. In the run up to EMU, there was widespread concern amongst policymakers that signifi cant rigidities and other shortcomings in the wage formation processes across the euro area countries could seriously impair the effi cient
working of EMU.1 One reason for concern was
that excessive nominal wage increases in some euro area countries, particularly in the larger euro area countries, could provoke a tightening of monetary conditions with possibly adverse effects on growth and employment in the entire monetary union. Another concern was that large and persistent positive nominal wage
growth differentials, which do not refl ect
productivity differentials across countries, could lead to substantial increases in unit labour costs in some euro area countries. With nominal exchange rate devaluation no longer being an option, substantial and persistent unit labour cost growth would cause severe losses in competitiveness with adverse repercussions for economic activity and employment in some euro area countries. In particular, it was feared that substantial and persistent above-average unit labour cost growth would ultimately translate into deteriorating labour market conditions in these euro area countries, requiring painful adjustment thereafter.
Several years after the start of the third stage of EMU, the debate on wage growth differentials within EMU is still ongoing, in the light of relatively high and persistent wage growth in some euro area countries and more modest wage developments in some other countries.2 Indeed,
in an environment of relatively small differences
in productivity growth rates across countries, persistent nominal wage growth differences have led to considerably diverse cumulated unit labour cost developments. These differences have, in turn, contributed to signifi cant differentials in competitiveness developments and in infl ation 3,
with repercussions for economic activity and employment over time.
Monetary policy is conducted by the Governing Council of the ECB with the primary objective of maintaining price stability in the euro area as a whole. Monetary policy cannot therefore address differences in wage growth or other
country-specific economic developments. However,
it is necessary for the European Central Bank (ECB) to assess the underlying causes of such wage differentials, as this is key to better understanding euro area wage developments and it facilitates the identifi cation of structural barriers that may hamper macroeconomic adjustments in the euro area.
Against this general background, this study presents some stylised facts on nominal wage differentials across the euro area countries. The objective is to quantify the heterogeneity of wage growth and wage levels from a cross-country standpoint using standard measures for dispersion and synchronisation and to discuss the factors which may be behind these differentials from a cross-country point of view. The study takes a strictly factual approach and does not aim at a normative assessment of wage growth heterogeneity across euro area countries. Moreover, the study is entirely based on a cross-country approach, and it does not consider the working of adjustment processes of individual countries via nominal wages. The study starts with an analysis of the dispersion of wage growth, i.e. the degree of difference in wage growth at a given point in time, across the euro area countries both overall and at the sectoral level. The study then moves on to assess the dispersion of wage levels across the euro area countries, since differences in wage levels could be seen as one major driving factor
See European Commission (1990). 1
See European Commission (2006a), pp. 79-108. 2
See ECB (2005), pp. 61-77. 3
behind wage growth dispersion. Finally, the study presents evidence on the degree of synchronisation of wage growth within the euro area, i.e. the degree of co-movement of wage growth across countries over a certain period of time.
The wage concept used in this study is that of nominal compensation per employee, i.e. overall compensation paid by employers. Apart from negotiated wages, the concept of compensation per employee also includes wage drift and social security contributions. The concept of compensation per employee is a convenient choice for international comparisons owing to the availability of related data and its similar defi nition across countries, as opposed to other “narrower” wage concepts where the defi nitions may differ substantially from one country to the other. In what follows, the words “wage” and “compensation per employee” will be used interchangeably.
Nominal wages play an important role in the assessment of macroeconomic developments in a number of ways. From a business cycle perspective, nominal wages are a key factor driving income growth and distribution. Nominal wage developments also play an important role in shaping the path of overall economic activity, infl ation and employment. While the latter variables may also exert an important impact on nominal wage developments, nominal wages can be regarded as a relatively “exogenous” variable as they are mainly determined in wage negotiations which might or might not take into account other economic relationships. From a cross-country point of view and compared with other benchmark areas, nominal wages are the main driving force behind the dispersion of unit labour cost developments in an environment of relatively modest divergence in productivity growth. In the context of monetary union and the absence of exchange rates as the traditional “bailout”, nominal wages serve as a key instrument for adjustment via the competitiveness channel and play an important role in the analysis of competitiveness developments across the euro area countries. Thus, nominal wages are the
starting point when considering unit labour cost and real wage developments.
With respect to the question of whether to consider wages per hour or per person, economic theory would suggest a focus on wages per hour worked as the most accurate measure of labour costs. However, empirical work has shown that both measures provide useful information on wage developments. While in past decades, wages in terms of persons could have been considered as a rather good approximation of wages per hour worked, in more recent times this might not be the case. In fact, one of the key stylised facts of the euro area’s labour markets is that the annual average working time per worker has declined substantially across the euro area countries over the last 25 years.4 This
is attributable to the increased use of part-time working arrangements, which is often related to the greater number of women entering the labour market, to institutional factors such as tax wedges which create disincentives to work, or to specifi c policy measures including changes in working time regulations, such as the introduction of the 35 hour week in France and recent labour market reforms in Germany and Italy.5 As was the case in France, the decline in
working time has often been accompanied by increasing hourly compensation in order to broadly maintain monthly compensation levels.6
Against this background, results will be presented as far as possible on the basis of data for both compensation per employee and compensation per hour.
The following analysis is backward looking and is built as far as possible on data covering the
12 countries that joined EMU before 2006.7
Our data requirements in terms of frequency, For a detailed discussion see Leiner-Killinger et al. (2005). 4
Specifi cally, the introduction of very fl exible employment 5
contracts in Italy had the effect of triggering a strong increase of “part-time” workers, thus creating a signifi cant gap between the growth rate of employees measured in heads and that of total hours worked.
See ECB (2006), pp. 43-44. 6
Due to limited availability of data, Malta, Cyprus and Slovenia 7
are not included in the analysis. However, Annex 2 shows that from 1996 onwards, the inclusion of these countries does not affect the main conclusions of the analysis.
I I N T R O D U C T I O N sample length and degree of sectoral
disaggregation required the use of various databases. National account data (ESA2000) of compensation per employee are available for all euro area countries at an annual frequency. However, when the analysis requires the use of quarterly information, data limitations necessitate the use of a euro area aggregate (EA8) on the basis of only eight countries, encompassing Germany, France, Italy, Spain, the Netherlands, Belgium, Austria and Finland. The national account data cover the total economy and the six largest sectors (agriculture, industry excluding construction, construction, trade and transport, fi nancial intermediation, and other services). However, national statistical offi ces in most euro area countries have not or have only recently started to collect data on the number of hours worked, in annual and quarterly terms. To overcome this limitation of national accounts, the EU KLEMS database compiled by the Groningen Growth and Development Centre (GGDB) has been utilised to enlarge the available information set.8 In particular, these
alternative sources allow for an analysis of wage dispersion in terms of hours worked across the various euro area countries and across a large number of sectors. This data currently extend only up to 2004. Given the diffi culties in evaluating the reliability of hours worked, which are not included in the “offi cial”, i.e. national statistical offi ce databases, this paper will, in general, put more emphasis on the results found in terms of persons.
With respect to the starting date of the data sample, while the data are available from 1980 onwards, the following analysis is mainly focused on the period from 1993 to 2006. From 1993, bilateral exchange rates of the 12 countries which had adopted the single currency before 2006 were either factually fi xed or fl uctuated within a relatively narrow band, roughly allowing for the hypothesis that nominal wages – and not exchange rate movements – was the key variable determining relative unit labour cost developments across euro area countries. Finally, all data used in this study are denominated in euro using the respective
irrevocable conversion rates. This means that exchange rate movements across euro area countries do not have any impact on the growth rates or levels shown in this study.
For details on the databases and the sectoral disaggregation, 8
2 DISPERSION IN WAGE GROWTH RATES ACROSS EURO AREA COUNTRIES OVER TIME This chapter assesses the degree of dispersion in nominal wage growth rates across the euro area countries over time. The analysis is conducted by measuring wages both in terms of persons (employees) and per hour worked for the total economy and for the six main sectors. A number of references can be used to assess the current degree of wage growth dispersion. In this chapter, a historical benchmarking exercise will be carried out which allows changes in wage growth dispersion over time across the euro area countries to be assessed. A particular focus will be the comparison of wage growth dispersion since the start of EMU against that during the pre-EMU period.
From a historical perspective, as can be seen in Chart 1, the dispersion of annual wage growth rates per employee across the 12 euro area countries, as measured by the unweighted standard deviation, has been on a clear downward trend since the early 1980s. The unweighted standard deviation fell from an average of 6.0 percentage points in the 1980s to about 3.4 percentage points during the 1990s, and has thereafter declined further to historically low levels, averaging just 2.0 percentage points during the period 1999 to 2006. Dispersion of wage growth per hour across the euro area countries declined broadly in line with dispersion of wage growth per employee. It is important to note that most of the decline in wage growth dispersion occurred during the 1980s and early 1990s, i.e. the period during which the option of bilateral exchange rate adjustments was in principle still available but less and less used as more countries entered the ERM and as exchange rate movements in the ERM were more limited. The decline in nominal wage growth dispersion during that period accompanied a similar decline in infl ation dispersion, which will be discussed further in Chapter 5. Since the early 1990s, however, the degree of wage growth dispersion fl uctuated within a relatively narrow band, and the slope of the downward trend eased substantially.
The analysis so far was based on the unweighted standard deviation, which gives equal importance to all euro area countries in such a fact-fi nding analysis. However, as the monetary policy of the ECB is geared to the euro area as a whole, weighted measures of wage growth dispersion might also provide relevant information.9 As can
be seen in Chart 2 below, wage growth dispersion in weighted terms (as measured by the weighted standard deviation) has been clearly lower than the unweighted measure during the 1990s and the early 2000s. This implies a larger degree of wage growth dispersion stemming from the smaller euro area countries during that period. While the unweighted standard deviation for wages per worker exhibits some downward trend since 1993, the weighted measures show some fl uctuations within a relatively narrow horizontal band. This again suggests that wage growth differentials stemming from smaller euro area countries have declined over time.
The standard deviation is only a summary indicator of the statistical distribution of a
See Annex 3 for an overview of additional dispersion measures. 9
For a discussion of the advantages and disadvantages of various dispersion measures see also Benalal et al. (2006), pp. 9-10. Chart 1 Dispersion of compensation growth across the euro area countries
(unweighted standard deviation, percentage points)
0 1 2 3 4 5 6 7 8 0 1 2 3 4 5 6 7 8 1981 1984 1987 1990 1993 1996 1999 2002 2005 EMU Stage III per employee per hour
Sources: Own computations based on Eurostat, European Commission and EU KLEMS data.
2 D I S P E R S I O N I N W A G E G R O W T H R A T E S A C R O S S E U R O A R E A C O U N T R I E S O V E R T I M E
series – in this case wage growth rates across the euro area countries. Focusing only on the standard deviation may therefore conceal important information. For example, it might be relevant to complement the information provided by the standard deviation with the
average, as well as the maximum and minimum growth rates. The positioning of the average wage growth rate between the minimum and maximum growth rates would indicate whether a certain degree of dispersion relates to the underperformance or over-performance
Chart 2 Dispersion in compensation growth in the total economy, unweighted and weighted measures
(percentage points)
unweighted SD-EA weighted SD-EA
a) Per employee b) Per hour
0 1 2 3 4 5 0 1 2 3 4 5 1993 1995 1997 1999 2001 2003 2005 0 1 2 3 4 5 0 1 2 3 4 5 1993 1995 1997 1999 2001 2003
Sources: Own computations based on (a) Eurostat and European Commission data and on (b) EU KLEMS data. Note: SD = standard deviation.
Chart 3 Euro area compensation growth and the maximum and minimum growth rates across
the euro area countries
(percentage changes)
EA maximum minimum
a) Per employee b) Per hour
-4 0 4 8 12 16 -4 0 4 8 12 16 1993 1995 1997 1999 2001 2003 2005 -4 0 4 8 12 16 -4 0 4 8 12 16 1993 1995 1997 1999 2001 2003
of the largest countries. Indeed, as can be seen in Chart 3, the average euro area growth rate has over the full horizon been relatively close to the lowest wage growth rate across
the 12 euro area countries. This confi rms
persistently low wage growth in some large euro area countries, while some smaller euro area countries seem to have experienced more dynamic wage developments.
The decline in dispersion of wage growth at the total economy level can be related to declining dispersion of wage growth in all major sectors.10
Looking at the six main sectors of the total economy – agriculture, industry excluding construction, construction, trade and transport, fi nancial intermediation, and other services – dispersion of wage growth has declined in all sectors since the early 1990s (Table 1 and Table 2). However, it is worth noting that cross-country wage growth dispersion at the sectoral level is larger and its evolution less stable than in the total economy, regardless of whether expressed in compensation per hour worked or
per employee.11 This evidence on sectoral wage
differentiation partly explains why it was considered necessary to provide sectoral information in this study. Among the six main sectors, wage growth dispersion has, overall, been the highest in the agricultural sector, which might be attributable to the large structural differences in that sector across countries refl ected in different combinations of factor inputs.
In sum, the dispersion of wage growth per employee and per hour across the euro area countries was on a clear downward trend during the 1980s and the early 1990s. Since about 1993, however, most measures suggest
that wage growth dispersion has fl uctuated
within a relatively narrow range. Wage growth dispersion exhibited a similar picture in all main sectors (except agriculture) across the euro
On sectoral wage diversity in the euro area see Genre et al (2005). 10
See Annex 3 for additional charts on the sectoral evolution of 11
dispersion across sectors.
Table 1 Dispersion in compensation per employee growth across euro area countries by sector
(unweighted standard deviation; percentage points)
Total economy Agriculture Industry excluding construction Construction Trade and transport Financial intermediation Other services 1993-1995 2.7 - - - -1996-1998 2.7 5.0 2.7 3.6 3.1 3.8 3.7 1999-2002 2.0 5.7 1.9 3.1 1.8 2.8 2.4 2003-2005 1.5 4.1 1.6 2.0 1.8 1.7 1.7
Source: Own computations based on Eurostat data. The choice of the periods captures the path of wage growth dispersion before and after the start of EMU.
Table 2 Dispersion in compensation per hour worked growth across euro area countries by sector
(unweighted standard deviation; percentage points)
Total economy Agriculture Industry excluding construction Construction Trade and transport Financial intermediation Other services 1993-1995 1.9 10.9 3.1 3.2 2.7 2.8 2.3 1996-1998 3.2 3.6 4.6 4.3 3.5 4.0 4.2 1999-2002 1.8 4.6 2.8 2.8 1.9 2.5 2.3 2003-2004 1.4 4.3 2.0 2.9 1.7 2.4 1.7
Source: Own computations based on EU KLEMS data. The choice of the periods captures the path of wage growth dispersion before and after the start of EMU.
2 D I S P E R S I O N I N W A G E G R O W T H R A T E S A C R O S S E U R O A R E A C O U N T R I E S O V E R T I M E area countries, but cross-country wage growth
dispersion at the sectoral level was larger and its evolution less stable than wage growth dispersion in the total economy. The following chapters analyse these fi ndings from various perspectives in order to assess the current degree of wage differentiation across the euro area countries.
3 WAGE GROWTH DISPERSION IN THE EURO AREA COMPARED TO THAT IN SELECTED BENCHMARK AREAS
This section analyses dispersion in wage growth developments among regions in the United
States, West Germany,12 Italy and Spain, in
order to provide an “external” benchmark for assessing the degree of wage growth dispersion within the euro area. Wage growth dispersion in these benchmark areas is expressed in terms of unweighted standard deviations.
As can be seen in Chart 4, the degree of dispersion of compensation per employee growth across the euro area countries has generally been substantially higher than that in the benchmark areas. While wage growth dispersion has been relatively similar among the US regions, West German states, the Italian regions and the Spanish autonomous communities, wage growth dispersion across the euro area countries remains higher. It is also interesting to note that wage growth dispersion in the benchmark areas has been remarkably stable over time, while wage growth dispersion across euro area countries followed a weak but continuous downward trend.
It should be pointed out, however, that a number of technical and statistical caveats apply when comparing wage growth dispersion in the euro area with that in certain individual countries. Among others, these caveats include different computational methods of different statistical institutes, as well as the different numbers and sizes of the geographical entities considered.13
More fundamentally, in making such a comparison, it is implicitly assumed that the euro area in its entirety could be seen as a country like each of the benchmark areas. On this assumption, wage growth dispersion in the euro area could in the longer term be expected to converge towards the level recorded in the benchmark areas. A number of factors should be borne in mind when considering the higher degree of wage dispersion of wage growth in the euro area.
First, while the regions within the benchmark areas have shared a common currency for many decades, if not centuries, euro area countries have done so for only a few years so far. To the extent that one would expect a single currency and the absence of the exchange rate “bailout” to foster nominal wage growth convergence via an increased awareness of wage-setting parties to safeguard competitiveness, such a process should at this stage be much more advanced in the benchmark areas than in the euro area. Second, while economic integration within the euro area has made progress during the past decades, the level of integration within the benchmark areas should still be much higher. One area where economic integration appears to be less advanced within the euro area concerns cross-border labour mobility. In theory, high
The analysis focuses on the former West German Länder 12
excluding Berlin. This constitutes a more meaningful benchmark than the whole of Germany, as the dispersion measures for West Germany excluding Berlin are to a lesser extent affected by the distortions of the German unifi cation process.
For a review of the caveats on the analysis of benchmark areas 13
see Section 1.1.1 in Benalal et al. (2006).
Chart 4 Dispersion in compensation per employee growth in benchmark areas
(unweighted standard deviation; percentage points)
0 1 2 3 4 0 1 2 3 4 1993 1995 1997 1999 2001 2003 2005 EA West Germany Italian regions
Spanish autonomous communities US
Sources: Own computations based on European Commission, Eurostat data and data from the national statistical institutes of Germany (DESTATIS), Spain (INE), Italy (ISTAT), United States (Bureau of Economic Analysis).
3 W A G E G R O W T H D I S P E R S I O N I N T H E E U R O A R E A C O M P A R E D T O T H A T I N S E L E C T E D B E N C H M A R K A R E A S labour mobility would tend to dampen wage
growth dispersion in two ways. First, in the longer term, in areas characterised by a high degree of labour mobility, labour would tend to move to regions with higher wage levels and away from regions with lower wage levels. This process would eventually trigger an equalisation of wage levels across regions. A lower degree of dispersion in wage levels would, in turn, lead to lower wage growth dispersion, in the absence of regional-specifi c shocks to prices or productivity. Second, in response to a shock, labour mobility would tend to mitigate the impact on wage growth in the affected region and hence on wage growth divergence. If a region were hit by an adverse shock on activity, the higher the degree of labour mobility, the more the decline in the labour demand would be matched by a decline in the labour force via a net outfl ow of workers, limiting the impact on wage developments.
Detailed and comparable data on labour mobility
are diffi cult to obtain and they should be
interpreted with caution.14 Available empirical
evidence 15 suggests, however, a rather limited
labour mobility in the euro area in comparison with the United States, implying that the channels towards lower wage growth dispersion across euro area countries have not been operating at the same speed as across US regions. Indeed, as will be shown in more detail in Chapter 6 below, dispersion of wage levels has been and remains much larger across the euro area countries than across regions in the benchmark areas. Moreover, empirical studies have shown that employees in the euro area tend to leave the labour force in response to a decline in labour demand in their region rather than migrate to another region or country.16 There are
many reasons behind the low labour mobility across the euro area countries. Linguistic, cultural, legal and other differences across countries and the costs involved in moving
residence may play a role.17 As the process
aimed at removing the artifi cial barriers to labour mobility across (and within) euro area countries – such as differences in tax and social security systems, residence restrictions,
nationality limitations on recruitment in the public sector, infl exible housing market, etc. – is likely to be slow, labour market mobility is likely to remain too limited to induce a rapid equalisation of wage levels or wage developments across countries. In this regard, limited labour mobility will remain an important factor behind ongoing dispersion in wage growth and levels within the euro area.
Third, an important institutional aspect of the euro area concerns the wage bargaining system. While the three benchmark euro area countries feature a high degree of centralisation of wage bargaining and/or coordination of wage bargaining, this is almost non-existent at the euro area level and in the United States. Coordination efforts across the euro area
countries and supranational wage norms 18 by
which trade unions could commit to seeking wage increases that cover infl ation and take into account productivity gains/losses, have to date mainly led to an exchange of information, including sometimes the participation of foreign observers in wage negotiations.19
A higher degree of centralisation of wage bargaining might not be a recommended option for the euro area as a whole given its costs. In particular, wage bargaining centralisation reduces the degree of differentiation of wages according to local labour market conditions as well as productivity and competitiveness developments – and this might imply that the response to asymmetric shocks is hindered. A fl exible response of wages to such shocks,
Cross-country comparisons of migration should be interpreted 14
with caution as they depend upon the size of the regions considered. The smaller the size of the region, the larger ceteris paribus is the size of measured migration or commuting fl ows. See OECD (2005), pp. 77-95, for data on migration and 15
commuting within euro area countries and other OECD countries. For more evidence, see European Commission (2002a). For an overview, see OECD (2005), p. 92.
16
As references on this topic, see Blanchard et al. (1992); Obstfeld 17
et al. (1998) and Heinz et al. (2006).
Among the sectoral trade union federations, the European 18
Metalworkers’ Federation (EMF) has been the fi rst to establish a coordination rule; some other industry federations have followed. For an overview see Dufresne et al. (2002).
which would be prevented by a high degree of wage bargaining centralisation, would be even more important in a situation where labour mobility is low.
Fourth, the higher degree of dispersion of wage developments within the euro area with respect to the four benchmark areas might also be attributable to macroeconomic factors. The developments of wage dispersion in the euro area and in the benchmark regions seem to be partly related to the evolution of infl ation
divergence (Chart 5).20 While infl ation
dispersion across regions in West Germany, Italy, Spain and across 14 US Metropolitan Statistical areas was basically fl at during the exhibited period, dispersion in euro area infl ation fell considerably in the 1990s and has thereafter been roughly stable. Interestingly, infl ation dispersion across the West German, Spanish and Italian regions has been notably lower than that in the euro area and the United States in the same period.
Finally, the pattern of the dispersion of wage growth across euro area countries does not appear to be related to that of productivity differentials. As Chart 6 shows, productivity differentials across the euro area countries have been relatively stable between 1993 and 2001, while they have been trending downward since then. Productivity differentials across the euro area countries have broadly matched the differentials recorded in the benchmark areas.
To sum up, the current degree of wage growth dispersion across the euro area countries appears to be higher compared with the degree of wage growth dispersion within West Germany, the United States, Italy and Spain. The lower degree of dispersion of wage developments within the four benchmark areas might be attributable to a much more advanced For a review of the caveats on the analysis of benchmark areas 20
see Section 1.1.1 in Benalal et al. (2006).
Chart 6 Dispersion in productivity growth in benchmark areas
(unweighted standard deviation; percentage points)
0 1993 1997 2001 2005 1 2 3 4 0 1 2 3 4 EA West Germany Italian regions
Spanish autonomous communities US
Sources: Own computations based on European Commission, Eurostat data and data from the national statistical institutes of Germany (DESTATIS), Spain (INE), Italy (ISTAT), United States (Bureau of Economic Analysis).
Note: Spanish and Italian data are available from 1996 and 2001, respectively.
Chart 5 Dispersion in inflation in benchmark areas (percentage points) 0 1 2 3 4 0 1 2 3 4 EA West Germany Italian regions
Spanish autonomous communities US
1993 1997 2001 2005
Sources: Own computations based on European Commission, Eurostat data and data from the national statistical institutes of Germany (DESTATIS), Spain (INE), Italy (ISTAT), United States (Bureau of Economic Analysis).
3 W A G E G R O W T H D I S P E R S I O N I N T H E E U R O A R E A C O M P A R E D T O T H A T I N S E L E C T E D B E N C H M A R K A R E A S convergence process fostered by long histories
of a shared currency, as well as a higher degree of economic integration, especially labour mobility, and lower infl ation dispersion in the benchmark areas. In this respect, further labour market reforms aimed at facilitating labour mobility via commuting and/or migration would be an important step towards improving the capacity of euro area countries to adjust to shocks and eventually towards lower dispersion in wage levels and their growth rates.
4 COUNTRY DEVELOPMENTS BEHIND EURO AREA WAGE GROWTH DISPERSION
This chapter investigates which euro area countries have mainly contributed to the evolution of wage growth dispersion. In particular, the question of whether wages in some countries have grown at rates persistently above or below the euro area average is addressed.
Comparing the periods before 1999 and afterwards, as can be seen from Chart 7, the differences of annual average growth rates of compensation per employee in euro area countries relative to the euro area average have declined across many euro area countries. In other words, the decline in wage growth dispersion in the euro area between the periods 1993-1998 and 1999-2006 does not stem from lower wage growth differences for some outliers with respect to the euro area average, but can be related to declining differentials in most euro area countries (Chart 7). Between the period 1993-1998 and the period 1999-2006, the decline in dispersion of wage growth rates appears to stem from Germany, Austria, France, Belgium, the Netherlands, Portugal and Greece, while wage growth differentials with respect to the euro area average increased, albeit from low levels, in Italy, Spain, Finland, Ireland and Luxembourg. Considering only the degree of wage growth dispersion across countries may not be suffi cient. A high degree of dispersion in compensation developments may be a concern if it is caused by persistent positive wage growth differentials in some countries that are not supported by positive productivity growth differentials. This would lead to sustained losses in cost competitiveness in certain countries, with adverse consequences for domestic output and employment developments. While some persistence in wage growth differentials may be a natural result of certain factors – such as productivity growth differentials, longer-lasting adjustment processes or may simply be associated with compensation convergence processes in some countries – persistence may also be related to structural rigidities and this should be a cause for concern.
As can be seen in Table 3, all euro area countries except Germany and, to a lesser extent, Austria, have recorded wage growth for many years persistently above the euro area average during the past 14 years (see Chapter 5). The major factor behind this divergence between Germany and the rest of the euro area is an adjustment process in Germany following unifi cation. Wage growth in Germany in the immediate aftermath of unifi cation exceeded that in the rest of the euro area countries by an accumulated 30% between 1991 and 1994, and with productivity differentials being much smaller, relative unit labour costs rose by a similar extent as did wages in Germany. With adjustment via a devaluation of the D-Mark not being an option, and with productivity differentials remaining rather limited, wage growth had to fall substantially below that in the rest of the euro area in order to restore competitiveness. This process started in the second half of the 1990s
and gained momentum in the past few years.21
Given Germany’s large weight within the euro area, it appears logical that most other countries On the adjustment process in Germany, see for example 21
European Commission (2002b, 2006b). Chart 7 Annual average growth in
compensation per employee relative to the euro area (percentage points) -4 -2 0 2 4 6 8 -4 -2 0 2 4 6 8 DE AT IT ES BE FR FI NL LU PT IE GR 1993-1998 1999-2006
Source: Own computations based on European Commission and Eurostat data.
Note: Countries are shown in ascending order for the period 1999-2006.
4 C O U N T R Y D E V E L O P M E N T S B E H I N D E U R O A R E A
W A G E G R O W T H D I S P E R S I O N
recorded persistent above-average wage growth rates during the past decade. However, the differentials appear to have remained rather limited in Belgium, Spain (since 1999), France, Italy, and Austria.
When excluding Germany from the euro area aggregate in order to account for that country-specifi c adjustment process (Table 4) a signifi cant degree of convergence occurred in most countries. Wage growth differentials compared with the rest of the euro area were minor in the case of Belgium, Italy, the Netherlands, Austria and Finland, and declined substantially in Greece, Spain, France, and Portugal. Country-specifi c
factors could explain the sustained wage growth differentials in Luxembourg (weight of fi nancial sector) and Ireland (relative productivity growth, see Chapter 5).
Some persistence of wage growth differentials can also be seen in the benchmark regions. In the United States, ten of the 50 states 22 have
shown a persistent upward bias in the period between 1980 and 2002, and in West Germany, Bavaria showed a persistent positive differential in wage growth against the West German
These US States are: Connecticut, District of Columbia, 22
Maryland, Minnesota, New Hampshire, New Jersey, New York, North Carolina, Rhode Island and Washington.
Table 3 Nominal compensation per employee growth rates relative to the euro area
(percentage points) 1993-1998 1999-2006 1999 2000 2001 2002 2003 2004 2005 2006 Belgium 0.8 0.4 0.9 -0.4 1.0 1.2 -0.6 -0.1 0.8 0.6 Germany 0.2 -1.2 -1.4 -0.6 -1.0 -1.3 -0.7 -1.7 -1.8 -1.5 Ireland 2.1 3.6 2.0 5.6 4.9 2.9 2.8 4.5 3.3 2.8 Greece 8.3 4.1 4.0 3.5 3.1 7.4 2.4 3.7 4.9 3.8 Spain 1.8 0.5 -0.4 0.3 1.1 0.8 0.6 0.7 0.3 1.1 France -0.1 0.5 -0.3 -0.1 -0.2 0.8 0.5 1.3 1.1 1.1 Italy 1.4 0.2 -0.5 -0.2 0.3 -0.4 0.2 1.2 1.1 0.3 Luxembourg 0.7 1.3 1.4 2.9 0.9 1.0 -0.4 2.1 2.0 0.2 Netherlands 0.3 0.9 0.8 2.1 2.3 1.7 1.1 1.1 -0.6 -1.3 Austria 0.5 -0.6 -1.0 -0.4 -1.6 -0.5 -0.1 -1.1 -0.1 0.3 Portugal 4.0 1.7 2.4 4.2 2.8 1.4 0.5 0.5 1.2 0.3 Finland 0.8 1.0 -0.4 1.3 2.1 -0.8 0.6 1.5 2.1 1.3
Unweighted standard deviation 2.7 1.7 1.6 2.1 1.8 2.3 1.1 1.8 1.8 1.5
Weighted standard deviation 1.6 1.3 1.0 1.1 1.7 1.4 0.9 1.5 1.5 1.3
Source: Own computations based on European Commission data.
Table 4 Nominal compensation per employee growth rates relative to the euro area excluding Germany (percentage points) 1993-1998 1999-2006 1999 2000 2001 2002 2003 2004 2005 2006 Belgium 0.0 0.0 1.2 -0.7 0.5 0.6 -0.9 -0.9 -0.6 0.5 Germany -0.5 -1.7 -1.2 -0.9 -1.6 -1.8 -1.0 -2.5 -2.7 -1.9 Ireland 1.3 3.2 2.2 5.3 4.3 2.3 3.8 3.5 2.5 1.8 Greece 7.5 3.6 4.2 3.2 2.5 6.8 2.0 2.9 4.0 3.2 Spain 1.1 -0.1 -0.2 0.0 0.6 0.2 0.2 -0.1 -0.4 -0.3 France -0.9 0.1 0.0 -0.4 -0.7 0.2 0.2 0.6 0.5 0.4 Italy 0.7 -0.2 -0.3 -0.5 -0.2 -0.9 -0.1 0.4 0.2 -0.2 Luxembourg -0.1 1.0 1.7 2.6 0.4 -0.1 -0.4 1.1 1.3 1.9 Netherlands -0.5 0.6 1.1 1.8 1.8 1.2 0.8 0.5 -1.5 -0.4 Austria -0.3 -1.0 -0.8 -0.8 -2.1 -1.1 -0.5 -2.0 -0.2 -0.3 Portugal 3.3 1.2 2.6 3.8 2.3 0.8 0.2 -0.2 0.4 -0.3 Finland 0.0 0.4 -0.1 1.0 1.6 -1.3 0.2 0.7 1.2 0.1
Source: Own computations based on European Commission data.
Note: Each entry refers to the relative compensation per employee growth of the indicated country vis-à-vis the euro area excluding Germany. In the case of Germany, the entry shows wage growth in Germany compared with that in the rest of the euro area.
average in the period 1992-2005. Moreover, while none of the Italian regions exhibited persistent above-average wage growth, four out
of the 18 autonomous communities in Spain 23
showed persistently above-average wage increases during the period 1996-2003.
In sum, the decline in wage growth dispersion in the euro area does not stem from lower wage growth differences for some outliers with respect to the euro area average but can be related to declining differentials in most euro area countries. Taking into account the adjustment process in Germany following unifi cation, the persistence of wage growth differentials across euro area countries appears to be comparable to that in the benchmark areas.
The four Spanish autonomous communities are: Aragón, 23
5 F A C T O R S B E H I N D W A G E G R O W T H D I F F E R E N T I A L S A M O N G T H E E U R O A R E A C O U N T R I E S
5 FACTORS BEHIND WAGE GROWTH
DIFFERENTIALS AMONG THE EURO AREA COUNTRIES
Regarding the factors that may be behind wage growth differentials across the euro area countries, one may distinguish between shorter-term factors, such as the relative strength of domestic demand vs. supply, and longer-term factors.
The most relevant long-term factors on which we focus in this chapter are infl ation differentials, productivity growth differentials and wage growth persistence within a country. Differences in wage levels are dealt with in Chapter 6. Given the interdependence of the development of wages and consumer price infl ation at the national level, one would a priori expect a positive correlation between relative wage growth and relative HICP infl ation across euro area countries. Indeed, differences in wage growth rates between individual euro area
countries and the euro area appear to be positively related to the respective differences between their HICP infl ation and average HICP infl ation in the euro area. As can be seen from Chart 8, euro area countries with above-average
HICP infl ation also tended to record
above-average wage growth rates, both during the period 1993-1998 and since 1999. It should be noted, however, that for a number of euro area countries (Belgium, Germany, France, Austria and Finland), the differentials of both wage
growth and HICP infl ation to the euro area
average have been relatively small during both periods.24 In particular, relatively substantial
positive wage and infl ation differentials have been recorded for Greece, Ireland and Portugal in the period since 1999, probably refl ecting
country-specific developments (catching-up
process in Greece, strong domestic demand in Ireland and, partly, public sector wage increases The differences relative to the euro area average would be 24
further reduced if the country-specifi c adjustment process in Germany, which included both comparatively low infl ation and wage growth rates, were taken into account.
Chart 8 Differences in average wage growth and average HICP inflation relative to the euro area
(percentage points)
x-axis: HICP inflation (deviation from EA) y-axis: wage growth (deviation from EA)
a) 1993 to 1998 b) 1999 to 2006 -2 -1 0 1 2 3 4 5 6 7 8 -2 -1 0 1 2 3 4 5 6 7 8 8 FR NL GR PT IT ES IE AT BE FIDE LU -2 0 2 4 6 R2 = 0.90 (R2* = 0.42) -2 -1 0 1 2 3 4 5 6 7 8 -2 -1 0 1 2 3 4 5 6 7 8 2 L R2 = 0.64 (R2* = 0.45) F -1 0 1 I FR NL AT IT ES BE U PT IE GR DE
Sources: Own computations based on Eurostat and European Commission data.
Note: R2* in the parenthesis denotes the R-squared computed excluding outliers, namely Greece and Portugal in panel (a) and Greece and Ireland in panel (b). Wage growth is defi ned as growth in compensation per employee.
in Portugal). Even when excluding these outliers, the correlation between relative wage growth and relative infl ation appears signifi cant, as indicated by the adjusted R-squared.25
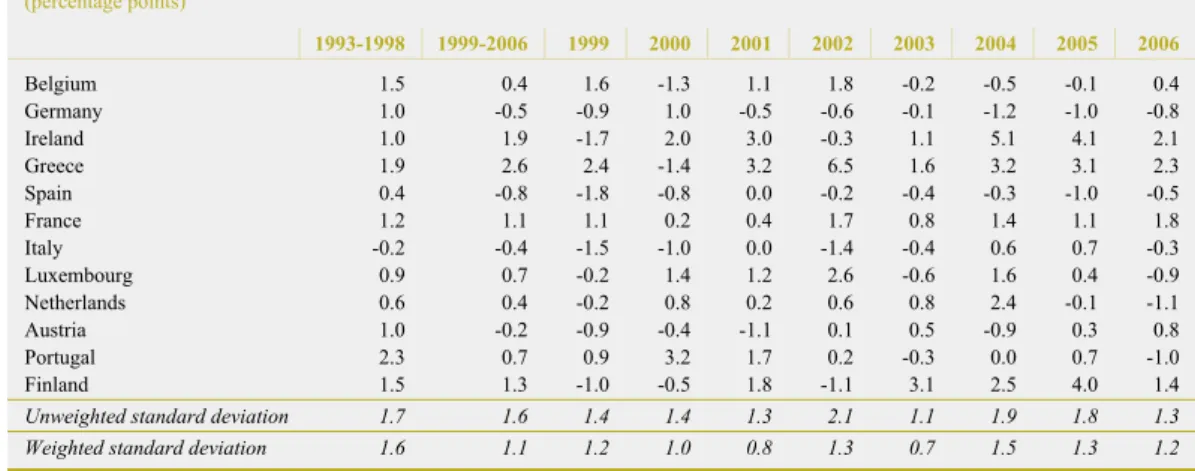
The divergence of real wage growth across euro area countries hardly differs from the divergence of nominal wage growth in the period 1999-2006 (see Table 3 and Table 5). The standard deviation of real wage growth rates (nominal compensation per employee defl ated by the private consumption defl ator) averages 1.6 percentage points during the period 1999-2006, compared with an average standard deviation of 1.7 percentage points for nominal wage growth dispersion. Looking at individual countries, it is notable that almost all countries which recorded nominal wage growth above or below the euro area average showed the same differential in the case of real wages. The two exceptions to this pattern are Spain and Italy, where real wage growth since 1999 has been on average lower than that in the euro area as a whole, while nominal wage growth in these countries exceeded that of the euro area. In Spain, this appears to refl ect the impact of strong domestic demand on mark-ups, pushing
up infl ation, and the dampening impact of
immigration on nominal compensation per employee growth and on productivity in recent years. In Italy this appears to be related to the
abolishment of automatic wage indexation since 1993 and to the relatively disappointing performance of productivity growth.
As with the relationship between wage growth
and infl ation, a priori one would expect a
positive link between relative wage and productivity developments across euro area countries, in the sense that those countries that experienced above (below) average wage growth also experienced above (below) average productivity growth. However, relative wage growth differentials across euro area countries have not been systematically related to and are generally higher than relative productivity growth differentials in both the periods examined (see Chart 9). As regards the period 1999-2006, this conclusion is particularly true when the outliers, namely Greece and Ireland, are excluded from the computation (Chart 9b), as indicated by the adjusted R-squared, which falls to zero in that case. It should be noted, however, that for a number of euro area countries, the differentials of both wage growth and productivity growth with respect to the euro area average have been rather small during both periods.
From an econometric point of view, the analysis is limited to a 25
rather small sample of countries – in comparison for instance with the number of US States – which has a negative impact on the robustness of the empirical analysis.
Table 5 Real compensation per employee growth rates relative to the euro area
(percentage points) 1993-1998 1999-2006 1999 2000 2001 2002 2003 2004 2005 2006 Belgium 1.5 0.4 1.6 -1.3 1.1 1.8 -0.2 -0.5 -0.1 0.4 Germany 1.0 -0.5 -0.9 1.0 -0.5 -0.6 -0.1 -1.2 -1.0 -0.8 Ireland 1.0 1.9 -1.7 2.0 3.0 -0.3 1.1 5.1 4.1 2.1 Greece 1.9 2.6 2.4 -1.4 3.2 6.5 1.6 3.2 3.1 2.3 Spain 0.4 -0.8 -1.8 -0.8 0.0 -0.2 -0.4 -0.3 -1.0 -0.5 France 1.2 1.1 1.1 0.2 0.4 1.7 0.8 1.4 1.1 1.8 Italy -0.2 -0.4 -1.5 -1.0 0.0 -1.4 -0.4 0.6 0.7 -0.3 Luxembourg 0.9 0.7 -0.2 1.4 1.2 2.6 -0.6 1.6 0.4 -0.9 Netherlands 0.6 0.4 -0.2 0.8 0.2 0.6 0.8 2.4 -0.1 -1.1 Austria 1.0 -0.2 -0.9 -0.4 -1.1 0.1 0.5 -0.9 0.3 0.8 Portugal 2.3 0.7 0.9 3.2 1.7 0.2 -0.3 0.0 0.7 -1.0 Finland 1.5 1.3 -1.0 -0.5 1.8 -1.1 3.1 2.5 4.0 1.4
Unweighted standard deviation 1.7 1.6 1.4 1.4 1.3 2.1 1.1 1.9 1.8 1.3
Weighted standard deviation 1.6 1.1 1.2 1.0 0.8 1.3 0.7 1.5 1.3 1.2
Sources: Own computations based on European Commission data. Real compensation per employee is measured as compensation per employee defl ated by the private consumption defl ator.
5 F A C T O R S B E H I N D W A G E G R O W T H D I F F E R E N T I A L S A M O N G T H E E U R O A R E A C O U N T R I E S
Keeping in mind the caveat to such an analysis as mentioned above, an important message can be drawn from these fi ndings. While for a number of countries the relative wage and productivity growth differentials appear to be small, countries that combine positive wage growth differentials and negative productivity growth differentials vis-à-vis the euro area average over an extended period – and hence positive unit labour cost differentials – run the risk of accumulating losses in competitiveness. Such a risk might be seen in particular in the group of countries in the upper left quadrant of charts 9a and b, respectively. This suggests that wage-setting parties in some countries might not have yet fully adjusted to the constraints of a currency union, which does not allow for the “emergency exit” of exchange rate devaluation. It is therefore a challenge for those countries in which relative wage developments exceed relative productivity developments to ensure that the necessary adjustment mechanisms operate fully, in the sense that wage developments are suffi ciently fl exible and refl ect productivity developments.
A rather similar picture emerges when looking at the relationship between wage and productivity developments across the US regions (Chart 10). Also in this case there appears to be a rather loose relationship, although somewhat stronger than across the euro area countries when adjusted for outliers between relative wage and productivity growth differentials.
Wage growth persistence within individual euro area countries might also have contributed over time to wage growth differentials across countries. A time-series approach could be used to examine this point. However, wage growth persistence may not only depend on institutional features which would be captured by such an approach, but might also be driven by persistence in important explanatory factors of wage developments, such as infl ation and productivity growth. In order to assess the impact of the latter factors, it is also important to examine the degree of persistence of these determinants and compare it to the persistence of wage growth. In order to assess the extent of wage growth persistence in individual euro area countries over time and relate it to that of productivity
Chart 9 Differences in average wage growth and average productivity growth relative to the euro area
(percentage points)
x-axis: productivity growth (deviation from EA) y-axis: wage growth (deviation from EA)
a) 1993 to 1998 b) 1999 to 2006 -2 -1 0 1 2 3 4 5 6 7 8 -2 -1 0 1 2 3 4 5 6 7 8 4 FR NL GR PT IT IE ES AT FI DE LU R2 = 0.03 -2 -1 0 1 2 3 BE -2 -1 0 1 2 3 4 5 6 7 8 -2 -1 0 1 2 3 4 5 6 7 8 4 FR NL AT IT ES FI LU PT IE GR DE R2 = 0.53 (R2* =0.00) -2 -1 0 1 2 3 BE
Sources: Own computations based on European Commission data.
Note: R2* in the parenthesis is the R-squared computed excluding the outliers Greece and Ireland in panel (b). Wage growth is defi ned as growth in compensation per employee.
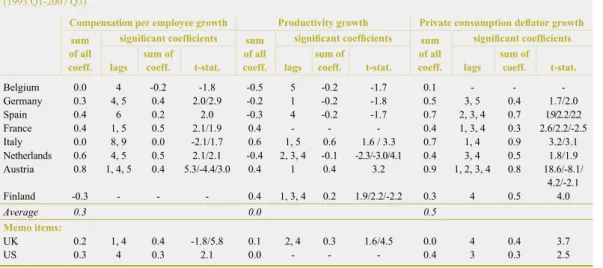
growth and infl ation we have estimated simple autoregressive equations using quarterly data,26
namely
where ∆x
t represents – in turn – wage growth,
productivity growth or infl ation (measured by the growth rate of the private consumption defl ator) at time t, c represents a constant, and εtis the error term. The sum of the coeffi cients αi of the lagged dependent variable constitutes a measure of persistence (stickiness) in a period of time which covers for most countries fi ve quarters (the maximum lag for which signifi cant coeffi cients were found). The results of this exercise are summarised in Table 6. When interpreting the results of this time series approach, it should be borne in mind that the impact of other exogenous variables on the measured persistence has not been captured in this exercise. Table 6 shows for each variable the sum of all coeffi cients αi (i.e. ∑
i=1 5
) of the autoregressive equation and also the sum of
the signifi cant coeffi cients. For Finland in the case of compensation per employee growth, for France in the case of productivity growth and for Belgium in the case of infl ation none of the coeffi cients was found to be signifi cant. Thus, for these countries, the uncertainty related to our measure of persistence is particularly high.
A fi rst result of this exercise is that the
so-measured persistence in compensation per employee growth over the period 1993-2007 has been relatively high in a number of euro area countries. The strongest autoregressive coeffi cients were found in the Netherlands and Austria (0.6/0.8), followed by Spain, France and Germany. However, no apparent wage growth persistence was found for Belgium, Italy and Finland. In comparison, a similar exercise for the United States and the United Kingdom reveals autoregressive coeffi cients similar to the average of the eight largest euro area countries. A similar exercise for productivity growth across euro area countries reveals a clearly lower degree of persistence across the euro area countries (see Table 6). The coeffi cient
α is positive and signifi cant only for Italy, Austria and Finland, while for the other
countries no signifi cant persistence can be
found. In this regard, the persistence of wage growth does not appear to be matched by a similar persistence of productivity growth.
However, the same exercise for infl ation,
as measured by the private consumption defl ator, reveals a high and signifi cant degree
of persistence across euro area countries.27
Moreover, it appears that the higher the wage growth persistence, the higher the respective persistence of infl ation. Thus, one may assert that wage growth persistence is related to
This approach follows the one chosen in the Infl ation Persistence 26
Network. See, for example, Gadzinski et al. (2004). To have a significant number of observations (59) quarterly data running from 1993:1 to 2007:3 were used. As quarterly data on compensation per employee (seasonally adjusted) are only available for the eight largest euro area countries: Belgium, Germany, Spain, France, Italy, the Netherlands, Austria, Finland, the persistence exercise has been carried out for this group of countries only.
See results from the Infl ation Persistence Network (Altissimo et 27
al. 2006). Chart 10 Differences in average wage
growth and average productivity growth relative to the US, 1994 - 2004 *
(percentage points)
0 2 4
-2 -4
y-axis: wage growth (deviation from US average)
2.0 1.5 0.5 -2.0 -1.5 -0.5 0.0 2.0 1.5 0.5 -2.0 -1.5 -0.5 0.0 x-axis: productivity (deviation from US average)
R2 = 0.41 (R2*= 0.25)
-1.0 -1.0
1.0 1.0
Sources: Own computations based on BLS data.
Notes: R2* is the R-squared computed excluding the outlier Alaska. Due to missing observations for the years 1997-01, the sample period is an average of the periods 1994-96 and 2002-04. Wage growth is defi ned as growth in compensation per employee.
αi
∆xt=c+∑ ∆xt -i+εt ’
i=1 5
5 F A C T O R S B E H I N D W A G E G R O W T H D I F F E R E N T I A L S A M O N G T H E E U R O A R E A C O U N T R I E S
infl ation persistence. The close link between
wage growth and infl ation persistence might
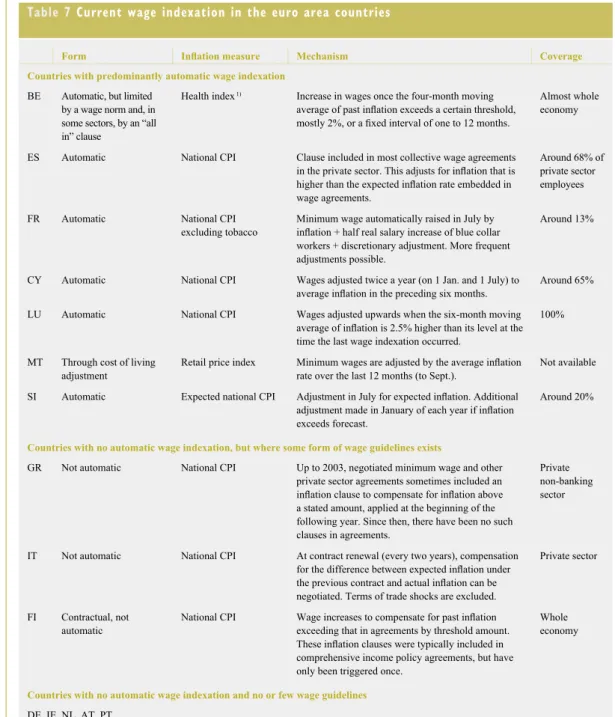
refl ect the importance of infl ation in the wage-setting mechanisms, as trade unions typically base their wage demands, among other factors, on past infl ation developments. Moreover, the close link between the persistence of wages and infl ation might be related to certain institutional factors, such as wage indexation. Incorporating the backward-looking infl ation component into the wage rule can lead to wage rigidities under certain institutional practices. Since wages are important determinants of prices, backward-looking wage indexation enables temporary price shocks to initiate wage-price spirals leading to both persistent wage and price developments. Among the euro area countries covered in this paper, an automatic wage indexation mechanism is relevant in Belgium, Spain, France and Luxembourg (Table 7). Other factors explaining persistence in wage developments within individual countries may be multi-year wage contracts and the fact that in some countries collective wage settlements are not totally independent, as wage agreements in major industrial sectors tend to provide a clear benchmark for wage bargaining in other sectors and even in some other euro area countries
(for instance in Belgium), irrespective of local labour productivity developments and labour market conditions or fi rm profi tability.28
In sum, certain longer-term factors appear to be behind wage growth differentials among the euro area countries. Differences in wage growth rates between individual euro area countries and the euro area appear to be positively related to the respective differences between their HICP infl ation and average HICP infl ation in the euro area. Conversely, relative wage growth differentials across euro area countries have largely been unrelated to and are generally higher than relative productivity growth differentials. Although for a number of countries the relative wage and productivity growth differentials appear to be small, countries that combine positive wage growth differentials and negative productivity growth differentials vis-à-vis the euro area average over an extended period – and hence positive unit labour cost differentials – run the risk of accumulating losses in competitiveness. It is therefore a challenge for those countries in which relative wage developments exceed relative productivity developments to ensure that
See Hancké et al. (2003), pp. 149-160. 28
Table 6 Persistence in nominal compensation per employee growth, in productivity growth and in private consumption deflator growth across the euro area countries
(1993 Q1-2007 Q3)
Compensation per employee growth Productivity growth Private consumption defl ator growth sum
of all coeff.
signifi cant coeffi cients sum of all coeff.
signifi cant coeffi cients sum of all coeff.
signifi cant coeffi cients lags
sum of
coeff. t-stat. lags sum of
coeff. t-stat. lags sum of coeff. t-stat. Belgium 0.0 4 -0.2 -1.8 -0.5 5 -0.2 -1.7 0.1 - - -Germany 0.3 4, 5 0.4 2.0/2.9 -0.2 1 -0.2 -1.8 0.5 3, 5 0.4 1.7/2.0 Spain 0.4 6 0.2 2.0 -0.3 4 -0.2 -1.7 0.7 2, 3, 4 0.7 1.9/2.2/2.2 France 0.4 1, 5 0.5 2.1/1.9 0.4 - - - 0.4 1, 3, 4 0.3 2.6/2.2/-2.5 Italy 0.0 8, 9 0.0 -2.1/1.7 0.6 1, 5 0.6 1.6 / 3.3 0.7 1, 4 0.9 3.2/3.1 Netherlands 0.6 4, 5 0.5 2.1/2.1 -0.4 2, 3, 4 -0.1 -2.3/-3.0/4.1 0.4 3, 4 0.5 1.8/1.9 Austria 0.8 1, 4, 5 0.4 5.3/-4.4/3.0 0.4 1 0.4 3.2 0.9 1, 2, 3, 4 0.8 18.6/-8.1/ 4.2/-2.1 Finland -0.3 - - - 0.4 1, 3, 4 0.2 1.9/2.2/-2.2 0.3 4 0.5 4.0 Average 0.3 0.0 0.5 Memo items: UK 0.2 1, 4 0.4 -1.8/5.8 0.1 2, 4 0.3 1.6/4.5 0.0 4 0.4 3.7 US 0.3 4 0.3 2.1 0.0 - - - 0.4 3 0.3 2.5
Source: Own computations based on Eurostat data.
Notes: Measured by auto-regressive estimates up to the fi fth lag, with the exception of Spain and Italy, where six and nine lags were used respectively in the autoregressive equation of compensation per employee growth.