Andrean, A, Jayabalan, M and Thiruchelvam, V
Keystroke dynamics based user authentication using deep multilayer
perceptron
http://researchonline.ljmu.ac.uk/id/eprint/12645/
Article
LJMU has developed LJMU Research Online for users to access the research output of the University more effectively. Copyright © and Moral Rights for the papers on this site are retained by the individual authors and/or other copyright owners. Users may download and/or print one copy of any article(s) in LJMU Research Online to facilitate their private study or for non-commercial research. You may not engage in further distribution of the material or use it for any profit-making activities or any commercial gain.
The version presented here may differ from the published version or from the version of the record. Please see the repository URL above for details on accessing the published version and note that access may require a subscription.
For more information please contact [email protected]
http://researchonline.ljmu.ac.uk/
Citation (please note it is advisable to refer to the publisher’s version if you
intend to cite from this work)
Andrean, A, Jayabalan, M and Thiruchelvam, V (2020) Keystroke dynamics
based user authentication using deep multilayer perceptron. International
Journal of Machine Learning and Computing, 10 (1). pp. 134-139. ISSN
2010-3700
Abstract—User authentication is an essential factor to protect digital service and prevent malicious users from gaining access to the system. As Single Factor Authentication (SFA) is less secure, organizations started to utilize Multi-Factor Authentication (MFA) to provide reliable protection by using two or more identification measures. Keystroke dynamics is a behavioral biometric, which analyses users typing rhythm to identify the legitimacy of the subject accessing the system. Keystroke dynamics that have a low implementation cost and does not require additional hardware in the authentication process since the collection of typing data is relatively simple as it does not require extra effort from the user. This study aims to propose deep learning model using Multilayer Perceptron (MLP) in keystroke dynamics for user authentication on CMU benchmark dataset. The user typing rhythm from 51 subjects collected based on the static password (.tie5Roanl) typed 400 times over 8 sessions and 50 repetitions per session. The MLP achieved optimum EER of 4.45% compared to original benchmark classifiers such as 9.6% (scaled Manhattan), 9.96% (Mahalanobis Nearest Neighbor), 10.22% (Outlier Count), 10.25% and 16.14% (Neural Network Auto-Assoc).
Index Terms—Authentication, behavioral biometrics, deep learning, keystroke dynamics, multilayer perceptron.
I. INTRODUCTION
With the advancement of information technology and the pervasive nature of digital services leads to the massive explosion of data. Privacy and security are the major challenges for the organization to maintain increasing security breaches. Authentication is one of the fundamental methods to ensure the confidentiality and availability of data to the legitimate user. Single Factor Authentication (SFA) are prone to vulnerabilities, due to the user using weak passwords and hackers can crack the passwords in sophisticated techniques such as brute force, dictionary attack, etc. [1].
On the other hand, the complexity of authentication can be increased using the combination of two or more independent factors (smartcard, security hardware token, biometrics, etc.) known as Multi-Factor Authentication (MFA). The biometric properties of a user for authentication are gaining immense
Manuscript received February 1, 2019; revised December 12, 2019. Alvin Andrean and Vinesh Thiruchelvam are with Asia Pacific University of Technology & Innovation, Technology Park Malaysia, Kuala Lumpur 57000, Malaysia (e-mail: [email protected], [email protected]).
Manoj Jayabalan is with Liverpool John Moores University, Liverpool L3 3AF, United Kingdom (e-mail: [email protected]).
interest from the recent software products or organizations, as it tackles the issue of transferability of credentials [2].
Biometric-based authentication is categorized into the physiological and behavioral property of the user. The physiological property covers the visible part of the human body such as the retina, fingerprint, etc. On the other hand, behavioral property analyzes the behavior of a user through user profiling, gait, mouse dynamics, keystroke dynamics, etc. These unique behavior properties can be used to enhance the user verification process and develop a multi-modal user authentication system. For instance, by implementing keystroke dynamics alongside with password-based authentication system, the impostor will not only need to obtain the knowledge of the password but also the knowledge of how the password is typed. Thus, better security is provided by using multi-modal user authentication.
Keystroke dynamics is a user authentication method, which validates the user’s typing rhythm to allow access to the system. It is an emerging field of interest for security especially in user authentication due to its various advantages. Firstly, keystroke dynamics have low implementation cost, and no additional hardware is required in the authentication process. Secondly, it has easier implementation compared to other biometric authentication methods because the collection of typing data is relatively easy, as it does not require special permission from the user.
Numerous studies in keystroke dynamics have been proposed utilizing the statistical models to build the classifier [3]–[7], machine learning approach [8]–[12] and hybrid models [3], [13]–[15]. However, the model accuracy to differentiate typing pattern between genuine user and complexity of accessing multitude data are the significant challenges in those models [16].
The purpose of this research is to develop a deep learning model on keystroke dynamics dataset. The model represents hierarchical learning of non-linear features with the purpose of extracting dependencies between them. As these features may be complicated and challenging to learn with usual machine learning methods, deep learning can help to learn high-level abstract ideas from low-level ones. Then, these abstractions can be separated to find features that can be used to improve classification performance.
II. METHODS
In this study, a classification model to differentiate genuine user and impostor will be proposed using deep learning approach. The model will be evaluated using existing keystroke dataset that is available for research. Thus, this study will only utilize secondary data and not primary
Keystroke Dynamics Based User Authentication using
Deep Multilayer Perceptron
data.
A. Dataset Selection
This study utilizes CMU benchmark dataset for keystroke dynamics [5]. The dataset consists of a subject identifier (ID) variable, session number, repetition number, and 31 keystroke timing features (H, DD, and UD) collected from 51
users. The users were asked to type a secure password (.tie5Roanl) for eight sessions with 50 typing repetitions for each session, which lead to a total of 34 variables and 20400 observations. These timing features are recorded in the measurement unit of second. The dataset description is given in Table I.
TABLE I. SUMMARY OF THEDATASET
No. Variables Details
1 Subject Subject ID or class label for 51 users involved in typing task.
2 sessionIndex A number of the session in the typing task; consists of 8 sessions in total.
3 Rep A number of repetition in the typing task; consists of 50 repetitions for each session. 4 H.period The duration between pressing and releasing ‘.’ key.
5 DD.period.t The duration between pressing ‘.’ key and pressing ‘t’ key. 6 UD.period.t The duration between releasing ‘.’ key and pressing ‘t’ key. 7 H.t The duration between pressing and releasing ‘t’ key. 8 DD.t.i The duration between pressing ‘t’ key and pressing ‘i’ key. 9 UD.t.i The duration between releasing ‘t’ key and pressing ‘i’ key. 10 H.i The duration between pressing and releasing ‘i’ key. 11 DD.i.e The duration between pressing ‘i’ key and pressing ‘e’ key. 12 UD.i.e The duration between releasing ‘i’ key and pressing ‘e’ key. 13 H.e The duration between pressing and releasing ‘e’ key. 14 DD.e.five The duration between pressing ‘e’ key and pressing ‘five’ key. 15 UD.e.five The duration between releasing ‘e’ key and pressing ‘five’ key. 16 H.five The duration between pressing and releasing ‘.’ key.
17 DD.five.shift.r The duration between pressing ‘five’ key and pressing ‘shift.r’ key. 18 UD.five.shift.r The duration between releasing ‘five’ key and pressing ‘shift.r’ key. 19 H.shift.r The duration between pressing and releasing ‘r’ key.
20 DD.shift.r.o The duration between pressing ‘shift.r’ key and pressing ‘o’ key. 21 UD.shift.r.o The duration between releasing ‘shift.r’ key and pressing ‘o’ key. 22 H.o The duration between pressing and releasing ‘o’ key.
23 DD.o.a The duration between pressing ‘o’ key and pressing ‘a’ key. 24 UD.o.a The duration between releasing ‘o’ key and pressing ‘a’ key. 25 H.a The duration between pressing and releasing ‘a’ key. 26 DD.a.n The duration between pressing ‘a’ key and pressing ‘n’ key. 27 UD.a.n The duration between releasing ‘a’ key and pressing ‘n’ key. 28 H.n The duration between pressing and releasing ‘n’ key. 29 DD.n.l The duration between pressing ‘n’ key and pressing ‘l’ key. 30 UD.n.l The duration between releasing ‘n’ key and pressing ‘l’ key. 31 H.l The duration between pressing and releasing ‘l’ key.
32 DD.l.return The duration between pressing ‘l’ key and pressing ‘return’ key. 33 UD.l.return The duration between releasing ‘l’ key and pressing ‘return’ key. 34 H.return The duration between pressing and releasing ‘return’ key.
B. Data Pre-processing
The CMU dataset does not have any missing value, but some outliers could be found for several timing features. These outliers might occur because each participant has a different style and efficiency of typing a keyboard. For instance, a participant who has a job or experience related to typing task should be able to type quicker than those who do not have one. Unfortunately, CMU does not provide information on the typing efficiency for the participants. The model development consists of 34 columns and 6000 rows. The selection process of the data is divided into three criteria: (i) five user data, which have the most outliers; (ii) five user data, which have the least outliers; and (iii) five user data,
which have the median amount of outliers.
C. Deep Learning
The primary purpose of deep learning is to automate the process of finding high-level representation from low-level features [17]. Deep learning offers several benefits such as allows selection and learning of all features in-depth k architecture and to perform multi-task learning in which multiple tasks in the learning process can re-use features and functions. This is possible due to its multi-level structure, and sparsity characteristic of the architecture which increases the representation efficiency by only utilizing up to 4% of the neurons [18]. Thus, deep learning can optimize the parameters used in a study to improve its representation. International Journal of Machine Learning and Computing, Vol. 10, No. 1, January 2020
feed-forward neural network refers to a network model in which each neuron in a layer is connected with neurons from another layer without cycling back to previous layer [19]. It consists of an input layer, one or more hidden layer, and an output layer. The input layer consists of the neuron that receives the input values (either numerical or binary) from training tuple. These inputs contain a weight assigned to each of them, which will be carried on to the next layer called a hidden layer. It receives the input values from the input layer, performs the mathematical calculation, and generates a temporary output for each training tuple that has entered the network. Next, these outputs are sent to an output layer where the predicted value for each training tuple will be assigned accordingly to the type of embedded activation function. [20] suggested the use of non-linear activation function in deep learning to handle the composition of a continuous linear transformation. By using matrix multiplication, the non-linear function can reproduce numbers of linear transformations in a single layer.
In this study, the multilayer perceptron model using deep learning is built with one input layer, two hidden layers, and an output layer. For the input layer, the number of neurons is set to thirty-one units as corresponding to the number of input features in the dataset. For hidden layers, the number of neurons is set to twenty-three units. This number is selected based on trial and error in finding the optimal accuracy for the classifier. However, [21] explained that the rule of thumb in deciding the number of units in a hidden layer is to choose a number of units in the input layer and the output layer. Thus, the median number between thirty-one and fifteen is selected. For the output layer, the amount of neuron is set to fifteen units because the classifier returns genuine user or impostor information for fifteen users.
D. Evaluation
Evaluation is the process of generating new knowledge through unique patterns identification. In this step, the output produced by the model is interpreted and transformed into knowledge. One possible way to interpret the result is by using statistical inference [5]. It enables the researcher to understand whether the output has a significant effect on the study or not.
III. RESULTS
The keystroke dynamics model implementation was carried out using the Waikato Environment for Knowledge Analysis (WEKA), which supports machine learning and deep learning model [22].
The dataset does not have any missing value, but some outliers could be found for several timing features. These outliers might occur because each participant has a different style and efficiency of typing a keyboard. For instance, a participant who has a job or experience related to typing task should be able to type quicker than those who do not have one. Unfortunately, there is no description provided on the typing efficiency for the participants.
Several interesting observations are highlighted in Table II. First of all, it can be seen that DD.five.shift.r and UD.a.n have the highest and the lowest mean among all features
difficulty in typing number and uppercase letter consecutively. The inference is also supported by the values of median and mode of DD.five.shift.r, which is the highest among all other features. Whereas for the feature with the lowest mean, it could be resulted by the position of the keyboard keys which made it easier to type key ‘a’ and key ‘n’ consecutively while typing with both hands. This is supported by the lowest mode belonged to the feature. Next, all the features have considerably low standard errors, which means the values tend to close to the mean of the dataset. Furthermore, it can be seen that some features have negative median and minimum values, which indicate overlapping in the typing task. Finally, the maximum values of DD.i.e and UD.i.e are significantly higher compared to other features. This might occur because of the user being idle (taking a break) during typing task.
The performance of a classifier needs to be evaluated to understand how well it performs in future unseen data. As a biometric user authentication technique, keystroke dynamics requires high accuracy in classifying genuine user and impostor. To evaluate the performance of deep learning model implemented in this study, different types of evaluation criteria such as accuracy, kappa statistic, RMSE, precision, recall, F-measure, MCC, ROC, PRC and confusion matrix. These evaluation metrics are also elaborated to get a better understanding of the performance of the classifier.
The results of the classification performed by Dl4jMlpClassifier are illustrated in the figures and tables below. Fig. 1 shows the summary output for the classifier.
Fig. 1. Summary output for Dl4jMlpClassifier.
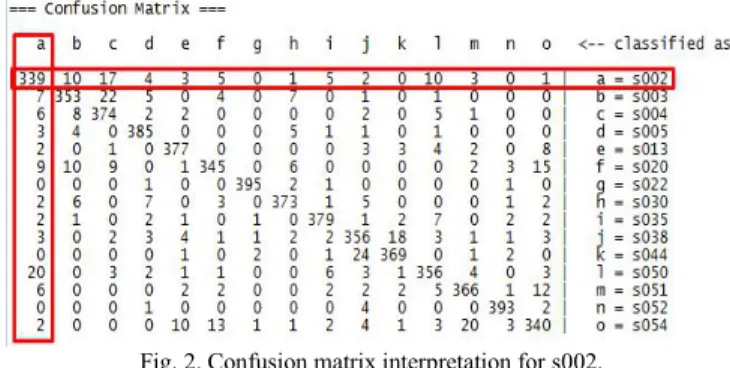
Fig. 2 shows the confusion matrix for each user, and Table II shows the detailed accuracy for each class.
Fig. 2. Confusion matrix interpretation for s002.
The overall accuracy of the classifier is 91.67% as a result of being able to identify 5500 out of 6000 instances. This means the classifier can correctly identify nine out of ten classification tasks (either identifying genuine user or impostor). The use of kappa statistics in calculating the agreement level between observers towards the case studies. The Kappa statistic of the classifier is 0.9107, which means it has an almost perfect and positive inter-observer agreement. This means the deep learning classifier is statistically significant to be used for keystroke dynamics studies. EER or
a measure of accuracy for classification will be discussed in Table III along with FAR and FRR.
The MAE value for the classifier is 0.0142. This indicates the classifier has approximately an average absolute error of 0.0142 in identifying genuine user and impostor for fifteen users. The RMSE value for the classifier is 0.0911. This indicates the classifier gives approximately a squared error of
0.0911 in identifying genuine user and impostor for fifteen users.
In solving the classification problem for keystroke dynamics, more straightforward representation of the users (subject IDs) is implemented. A user with subject ID ‘s002’ is represented as ‘a’, user with subject ID ‘s003’ is represented as ‘b’, and so on.
TABLE II: KEYSTROKETIMINGFEATURES
Features Mean Std. Error Median Mode Min Max
H.period 0.0934 0.0002 0.0895 0.0834 0.0014 0.3761 DD.period.t 0.2641 0.0015 0.2059 0.1184 0.0187 12.5061 UD.period.t 0.1707 0.0016 0.1087 0.0013 -0.2358 12.4517 H.t 0.0857 0.0002 0.0081 0.076 0.0093 0.2411 DD.t.i 0.1691 0.0009 0.1404 0.1175 0.0011 4.9197 UD.t.i 0.0834 0.0009 0.0578 0.0011 -0.1621 4.7999 H.i 0.0816 0.0002 0.0771 0.0681 0.0032 0.3312 DD.i.e 0.1594 0.0016 0.1209 0.0795 0.0014 25.9873 UD.i.e 0.0778 0.0016 0.0412 0.0014 -0.16 25.9158 H.e 0.0891 0.0002 0.0834 0.0723 0.0021 0.3254 DD.e.five 0.3774 0.0019 0.289 0.2027 0.0013 4.9618 UD.e.five 0.2283 0.0019 0.2004 0.129 -0.1505 4.8827 H.five 0.0769 0.0002 0.0742 0.0697 0.0014 0.1989 DD.five.shift.r 0.4389 0.0018 0.3775 0.3688 0.1694 8.3702 UD.five.shift.r 0.3620 0.0018 0.302 0.3197 0.0856 8.2908 H.shift.r 0.0959 0.0002 0.0935 0.0512 0.0014 0.2817 DD.shift.r.o 0.2509 0.0012 0.2014 0.146 0.0494 4.1523 UD.shift.r.o 0.1550 0.0013 0.1022 -0.0014 -0.0865 4.012 H.o 0.0884 0.0002 0.0863 0.0855 0.0069 0.6872 DD.o.a 0.1569 0.0007 0.1316 0.1096 0.0012 2.8567 UD.o.a 0.0686 0.0008 0.0444 -0.0013 -0.2287 2.8152 H.a 0.1063 0.0003 0.1019 0.09 0.004 2.0353 DD.a.n 0.1507 0.0008 0.125 0.099 0.0011 3.3278 UD.a.n 0.0444 0.0008 0.0227 0.0011 -0.2355 2.5242 H.n 0.0899 0.0002 0.0853 0.0813 0.0037 0.3577 DD.n.l 0.2026 0.0011 0.1725 0.1689 0.0013 4.0252 UD.n.l 0.1127 0.0011 0.0955 -0.0011 -0.1758 3.9782 H.l 0.0956 0.0002 0.0937 0.0942 0.0037 0.3407 DD.l.return 0.3218 0.0016 0.263 0.241 0.0083 5.8836 UD.l.return 0.2263 0.0016 0.1603 0.1128 -0.1245 5.8364 H.return 0.0883 0.0002 0.0855 0.0871 0.0029 0.2651
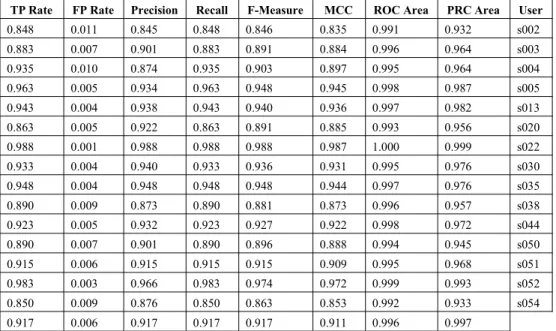
TABLE III: DETAILEDACCURACY BYCLASS
TP Rate FP Rate Precision Recall F-Measure MCC ROC Area PRC Area User
0.848 0.011 0.845 0.848 0.846 0.835 0.991 0.932 s002 0.883 0.007 0.901 0.883 0.891 0.884 0.996 0.964 s003 0.935 0.010 0.874 0.935 0.903 0.897 0.995 0.964 s004 0.963 0.005 0.934 0.963 0.948 0.945 0.998 0.987 s005 0.943 0.004 0.938 0.943 0.940 0.936 0.997 0.982 s013 0.863 0.005 0.922 0.863 0.891 0.885 0.993 0.956 s020 0.988 0.001 0.988 0.988 0.988 0.987 1.000 0.999 s022 0.933 0.004 0.940 0.933 0.936 0.931 0.995 0.976 s030 0.948 0.004 0.948 0.948 0.948 0.944 0.997 0.976 s035 0.890 0.009 0.873 0.890 0.881 0.873 0.996 0.957 s038 0.923 0.005 0.932 0.923 0.927 0.922 0.998 0.972 s044 0.890 0.007 0.901 0.890 0.896 0.888 0.994 0.945 s050 0.915 0.006 0.915 0.915 0.915 0.909 0.995 0.968 s051 0.983 0.003 0.966 0.983 0.974 0.972 0.999 0.993 s052 0.850 0.009 0.876 0.850 0.863 0.853 0.992 0.933 s054 0.917 0.006 0.917 0.917 0.917 0.911 0.996 0.997
Table II shows the individual accuracy for each class and
average accuracy by class for the classifier. From the result above, it can be inferred that the classifier achieves average0.083 FAR (1 – TPR) and average 0.006 FRR. This indicates International Journal of Machine Learning and Computing, Vol. 10, No. 1, January 2020
impostor as a genuine user and a 0.6% rate in false identification of the genuine user as an impostor. After obtaining the value of FAR and FRR, Equal Error Rate (EER) can be calculated by using the formula ((FAR+FRR)/2, which gives 0.0445 as a result. Thus, 0.0445 is the threshold value for FAR and FRR in the classifier. This value is similar to the result given by the classifier as illustrated in Fig. 1, which is 0.04.
Next, the classifier achieves an average precision, recall, and F-measure of 0.917. The precision indicates that the classifier can identify 91.7% of the impostor correctly and the recall indicates that the classifier can recognize 91.7% of all impostor cases in the dataset. The F-measure calculates the harmonic mean of precision and recall of the classifier, thus also achieves a 91.7% rate.
IV. CONCLUSION
Advances in keystroke dynamics have produced multiple classifiers such as statistical and machine learning to perform classification for genuine user and impostor. However, the maximum rate of accuracy has not been achieved. This study aims to propose a model in keystroke dynamics using deep learning method. This study is critical because it can potentially increase the user awareness and understanding regarding the biometrics authentication, and tackle security issues individually in access control and data privacy and can provide better authentication measure compared to SFA. The scope of this study is limited to the implementation of deep learning model with one dataset and does not cover external factors affecting keystroke dynamics performance.
The network model used in deep learning is multilayer perceptron with two hidden layers. Stochastic gradient descent algorithm used as the optimization technique as it can minimize the error and the cost of a function. An acceleration technique for gradient descent called momentum used to increase the learning speed of the network and the backpropagation algorithm to calculate the error of the function. The weight initialization (Xavier initialization) is utilized to assigns weight by considering the learning effect of the neurons to maintain an equal distribution of activations. Next, there are two activation functions used in the network: relu for hidden layers and softmax for the output layer. The model will use multi-class cross-entropy as its output function.
Three evaluation metrics such as FAR, FRR, and EER are selected and prioritized in this study to evaluate the performance of the deep learning classifier. Based on the training result, the classifier has achieved 0.083 FAR, 0.006 FRR, and 0.0445 EER in classifying genuine user and impostor based on fifteen users data. However, there are also other types of performance metrics that can also be used to evaluate the classifier such as accuracy, kappa statistic, MAE, RMSE, precision, recall, F-measure, MCC, ROC, PRC, and confusion matrix. The accuracy of the classifier shows that it can identify 91.67% of the instances correctly. The Kappa statistic of the classifier shows that it has an almost perfect and positive inter-observer agreement with a coefficient of 0.9107. The MAE and RMSE have indicated that the
actual value with an error of 0.0142 and 0.0911 respectively. The MCC statistic of the classifier shows that it has close to perfect prediction for genuine user and impostor with a coefficient of 0.911. The classifier also achieved 91.7% precision, recall, and F-measure in the classification task. The ROC area and PRC area of the classifier indicates that the classifier achieves almost excellent discrimination incorrect classification of genuine user and impostor with the value of 0.996 and 0.967 respectively. After conducting a comparison with related works on the same dataset, the deep learning classifier can achieve better performance compared to other classifiers in keystroke dynamics. At finally yet importantly, the classifier is also able to perform considerably well in another dataset.
Keystroke dynamics is an exciting field to explore as one type of biometric authentication measure although it has lower classification accuracy and a limited amount of studies compared to other biometric modalities. Although the field of study is still open to challenges and improvement, it has the potential to become an active, reliable and low-cost biometric user authentication.
The study on deep learning model development for keystroke dynamics has achieved a promising result. However, several limitations could not be addressed by the completion of the study. Firstly, the study only uses a single model (multilayer perceptron) for the deep learning implementation. Secondly, the study only uses a single dataset to perform model training. Although these limitations did not affect the achievement of the aim and objectives of the study, better performance could be achieved. Hence, future research can compare more complex deep learning models such as autoencoders, recurrent neural networks, and others for keystroke dynamics. Another future research in keystroke dynamics field is to build deep learning model for the mobile platform.
CONFLICT OFINTEREST
The authors declare no competing interests. AUTHORCONTRIBUTIONS
A.A. and M.J. designed, developed and implemented the methods, produced the results and wrote the manuscript; V.T. supervised the study and wrote the manuscript.
REFERENCES
[1] M. Raza, M. Iqbal, M. Sharif, and W. Haider, “A survey of password attacks and comparative analysis on methods for secure authentication,”World Appl. Sci. J., vol. 19, no. 4, pp. 439–444, 2012. [2] C. Vielhauer,Biometric User Authentication for IT Security, vol. 18,
New York: Springer-Verlag, 2006.
[3] J. V. Monaco and C. C. Tappert, “The partially observable hidden Markov model and its application to keystroke dynamics,” Pattern Recognition, 2018.
[4] S. Roy, U. Roy, and D. D. Sinha, “Security enhancement of knowledge-based user authentication through keystroke dynamics,” in
Proc. MATEC Web Conf., 2016, vol. 57.
[5] K. S. Killourhy. (2012). A scientific understanding of keystroke dynamics. [Online]. Available: http://reports-archive.adm.cs.cmu.edu/anon/2012/CMU-CS-12-100.pd f
[6] A. Messerman, T. Mustafić, S. A. Camtepe, and S. Albayrak, “Continuous and non-intrusive identity verification in real-time environments based on free-text keystroke dynamics,” inProc. Int. Jt. Conf. Biometrics, 2011.
[7] P. S. Teh, B. J. Andrew Teoh, T. S. Ong, and H. F. Neo, “Statistical fusion approach on keystroke dynamics,” inProc. Int. Conf. Signal Image Technol. Internet Based Syst., January 2007, pp. 918–923. [8] J. Ho and D. K. Kang, “Mini-batch bagging and attribute ranking for
accurate user authentication in keystroke dynamics,”Pattern Recognit., vol. 70, pp. 139–151, 2017.
[9] S. Maheshwary and V. Pudi, “Mining keystroke timing pattern for user authentication,”Lect. Notes Comput. Sci., vol. 10312, pp. 213–227, 2017.
[10] A. Darabseh and A. S. Namin, “On accuracy of classification-based keystroke dynamics for continuous user authentication,” inProc. 2015 Int. Conf. Cyberworlds, 2016, pp. 321–324.
[11] P. H. Pisani, A. C. Lorena, and A. C. P. L. F. de Carvalho, “Adaptive Positive Selection for Keystroke Dynamics,” J. Intell. Robot. Syst. Theory Appl., vol. 80, pp. 277–293, 2015.
[12] R. Giot, M. El-Abed, and C. Rosenberger, “Keystroke dynamics with low constraints SVM based passphrase enrollment,” inProc. IEEE 3rd Int. Conf. Biometrics Theory, Appl. Syst., 2009.
[13] H. Mohabeer and S. K. M. Soyjaudah, “Application of predictive coding in neuroevolution,”Int. J. Comput. Appl., vol. 114, no. 2, pp. 41–47, 2015.
[14] J. Nisha and R. P. Kumar, “User authentication based on keystroke dynamics analysis,”Int. J. Eng. Res. Appl., vol. 4, no. 3, pp. 345–349, 2014.
[15] H. B. K. Bharadi, P. S. Shah, and A. Ambardekar, “Keystroke dynamic analysis using relative entropy & timing sequence euclidian distance,” inProc. Int. Conf. Work. Emerg. Trends Technol., 2011, p. 220. [16] M. L. Ali, J. V. Monaco, C. C. Tappert, and M. Qiu, “Keystroke
biometric systems for user authentication,”J. Signal Process. Syst., vol. 86, no. 2–3, pp. 175–190, 2017.
[17] Y. Bengio, “Learning deep architectures for AI,” Found. Trends® Mach. Learn., vol. 2, no. 1, pp. 1–127, 2009.
[18] L. Deng and D. Yu, “Deep learning: Methods and applications,” Found.
Trends® Signal Process, vol. 7, no. 3–4, pp. 197–387, 2014. [19] S. Kumar, Neural Networks: A Classroom Approach, 3rd ed. New
Delhi: McGraw-Hill, 2004.
[20] C. M. Bishop,Pattern Recognition and Machine Learning, Singapore: Springer, 2006.
[21] A. Blum,Neural Networks in C++: An Object-Oriented Framework for Building Connectionist System, New York: John Wiley & Sons, 1992.
[22] E. Frank, M. A. Hall, and I. H. Witten,The WEKA Workbench, Morgan Kaufmann, 4th ed., 2016, pp. 553–571.
Copyright © 2020 by the authors. This is an open access article distributed under the Creative Commons Attribution License which permits unrestricted use, distribution, and reproduction in any medium, provided the original work is properly cited (CC BY 4.0).
Alvin Andreanis a postgraduate student. He pursued the Data science and business analytics course at Asia Pacific University of Technology and Innovation. His research interest includes data mining, machine learning and computer security.
Manoj Jayabalanis a post doctorate fellow in the Faculty of Engineering & Technology, Liverpool John Moores University, UK. Manoj obtained his master of science in software engineering from Staffordshire University, the UK with research area focusing on the database. He also holds a bachelor of engineering in computer science from Anna University, India.
He engaged in research activities focusing in the area of big data, data mining, machine learning, health informatics, and software engineering. His area of expertise in the data analytics in performing data wrangling, and implementing models. He has supervised many industrial projects, master dissertations and mentored students for National level competitions. He has been invited guest speakers for several talks on big data and conducted many workshops.
Vinesh Thiruchelvamearned his B.S in electrical engineering from the University of Western Michigan, USA. He completed his PhD at University Tun Abdul Razak, Malaysia. He attained his PEng from the Board of Engineers Malaysia (BEM) in 2012, his CEng from Engineering Council, UK in 2011 and is a fellow of the Institute of Mechanical Engineers (IMechE-UK). He is currently the dean of the Faculty of Computing, Engineering & Technology at Asia Pacific University (APU).
He has been involved in key education and engineering sectors such as being the chairman of the Engineering Education Technical Division (E2TD) at the Institute of Engineers Malaysia, advisory to IEMASB; a member of the Ministry of Human Resources’ BPIC on quality of graduates at the Ministry of Human Resources; a national professor council and chair of the Centre of Analytics (APCA). His core scholarly research areas are in sustainable development, reliability engineering using smart devices with IoT and data analytics with business intelligence.