REVIEW PAPER
S. Manoharan,1G. Chai,2S. Chowdhury,2and A. Golding3
A Study of the Structural Performance of Flexible
Pavements Using Traffic Speed Deflectometer
ReferenceManoharan, S., Chai, G., Chowdhury, S., and Golding, A.,“A Study of the Structural Performance of Flexible Pavements Using Traffic Speed Deflectometer,”Journal of Testing and Evaluation, Vol. 46, No. 3, 2018, pp. 1280–1289,https://doi.org/10.1520/JTE20160189. ISSN 0090-3973
ABSTRACT
The falling weight deflectometer (FWD) is a non-destructive testing device that has been used by many road agencies worldwide since 1980 for structural evaluation of flexible pavements. In early 2000, the world first Doppler laser-based traffic speed deflectometer (TSD) was developed by Greenwood Engineering, and now eight TSD vehicles are in use worldwide. The two main advantages of the TSD technology are: (a) the ability to carry out continuous bearing capacity measurements instead of discrete points, (b) that testing can be carried out at traffic speeds without the need for lane closures with a stationary device such as FWD. The objective of this paper was to study the structural performance of flexible pavements using TSD deflection data. The study successfully established a correlation between maximum deflections TSD-D0
and FWD-D0that are derived from the two devices. This study also drew some interesting
conclusions in that deflection data collected by TSD could be transformed to FWD equivalent structural numbers with simple models as derived in the study. The outcome of this study was an established methodology for reporting structural performance at network level utilizing TSD deflection data.
Keywords
falling weight deflectometer (FWD), traffic speed deflectometer (TSD), adjusted structural number (SNP), maximum deflection (D0), California bearing ratio (CBR)
Introduction
Queensland (QLD) is Australia’s second largest state, covering approximately 1.8×10⁶square kilometers.
QLD has approximately 174,000 km of road network managed by state and local governments [1]. The Department of Transport and Main Roads (TMR) is responsible for the maintenance of approximately 34,500 km of these roads, which includes approximately 29,500 km of sealed pavement [2]. This is the largest state controlled road network in Australia and has an estimated replacement value of AUD $51.04×10⁹as at 30 of June 2015 [3]. This infrastructure provides critical transportation links through-out the state, which results in it carrying approximately 80 % of the total road traffic in Queensland [4]. Manuscript received April 4, 2016;
accepted for publication January 13, 2017; published online December 1, 2017.
1
Portfolio Investment and Programming Branch, Queensland Dept. of Transport and Main Rd., Brisbane, QLD 4001, Australia, (Corresponding author), e-mail:sittampalam.p. [email protected]
2
School of Engineering, Griffith Univ., QLD 4222, Australia
3Portfolio Investment and
Programming Branch, Queensland Dept. of Transport and Main Rd., Brisbane, QLD 4001, Australia
Copyright © 2017 by ASTM International, 100 Barr Harbor Drive, PO Box C700, West Conshohocken, PA 19428-2959 1280 doi:10.1520/JTE20160189 / Vol. 46 / No. 3 / May 2018 / available online atwww.astm.org
prompt manner can result in the need for large scale rehabilita-tion, increasing the whole of life cost of the road network. The ability to predict future pavement performance is highly advanta-geous for road asset managers as a means of efficiently directing the limited resources they command.
Pavement performance is based on the combination of functional and structural performance. Functional perfor-mance has been the subject of widespread local and international research that has resulted in a number of sophis-ticated deteriorations models for use in pavement management systems.
Structural deterioration modelling is the second major component in the prediction of structural performance road pavement. It is essential that the pavement performance be evalu-ated correctly by an appropriate methodology, utilizing functional and structural deterioration models.
Falling weight deflectometer (FWD) has been used by many road agencies globally since 1980 for evaluating pavement struc-tural bearing capacity and is widely recognized as one of the most suitable non-destructive testing devices that accurately predicts bearing capacity. The FWD equipment used in QLD is depicted inFig.1. Over the last 30 years, extensive research has been under-taken into FWD usage in overlay design and determining remain-ing structural life.
The traffic speed deflectometer (TSD) is a new state of the art technology vehicle developed by Greenwood Engineering in the early 2000s using Doppler laser-based laser technology. The cross-sectional view of the TSD vehicle is shown in Fig.2[5]. This technology is capable of continuously measuring bearing capacity of a pavement whilst moving at traffic speeds. The de-vice’s high accuracy and continuous deflection profiles are useful for network level applications, such as predicting road rehabili-tation needs and remaining pavement life [6]. There are pres-ently eight TSD vehicles in use around the world including USA, China, UK, South Africa, Poland, Italy, Denmark and a shared vehicle New Zealand & Australia. The TSD measures ver-tical deflection velocity using a Doppler laser, and the slope is calculated by dividing vertical velocity by vehicle driving veloc-ity. Therefore, the accuracy of the deflection bowl is dependent on the manner in which the Doppler laser is mounted on the vehicle. The TSD vehicle sourced from Denmark was custom-ized for Australian roads to collect deflection data in the Outer Wheel Path (OWP). The device consists of seven Doppler lasers, which measure locations in 100, 200, 300, 450, 600, and 900 mm from the center of the wheel load. A sev-enth Doppler laser is positioned 3,500 mm from the center of the wheel load known as a reference laser [7].
TSD DATA INTERPRETATION
This paper considered four alternative methods of interpreting TSD data, which are examined in depth below.
Method 1: Rasmussen
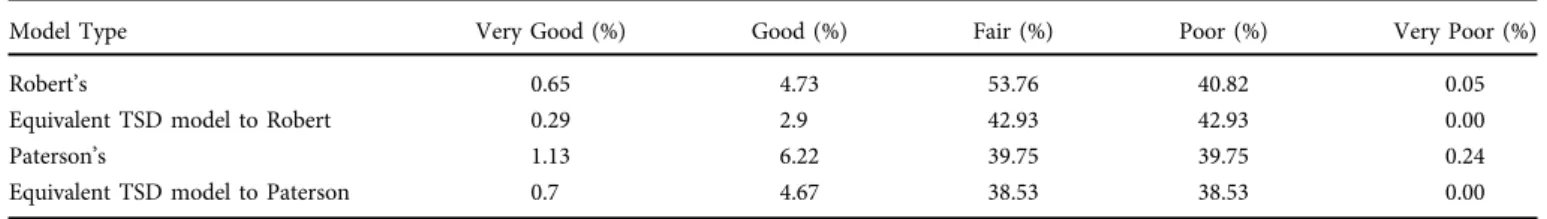
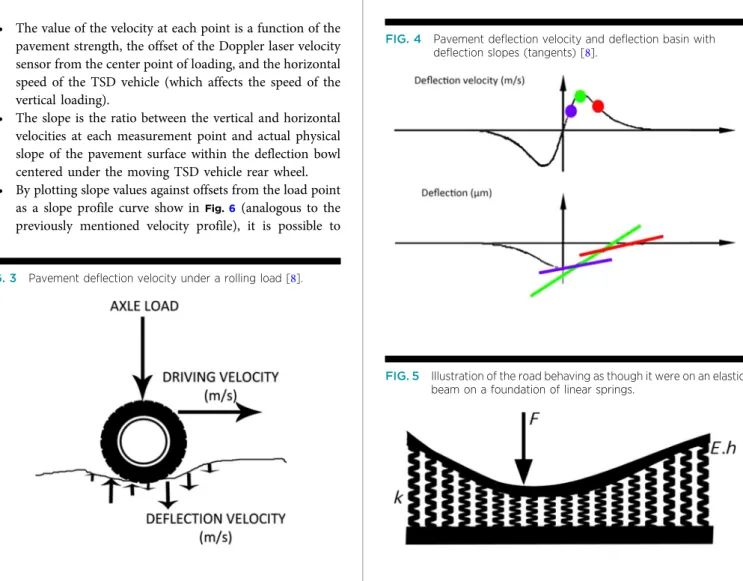
This TSD is an innovative Doppler laser based measuring system that can record 10 ton axle load deflection at 80 km/h. During operations, Doppler sensors measure vertical deflection velocities of the pavement surface at discrete points. When divided by the instantaneous vehicle speed, they produce deflection slopes at those points [8]. Fig.3 shows the pavement deflection velocity vectors under a rolling wheel. The corresponding deflection basin is shown inFig.4where deflection slopes (tangents) are displayed. In order to determine the actual pavement deflections, deflec-tion slope curve must be integrated using a closed–form solution of a mechanical model such as an elastic beam on Winkler foun-dation [8] as shown inFig.5. This is expressed in the 2–parameter Euler-Bernoulli beam as shown in equation (Eq1):
EI* d4 dx4 wðxÞ þkwðxÞ=−FδðxÞ (1) where: F= point force, E=elasticity, I=moment of inertia,
h= pavement thickness, and
k =spring constant.
Method 2: Area Under the Curve (AUTC)
Another approach for analyzing TSD data to produce TSD deflec-tion bowl is known as the area under the curve (AUTC) method [9]. This method was developed following the initial TSD trials in Australia in 2010. The AUTC method uses a numerical integra-tion approach in accordance with the following procedures:
The base TSD data consists of a set of vertical pavement velocities, referenced against horizontal offset spaced along the axis of the wheel path and away from the loading of the dual tyred truck wheels. This data is termed the velocity profile.
• The value of the velocity at each point is a function of the pavement strength, the offset of the Doppler laser velocity sensor from the center point of loading, and the horizontal speed of the TSD vehicle (which affects the speed of the vertical loading).
• The slope is the ratio between the vertical and horizontal velocities at each measurement point and actual physical slope of the pavement surface within the deflection bowl centered under the moving TSD vehicle rear wheel.
• By plotting slope values against offsets from the load point as a slope profile curve show in Fig.6(analogous to the previously mentioned velocity profile), it is possible to
FIG. 3 Pavement deflection velocity under a rolling load [8].
FIG. 5 Illustration of the road behaving as though it were on an elastic beam on a foundation of linear springs.
FIG. 2
Traffic speed deflectometer (TSD) [5].
FIG. 4 Pavement deflection velocity and deflection basin with deflection slopes (tangents) [8].
ing from the tail is exactly equal to the vertical deflection at that point.
• The vertical difference between any two deflection points, such as for the bowl curvature, (D0–D200), is equal to the
area under the slope profile curve between these two points. Full text of the AUTC procedure can be found in Austroads Publication No. AP-T279-14 entitled“Traffic Speed Deflectometer: Data Review and Lesson Learnt”[10].
Method 3: Graczyk
Graczyk et al. [11] proposed a unique analytical solution for pave-ment deflections in one-layer pavepave-ment system. The pavepave-ment is modeled as the Euler-Bernoulli beam, which is supported by the viscoelastic foundation, whereas the loading is assumed as a set of concentrated forces moving with a constant speed [11].
Method 4: Zofka
Zofka et al. [12] developed an algorithm for interpreting TSD re-sults using an Eulerian-type approach as opposed to the Lagrangian-type approach. The algorithm has two distinct fea-tures: firstly, a focus on discrete points along the TSD route, which determines the deflection history at each point I as a func-tion of time. Lastly, employing a specific funcfunc-tion for the slope versus sensor locations vector at each TSD measurement point [12]. This algorithm proposed enables users to extensively cus-tomize TSD data based on their requirements. In addition, the deflection histories of the discrete points (Eulerian) can be used for the design of pavement rehabilitation, using clustering proce-dures to determine pavement sections that have a similar
benefits as it is anticipated in the near future when the more so-phisticated data is available its accuracy will increase.
TRIAL TSD TESTING PROGRAM
The Queensland Department of Transport and Main Roads (TMR) currently uses FWD deflection data predominantly for road reha-bilitation projects using the TMR pavement rehareha-bilitation method-ology. The D0 values of the deflection bowls are used for
identification of structural weakness along road sections. Due to the time and cost associated with the collection of the deflection using FWD, the utilization of the deflection data for structural evalu-ation in pavement management has been limited. To overcome this, TMR undertook trials utilizing the TSD device to perform wide ranging continuous deflection measurements at traffic speed.
In 2010, a TSD trial was undertaken by TMR and Roads and Traffic Authority of New South Wales (RTA) for the first time in Australia. The trial consisted of 6,000 km of state-controlled road network in QLD (Fig.7) [13] and significant lengths of road in New South Wales. The TSD trial was conducted to achieve the following objectives:
• Discovery of any correlation between TSD data and that ob-tained from other deflection measuring devices such as FWD.
• Identification of any factors that affect repeatability and reliability of correlations.
• Identification of factors that may impact TSD performance under local conditions.
• Assessment of the suitability of TSD as a network screening tool.
Methodology
A total of six flexible pavement trial sites were selected for this analy-sis and the trial sections varied from 500 to 1,000 m in length. The FWD and TSD tests were conducted concurrently to investigate if any correlation between the two devices and FWD tests were carried out mostly at 5 and 10 m intervals as stipulated inTable1. The FWD and TSD measurements were taken from the inner wheel path of the road due to the TSD device as it originated from Denmark (Left-Hand drive). The deflection data collected by both devices was verified and eliminated all anomalies deflection data points. Temperature corrections were then adopted in accordance with methodology provided in Pavement Rehabilitation Manual [14]. The manual stipulates that for flexible pavements with less than 50 mm thick asphalt surfaced, no temperature correction is neces-sary. However, if the thickness is 50 mm or more temperature cor-rection is required. The manual states the following three steps be carried out for temperature correction.
1. Determine the ratio of weighted mean annual pavement temperature for the site to the measured temperature at the time of testing.
FIG. 6 Relationship between pavement deflection (dx) at any wheel offset (x) and the cumulative area of the plot of slope (Vv/Vh),
2. Determine the appropriate correction factors for deflection and curvature function.
3. Multiply the deflections and curvatures by the correspond-ing correction factors.
The deflection data was derived for TSD testing by using Rasmussen models as per method 1 provided in the data inter-pretation section. The FWD deflection data was collected using 40 kN standard load, and approximately 400 test locations
consisted of both TSD and FWD deflection data, which were se-lected for this analysis.
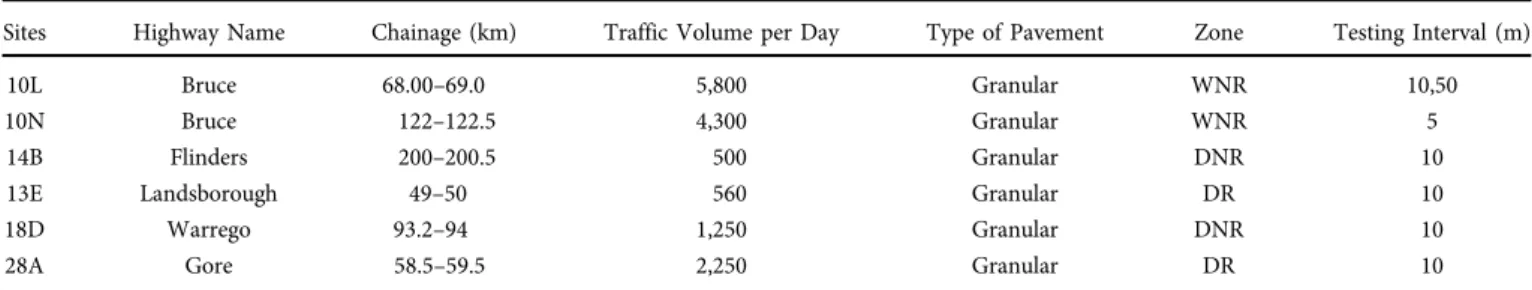
Table1displays trial sites, which were selected to appropri-ately capture various traffic volumes and different road classifi-cations. TMR controlled roads have been classified according to subgrade material type and typically experienced rainfall levels. These classifications include wet non-reactive (WNR), wet reac-tive (WR), dry non-reacreac-tive (DNR), and dry reacreac-tive (DR). This analysis only considered flexible granular pavement with spray FIG. 7
TSD trial network and six TSD & FWD test sites [13].
TABLE 1 FWD testing sites with location details.
Sites Highway Name Chainage (km) Traffic Volume per Day Type of Pavement Zone Testing Interval (m)
10L Bruce 68.00–69.0 5,800 Granular WNR 10,50
10N Bruce 122–122.5 4,300 Granular WNR 5
14B Flinders 200–200.5 500 Granular DNR 10
13E Landsborough 49–50 560 Granular DR 10
18D Warrego 93.2–94 1,250 Granular DNR 10
seal surfacing as this type of pavement makes up more than 85 % of the total QLD road network [15]. The typical structure of a granular pavement consist of approximately 250–300 mm thickness Type 1 or 2 base material specified in TMR Tech-nical Specifications [16]. This granular material’s unsoaked California bearing ratio (CBR) has a range from 45 to 80 and a fines ratio between 0.35 and 0.65 [16].
The FWD and TSD data for the 400 test locations were an-alyzed using the MATLAB program to investigate the relationship between the max deflection of TSD and FWD. The deflections were plotted inFig.8, which illustrates a linear relationship be-tween theD0deflection measurement from FWD and TSD
de-vices. This outcome demonstrates a highly beneficial method of converting TSD data to the FWD equivalent and using the existing FWD base technology for practical applications until de-velopment of TSD base technology.
To develop simple models for transforming TSD data to FWD equivalent adjusted structural number (SNP), Robert’s [17] and Paterson’s [18] FWD-based adjusted structural number equations were used in this study. Firstly, the FWD data was then converted to SNP using Robert’s [17] equation (Eq2) as shown below:
SNP=167∗D−0.57
0 (2)
where:
SNP=adjusted structural number, and
D0=maximum deflection in microns measured by FWD.
Conversely, the adjusted structural number (SNP) proposed by Paterson [18] was used to convert the FWD data to SNP. The equation (pavement base is not cemented) is expressed (Eq3) as:
SNP=3.2∗D−0.63
0 (3)
where:
SNP=adjusted structural number, and
D0=maximum deflection in millimeter measured by FWD.
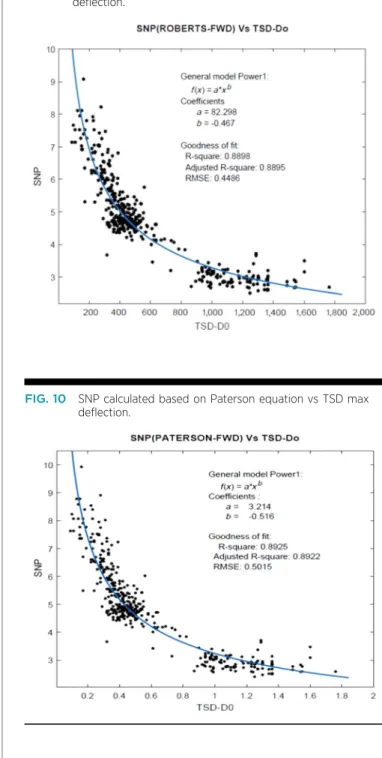
The TSD maximum deflection (TSD-D0) and SNP (Robert)
correlation was established using the MATLAB’s curve fitting tool. Subsequently, the SNP (Paterson) versus TSD-D0model was
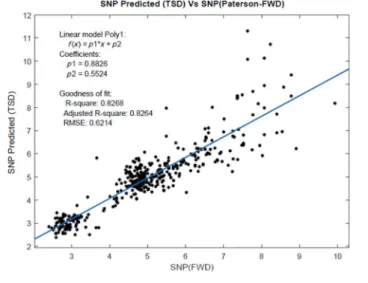
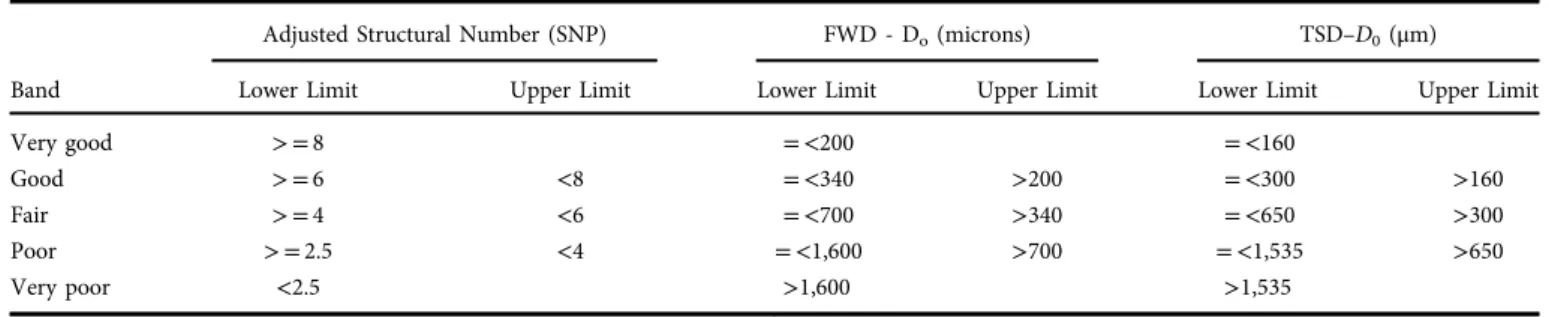
de-veloped with the results presented inFigs.9and10, respectively. The newly developed models for predicting SNP values from TSD max deflections were compared against the SNP values cal-culated from FWD max deflection. These variations are displayed inFig.11and12, respectively.
FIG. 8 Equality plot of TSD max deflection vs FWD max deflection. FIG. 9 SNP calculated based on Robert equation vs TSD max deflection.
FIG. 10 SNP calculated based on Paterson equation vs TSD max deflection.
DISCUSSION OF RESULTS
The aim of this study was to investigate the relationship between TSD Doppler lasers and FWD deflection devices. The establish-ment of a relationship between both devices is paramount for road asset managers and design engineers. Additionally, in the last 30 years, FWD has been extensively used by many road agen-cies as all technical information is referenced to FWD. Subsequently, it will require several years to accurately convert TSD deflection to the equivalent FWD, this is critical to business needs until the development of a methodology to use TSD data directly occurs. Direct comparison of TSD versus FWD is de-picted inFig.8, which illustrates that FWD max deflections less than 1 mm have a higher correlation in comparison to those with a deflection greater than 1 mm.
The regression analysis identifies that TSD-D0and FWD-D0
have a linear relationship as presented (Eq4) below:
D0ðTSDÞ=0.9845∗D0ðFWDÞ−40.13 (4)
where:
D0ðTSDÞ= maximum deflection measured by TSD inμm, and D0ðFWDÞ =maximum deflection measured by FWD inμm. The correlation is strong with anR2value equal to 0.8826 and RMSE is equal to 126.2.
This relationship was developed using the data from Queensland specifically, consequently calibration factors k1 and
k2were introduced to Eq4to enable global usage (Eq5).
D0ðTSDÞ=k1*0.9845*D0ðFWDÞ−k2*40.13 (5)
where:
D0ðTSDÞ= maximum deflection measured by TSD inμm, D0ðFWDÞ =maximum deflection measured by FWD inμm,
k1=calibration factor, and
k2=calibration factor.
This relationship will be referred to in the rest of the paper as
“TSD-FWD Converter.”
The SNP calculated using Robert’s equation versus TSD maximum deflection shown inFig.9 has established that SNP has a power relationship to TSD max deflection similar to that of Robert’s equation.
This analysis revealed that estimation of SNP from TSD maximum deflection can be defined as below (Eq6):
SNP=82.3∗D−0.47
0ðTSDÞðR2=0.8797 and RMSE=0.4486Þ (6)
where:
SNP=adjusted structural number, and
D0=maximum deflection measured by TSD inμm.
Similarly, the Paterson equation was also used to develop a relationship with TSD deflection as this model is used commonly worldwide to determine SNP from deflection. The SNP and TSD relationship can be defined as follows (Eq7):
SNP=3.2∗D−0.52
0ðTSDÞðR2=0.8797 and RSME=0.5015Þ (7)
where:
SNP=adjusted structural number, and
D0=maximum deflection measured by TSD in mm.
Fig.10shows Paterson SNP versus TSD maximum deflection. Using Eqs6and7, the calculated adjusted structural number was compared with that computed using Robert and Paterson’s equations, respectively. The comparisons are shown inFigs.11and 12. The predicted SNP from FWD by Robert and Paterson tionships versus predicted SNP using the newly developed rela-tionships exhibiting a strong correlation and the R2 values are FIG. 11 SNP predicted using TSD vs SNP based on Roberts equation.
greater than 0.80 and RMSE values are less than 0.625 for both predictions.
PAVEMENT STRUCTURAL CAPACITY CLARIFICATION AT NETWORK LEVEL
For Asset managers and maintenance engineers, viewing of struc-tural raw data presents an initial indicator of strucstruc-tural capacity of pavements. The proposed adjusted structural number bands shown inTable2provide guidance for flexible pavements with spray sealed or thin asphalt surface, comprising 85 % of sealed road network in QLD [15] and is the predominant pavement type in other countries. These bands were derived from the authors’experience and using tolerable deflection criteria for unbound pavement [19]. Furthermore, this table also includes FWD–D0and TSD–D0values
in each band. These values are derived using Eqs3and4. In addi-tion, providing different attributes to each band will enable asset managers to use attribute values they are familiar with.
Subsequently, similar proposed bands are to be developed for other pavement types. This is vital as road network are comprised of different pavement types as it is not homogeneous. Two case studies were undertaken to classify the structural capacity based on TSD data collected in 2014 to ensure the accurateness of the models de-veloped in this study. The TSD data used in this analysis is at 1 km intervals and tested approximately 6,500 km of the network.
CASE STUDY 1: SENSITIVITY ANALYSIS OF NEWLY DEVELOPED RELATIONSHIPS WITH AUTC METHOD DERIVED FWD DEFLECTION DATA
This case study intends to explore the effectiveness of the models developed in this study to use at the network level using Hawkeye processing method [7] derived FWD deflection, as this method of conversion is used widely in Australia. Two separate analyses were carried out for this purpose. The first analysis was to inves-tigate the correlation of Robert and the newly developed equiv-alent TSD model to Robert. For this comparison, the predicted adjusted structural number (SNP) from both methods are calcu-lated and then Robert’s predicted SNPs were sorted in ascending order. Similarly, Paterson’s and the newly developed equivalent TSD model to Paterson analysis was carried out, and the corre-lation of four models are shown inFig.13. The results highlight that, overall, the four models are accurately predicting SNP; how-ever, a noticeably minor deviation is evident for higher SNP.
The second analysis proposed adjusted number bands, given inTable2, and is used to categorize the structural capacity of the network. This utilized the predicted SNP by all four models and categorized into the bands. The network level structural capacity classification is shown in Fig.14. A 2014 TSD test on approxi-mately 6,500 km road network revealed an accuracy of 4 % could be achieved across the four models. The accuracy was observed in
FIG. 13 SNP predicted by four models (AUTC method derived FWD
deflection data). FIG. 14
Pavement structural capacity classification at network level (AUTC method).
TABLE 2
Band
Adjusted Structural Number (SNP) FWD - Do(microns) TSD–D0(μm)
Lower Limit Upper Limit Lower Limit Upper Limit Lower Limit Upper Limit
Very good > =8 = <200 = <160
Good > =6 <8 = <340 >200 = <300 >160
Fair > =4 <6 = <700 >340 = <650 >300
Poor > =2.5 <4 = <1,600 >700 = <1,535 >650
the results of the analysis. However, when examining each pair of models separately, Robert’s and the equivalent TSD equation to Robert exhibits a strong correlation of 2 %, as deduced from the analysis. Case Study 1 results are tabulated inTable3.
CASE STUDY 2: SENSITIVITY ANALYSIS OF NEWLY DEVELOPED STRUCTURAL NUMBER MODELS WITH NEWLY DEVELOPED LINEAR RELATIONSHIP TSD TO FWD CONVERSION MODEL (“TSD-FWD CONVERTER”) This study is similar to case study 1; however, instead of the AUTC method, the “TSD-FWD Converter” method, which was developed in this study, was used. Therefore, this analysis comprehensively tests all five models developed in this study and how these can be utilized at network level. The pre-dicted SNP relationship displays a strong correlation; however at higher SNP values, there is a minor deviation. This can be attributed to the TSD to FWD conversion model development. TheFig.15shows the correlation of predicted SNP.
Similar to case study 1, the second analysis was undertaken to classify network using the four models. Notably, the findings highlight that Paterson’s and the newly developed model depict a strong correlation when using the “TSD-FWD Converter” model developed in this study as shown in the Fig. 16. Additionally, Robert’s model identifies a correlation when using AUTC based deflection data as per case study 1. The Case Study 2 results are tabulated inTable4.
Conclusions
A tangible benefit can be achieved if asset managers use available deflection data appropriately in investment decisions. Structural data collection at the network level is generally considered cost prohibitive; however, when such data is used in a network needs analysis, the benefit can be much higher than the data collection cost. Hence, simple models are very useful for asset managers as it enables them to use available TSD data for their decision making process at network level for improving the timely identification of road sections requiring rehabilitation. This study draws some in-teresting findings in that deflection data collected by TSD can be FIG. 15 SNP predicted by four models (TSD-FWD converter method
derived FWD deflection data).
TABLE 3 Structural capacity classifications based on AUTC method derived FWD deflection.
Model Type Very Good (%) Good (%) Fair (%) Poor (%) Very Poor (%)
Robert’s 0.65 4.73 53.76 40.82 0.05
Equivalent TSD model to Robert 0.29 2.9 42.93 42.93 0.00
Paterson’s 1.13 6.22 39.75 39.75 0.24
Equivalent TSD model to Paterson 0.7 4.67 38.53 38.53 0.00
FIG. 16 Pavement structural capacity classification at network level (TSD-FWD converter method).
TABLE 4 Structural capacity classifications based onTSD-FWD Converter method derived onTSD-FWD deflection.
Model Type Very Good (%) Good (%) Fair (%) Poor (%) Very Poor (%) Robert’s 0.61 4.62 55.44 39.25 0.08 Equivalent TSD model to Robert 0.29 2.9 53.88 42.93 0.00 Paterson’s 1.00 6.10 54.29 38.35 0.20 Equivalent TSD model to Paterson 0.7 4.67 56.10 38.53 0.00
mathematical model as derived from this study. Therefore, these relationships can be used in the interim basis for use of TSD data until comprehensive studies have been conducted by various re-search organizations. This study focused exclusively on the rela-tionship between the maximum deflections (D0) of both devices.
Therefore, further research is to be undertaken for the correlation betweenD200,D300,D450, andD900for TSD and FWD. The
rela-tionships were developed only for flexible pavement types (high deflections). Therefore, future research should be undertaken when TSD data for stiffer pavements is available to verify the de-veloped relationship.
The newly developed mathematical models were developed us-ing approximately 400 locations, which were tested in 2010. Two case studies were carried out to evaluate the accuracy of developed models in predicting adjusted structural number at network level utilizing approximately 6,500 km TSD data collected in 2014. These studies provide an insight into the simple models that can be used to predict structural number at network level similar to that of FWD based models without losing structural integrity. Hence, the finding of this study concludes that TSD deflection data can be used directly to categorize pavement structural capacities in the network.
ACKNOWLEDGMENTS
Special thanks to Queensland Department of Transport and Main Roads, Gold Coast, Redland and Logan City Council, and Southern Regional Roads Group for their ongoing financial support. The research funding is greatly appreciated.
References
[1] Talbot, S. and Pelevin, A.,“The Queensland Asset Management Partnership,” presented at the 21st ARRRB & 11th REAAA Conference, Cairns, Australia, May 18–23, 2003, ARRB Transport Research Ltd., Melbourne, Australia, pp. 1–28. [2] TMR, 2015, “Queensland State-Controlled Roads and
Region Maps,” http://web.archive.org/web/20170825013216/ https://www.tmr.qld.gov.au/Travel-and-transport/Maps-and-guides/Queensland-state-controlled-roads-and-region-maps. aspx(accessed 25 Aug 2017).
[3] TMR, 2015, “Transport and Main Roads Annual Report 2014–15,” http://web.archive.org/web/20170825014216/ https://www.tmr.qld.gov.au/About-us/Corporate-information/ Publications/Annual-report/Department-of-Transport-and-Main-Roads-archive(accessed 25 Aug 2017).
2016–17 to 2019–20, Department Transport and Main Roads, Brisbane, Australia, 2016.
[5] Krarup, J. A., Rasmussen, S., Aagaard, L., and Hjorth, P.,
Output From the Greenwood Traffic Speed Deflectometer, ARRB Group Ltd, Canberra, Australia, 2006, pp. 1–10. [6] Greenwood Denmark, 2-15,“Traffic Speed Deflectometer,”
http://web.archive.org/web/20170825014618/https://www. greenwood.dk/tsd.phptsd.php. Greenwood Engineering (accessed 25 Aug 2017).
[7] Chad, M. and Wix, R., Trials and Tribulations of TSD Operations, ARRB, Vermount South Australia, Australia, 2015. [8] Rasmussen, S., Aagaard, L., Baltzer, S., and Krarup, J.,
“A Comparison of Two Years of Network Level
Measurements With the Traffic Speed Deflectometer,”
Ljubljana Europe, 2008, Transport Research Arena, pp. 1–8. [9] Muller, W. B. and Roberts, J., “Revised Approach to Assessing Traffic Speed Deflectometer Data and Field Validation of Deflection Bowl Predictions,” Int. J. Pave. Eng., Vol. 14, No. 4, 2013, pp. 388–402,https://doi.org/10. 1080/10298436.2012.715646
[10] Roberts, J., Ai, U., Toole, T., and Martin, T., Traffic Speed Deflectometer Data Review and Lesson Learnt, Austroads, Sydney, Australia, 2014.
[11] Graczyk, M., Zofika, A., Sudyka, J., and Rafa, J.,“Analytical Solution of Pavement Deflections and its Application to the TSD Measurements,” presented at the 24th ARRB Conference, Sydney, Australia, Oct. 22–24, 2014, ARRB Group Ltd, Sydney, Australia, 2014, pp. 1–13.
[12] Zofka, A., Sudyka, J., Maliszewski, M., Harasim, P., and Sybilski, D., “Alternative Approach for Interpreting Traffic Speed Deflectometer Results,” Transp. Res. Rec., Vol. 2457, 2014, pp. 12–18,https://doi.org/10.3141/2457-02 [13] Weligamage, J., Piyatrapoomi, N., and Gunapala, L.,Traffic Speed Deflectometer-Queensland Trial, Transport and Main Roads, Brisbane, Australia, 2010.
[14] TMR, Pavement Rehabilitation Manual, Queensland Department of Transport and Main Roads, Australia, 2012. [15] TMR,SCENARIO V5.1 Technical Manual, The Department of Transport and Main Roads, Brisbane, Australia, 2009. [16] TMR, 2015,“Category 5—Pavements, Subgrade and Surfacing
(MRTS 05),”http://web.archive.org/web/20170825020000/ https://www.tmr.qld.gov.au/business-industry/Technical- standards-publications/Specifications/5-Pavements-Subgrade-and-Surfacing (accessed 25 Aug 2017).
[17] Roberts, J.,“FWD Testing, STEP Calibration and Analysis of Selected Roads in Lake Macquarie City Council,” Report No. 008365-1, ARRB Group Ltd, Melbourne, Australia, 2014. [18] Odoki, J., Henry, G., and Herali, R.,Analytical Framework and Model Descriptions, Vol. 4, AIPCR, Birmingham, UK, 2000. [19] Baran, E., Conaghan, A., and Ramanujam, J., Structural
Assessment and Rehabilitation Design for Low Volume Roads, Transport and Main Roads, Brisbane, Australia, 2013.
![FIG. 1 Falling weight deflectometer (FWD) [ 19 ].](https://thumb-us.123doks.com/thumbv2/123dok_us/1490791.2699614/2.890.441.815.102.415/fig-falling-weight-deflectometer-fwd.webp)
![FIG. 6 Relationship between pavement deflection (dx) at any wheel offset (x) and the cumulative area of the plot of slope (V v /V h ), versus wheel load offset (x) [ 9 ].](https://thumb-us.123doks.com/thumbv2/123dok_us/1490791.2699614/4.890.58.446.755.1103/relationship-pavement-deflection-wheel-offset-cumulative-versus-offset.webp)