Munich Personal RePEc Archive
Maine Employment Change During the
Early Months of the COVID-19
Pandemic: A Shift-Share Analysis
Todd, Gabe
University of Maine
26 September 2020
Online at
https://mpra.ub.uni-muenchen.de/103125/
MPRA Paper No. 103125, posted 29 Sep 2020 09:52 UTC
Maine Employment Change During the Early Months of the COVID-19 Pandemic: A Shift-Share Analysis
Todd Gabe1
School of Economics University of Maine
School of Economics Staff Paper #640 Version 1.0, September 20202
1 Todd Gabe is a Professor in the School of Economics and author of the book Pursuit of Economic Development: Growing Good Jobs in U.S. Cities and States. This project was funded under federal award ED20PHI3070072 from the EDA University Center Economic Response and Recovery Programs to COVID-19. Gabe’s research program is also funded, in part, by Hatch Multistate Grant # ME 031808 (NE 1749) from the USDA National Institute of Food & Agriculture. Professor Andrew Crawley provided helpful comments on an earlier version of this report.
2 This report may be updated to clarify omissions or errors, or when data for future months
are released. Abstract:
The Maine economy experienced an 11-percent reduction in employment from February to July of 2020, with job losses of 18 percent from February to April and a 10-percent increase from April to July. Of the employment decline of 57,100 jobs from February to July, about 85 percent of the loss is related to the performance of the U.S. economy, and 16 percent is associated with factors that are unique to Maine.
Over the period of extreme job loss from February to April and the employment gains that happened between April and July, there’s wide heterogeneity in the performance of industry sectors in Maine. For example, the sectors of Health Care and Social Assistance, and Accommodation and Food Services performed worse than expected (based on employment change nationally and Maine’s industry mix) from February to April, followed by a period of better than expected performance in Maine from April to July. The Retail Trade sector is one of several industries in Maine that outperformed the sector nationally between February and April, and from April to July of 2020.
Maine Employment Change During the Early Months of the COVID-19 Pandemic: A Shift-Share Analysis
1. Introduction
Like most states, Maine experienced substantial job losses as a result of the COVID-19 pandemic. Between February and April of 2020, total private nonfarm employment fell by 18 percent in Maine.3 Although employment then increased by ten percent from April to July, the
state’s employment level in July of 2020 was 11-percent lower than in February.
The overall statewide employment change numbers mask wide variation in the performance of individual sectors of the Maine economy (see Table 1 and Figure 1). For example, the Arts, Entertainment, and Recreation industry experienced a 61-percent decline in employment from February to April of 2020, while employment in the Finance and Insurance sector fell by two percent. From April to July of 2020, Arts, Entertainment, and Recreation employment increased by 45 percent—still leaving the industry at 43-percent lower employment than in February—whereas Finance and Insurance industry employment decreased by another two percent.
This report examines February to July employment change in Maine, which covers the early months of the COVID-19 pandemic that started in March of 2020.4 The analysis uses a
shift-3 All of the employment figures used in this report are seasonally adjusted and use data from the U.S. Bureau
of Labor Statistics (BLS). In some cases, the employment figures may be updated (at a later time) by the BLS. The employment figures do not include self-employed workers. Also, the employment numbers in the early months of the pandemic may not accurately represent workers who were initially “furloughed” and then ultimately lost their jobs.
Stay-share model of the Maine economy that separates employment growth or decline into components that are related to what happened in the overall U.S. economy, growth or decline that is due to Maine’s industry structure, and growth or decline that is “unique” to Maine’s economic performance over the period.
Overall, the results show that about 85 percent of Maine’s employment decline from February to July of 2020 is related to what happened in the overall U.S. economy and about 16 percent of the decline is attributed to factors that are unique to Maine. The state’s industry mix (i.e., the types of businesses that are in relative abundance or are underrepresented in Maine) had a very small impact on February to July employment change, which means that Maine’s industrial structure neither hurt or helped (by very much) the employment losses associated with the COVID-19 pandemic.
2. Shift-Share Analysis
Table 2 shows results of a shift-share analysis of industry employment change in Maine between February and July of 2020.5 The column labeled as “National Growth Effect” is the
employment change that would have occurred in Maine if the state’s economy were a “mini version” of the U.S. economy. That is, the national growth effect is based on the industry’s rate of growth or decline in the U.S. economy (e.g., U.S. employment in the Health Care and Social Assistance industry decreased by six percent) and the industry’s percentage of overall U.S. employment (e.g., the Health Care and Social Assistance industry accounted for 16 percent of total U.S. employment as of February 2020). The national growth effect of a 5,157 decrease in
employment is, thus, interpreted as the reduction in Maine’s Health Care and Social Assistance industry if its employment change mirrored what happened nationally (i.e., decline of six percent) and if the sector’s employment share in Maine were identical to its U.S. employment share (i.e., 16 percent of the economy).
We know, however, that Maine’s economy is not a “mini version” of the U.S. economy and, thus, some of its employment change between February and July might be due to Maine’s own industry structure. This is referred to as the Industry Mix Effect, which is shown in Table 2. As an example, one way that Maine’s industry mix differs from the structure of the U.S. economy is that the Health Care and Social Assistance sector accounted for 20 percent of total Maine employment as of February 2020, compared with the industry’s share of 16 percent of total U.S. employment.
The industry mix effect of a 1,298 reduction in Maine employment in the Health Care and Social Assistance industry is interpreted as the February to July employment change in that sector due to the fact that Maine’s industrial structure (e.g., the Health Care and Social Assistance sector accounts for 20 percent of total state employment) differs from the structure of the U.S. economy (e.g., the Health Care and Social Assistance industry accounts for 16 percent of total national employment). The difference between the industry employment shares of the Maine and U.S. economies, combined with the sector’s U.S. growth rate (e.g., the Health Care and Social Assistance industry experienced a six-percent decrease in U.S. employment), determine the sign and magnitude of the industry mix effect.
For example, if Maine’s economy has a higher share of industry employment than a sector’s proportion of the U.S. economy (i.e., a surplus) and that sector is declining nationally,
the industry mix effect has a negative sign (i.e., it is less than zero). This is the case with Health Care and Social Assistance. Likewise, if the Maine economy has a lower share of industry employment than the sector’s proportion of the U.S. economy (i.e., a deficit) and if that sector were growing nationally, the industry mix would also have a negative sign. If the Maine economy has a surplus in a sector that is growing nationally or a deficit in a declining industry, the industry mix effect is greater than zero. For example, Maine has a slight deficit in the Arts, Entertainment, and Recreation industry (e.g., 1.8 percent of total Maine employment, compared with 1.9 percent of U.S. employment, as of February 2020) such that—given that this sector experienced a substantial reduction in U.S. employment—Maine’s industry mix effect is greater than zero for the Arts, Entertainment, and Recreation sector.
The third and final shift-share component is the Competitive Effect, which captures growth or decline that is not explained by the industry’s performance nationally or Maine’s industry mix. That is, the competitive effect represents growth or decline that is “unique” to the sector’s performance in Maine. The competitive effect of a 1,045 decline in employment in the Health Care and Social Assistance industry is interpreted as the change in employment from February to July of 2020 that is not related to the sector’s decline nationally or the fact that Maine has a surplus—i.e., Health Care and Social Assistance accounts for 20 percent of the Maine economy, compared with 16 percent nationally—in a declining industry. In other words, Maine’s Health Care and Social Assistance industry experienced a reduction in employment of 1,045 workers due to conditions that are unique to Maine.
A feature of the shift-share model is that the three individual components—i.e., the national growth, industry mix and competitive effects—sum to the exact amount of actual
employment change. For example, Maine’s Health Care and Social Assistance industry experienced a 7,500 reduction in employment between February and July of 2020, which can be broken into a 5,157 decline for the national growth component, 1,298 decline for the industry mix and a 1,045 reduction for the competitive effect. This can be further interpreted as 69 percent of the state’s reduction in Health Care and Social Assistance employment from February to July of 2020 is related to the sector’s performance nationally, 17 percent is associated with Maine’s industry mix, and 14 percent is due to factors that are unique to Maine.
The bottom of Table 2 shows the shift-share results for total private nonfarm employment in Maine. These results indicate that, if Maine’s economy were a mini version of the U.S. economy, the state would have experienced a 48,503 reduction in employment between February and July of 2020, and that the state’s industry mix is associated with a small increase in employment. This result related to the state’s industry mix suggests that—with the exception of the Health Care and Social Assistance sector, and a few other industries—the structure of Maine’s economy had a very small impact—in fact, it was greater than zero—on its overall employment change due to the COVID-19 pandemic. Finally, the competitive effect of a 9,381 decrease in total state employment means that over 9,000 jobs were lost due to reasons that are specific to Maine. Overall, about 85 percent of the state’s total employment decline is attributed to what happened in the U.S. economy, 16 percent of the decline is associated with factors unique to Maine, and the state’s industry mix provided a negligible (but positive) impact on February to July employment change in Maine.
Looking again at the shift-share results for individual sectors, we see that Maine’s employment change was “better” than what would have been expected (i.e., positive
competitive effect) based on the sector’s performance nationally and the state’s industry mix in the—among others—Administrative and Support and Waste Management; Retail Trade; Transportation, Warehousing, and Utilities; and Mining and Logging sectors. In the case of Retail Trade, the sector experienced a 2,400 reduction in employment, but we might have expected a decrease of 4,663 jobs given the sector’s performance nationally (i.e., national growth effect of a 3,735 decline) and the fact that Maine has a surplus in this sector that decreased nationally (i.e., industry mix effect of a 928 decline).
The Accommodation and Food Services industry experienced the largest employment reduction of 18,400 jobs between February and July of 2020, and 77 percent and 23 percent of this change is associated with the national growth and competitive effects, respectively. Maine’s manufacturing sector had an 8,300 reduction in employment, with 37 percent and 63 percent of the decline attributed to the national growth and competitive effects.
Given the fact that some sectors saw employment increases from April to July, after the steep reductions between February and April, it is informative to examine a shift-share analysis that is separated into the periods of February to April, and April to July (Table 3). As was the case in the shift-share analysis of the period from February to July of 2020, the shift-share components of the changes from February to April, and April to July, sum to the exact employment change that occurred.
Focusing on the Health Care and Social Assistance sector, we see that it experienced an employment decline of 16,400 workers between February and April, where 57 percent of the decline is related to the sector’s performance nationally, 14 percent (industry mix) is due to the fact that Maine has a surplus in the sector (which declined nationally), and 28 percent of the
decline (competitive effect) from February to April is associated with factors that are unique to Maine. From April to July, the Health Care and Social Assistance sector saw an employment increase of 8,900 jobs, with 46 percent, 10 percent and 44 percent of this change attributed to the national growth, industry mix and competitive effects, respectively. Whereas Maine’s industry mix for the Health Care and Social Assistance sector explained part of its decline between February and April—i.e., the state had a surplus in a sector that declined nationally over this period—the industry mix is positive for the span of April to July because the state had a surplus in a sector that grew nationally (from April to July).
Maine’s Retail Trade industry grew by 9,800 jobs between April and July (after a decline of 12,200 jobs from February to April) and about 22 percent of the increase is associated with factors that are unique to Maine. Likewise, Maine’s Retail Trade sector had a positive competitive effect, although small in magnitude, between February and April. This means that the February to April reduction in Retail Trade employment is related to the sector’s performance nationally and the fact that Maine has a surplus in Retail Trade. The state’s positive competitive effects in the two periods suggest that the Retail Trade sector—both when the industry declined and increased nationally—performed better in Maine than would have been expected (based on the sector’s U.S. employment change and Maine’s industry mix).
Maine’s Manufacturing industry, on the other hand, had negative competitive effects in both periods. This means that the sector’s employment decline in Maine from February to April was larger than expected based on the industry’s performance nationally and, between April and July, Maine’s Manufacturing sector did worse than expected relative to the U.S. increase in manufacturing employment. Similarly, the Information, Finance and Insurance, Management of
Companies and Enterprises, and Educational Services sectors had negative competitive components in both periods.6 Maine’s Mining and Logging, Retail Trade, and Administrative and
Support and Waste Management sectors had positive competitive components between February and April, and from April to July of 2020.
Of the three sectors with the largest (positive) competitive effects between April and July—Accommodation and Food Services, Health Care and Social Assistance, and Retail Trade— the Accommodation and Food Services, and Health Care and Social Assistance industries had the largest negative competitive effects from February to April. This means that, whereas these sectors experienced larger declines between February and April in Maine than would have been expected based on national trends and the state’s industry structure, these sectors also performed better than expected from April to July. Nevertheless, the Accommodation and Food Services, and Health Care and Social Assistance industries—along with Manufacturing, Educational Services, Information, and Management of Companies and Enterprises—have negative competitive effects of more than 1,000 jobs over the entire period of February to July of 2020.
3. Summary
The Maine economy experienced an 11-percent reduction in employment from February to July of 2020, with job losses of 18 percent from February to April and a 10-percent increase from April to July. Of the employment decline of 57,100 jobs from February to July, about 85
percent of the loss is related to the performance of the U.S. economy, and 16 percent is associated with factors that are unique to Maine.
Over the period of extreme job loss from February to April and the employment gains that happened between April and July, there’s wide heterogeneity in the performance of industry sectors in Maine. For example, the sectors of Health Care and Social Assistance, and Accommodation and Food Services performed worse than expected (based on employment change nationally and Maine’s industry mix) from February to April, followed by a period of better than expected performance in Maine from April to July. The Retail Trade sector is one of several industries in Maine that outperformed the sector nationally between February and April, and from April to July of 2020. Finally, the Manufacturing sector—along with services such as Information, Finance and Insurance, and Educational Services—underperformed in Maine compared to the industry nationally from February to April, and April to July of 2020.
A feature of the shift-share model is that—although it’s a useful framework for separating employment change into the three “sources” of the national growth, industry mix and competitive components—it does not tell us “why” regions have positive or negative competitive effects. Given that they represent employment change that is above or below what happened nationally (i.e., unique to a region), the competitive effects in Maine are likely explained by a variety of differences between the state and other U.S. regions. These could include differences in the number of COVID-19 cases and deaths, the implementation and timing of business closures and the state’s Stay-at-Home order (Gabe and Crawley 2020; Kong and Prinz 2020), the types of occupations present in the workforce (Dingel and Neiman 2020; Leibovici, Santacreu and Famiglietti 2020; Mongey, Pilossoph and Weinberg 2020, Mongey and Weinberg 2020), the
behavior of households and businesses as a result of the pandemic (Baker et al. 2020; Bartik et al. 2020), and a variety of other factors. Future research will shed more light on the characteristics of regions that explain differences in the employment change that occurred as a result of the pandemic.
References
Baker, Scott R., Robert A. Farrokhnia, Steffen Meyer, Michaela Pagel, and Constantine
Yannelis. 2020. “How Does Household Spending Respond to an Epidemic? Consumption
During the 2020 COVID-19 Pandemic.” Covid Economics 18 (15 May), 73-108.
Bartik, Alexander W., Marianne Bertrand, Zoë B. Cullen, Edward L. Glaeser, Michael Luca, and
Christopher T. Stanton. 2020. “How Are Small Businesses Adjusting to COVID-19? Early
Evidence from a Survey.” Working Paper 26989. National Bureau of Economic Research,
Cambridge MA, April 2020.
Dingel, Jonathan, and Brent Neiman. 2020. “How Many Jobs Can be Done at Home?” Working Paper 26948, National Bureau of Economic Research, Cambridge MA, April 2020.
Gabe, Todd, and Andrew Crawley. 2020. “A Note on the Reduction in Hospitality Sales Prior to a State’s COVID-related Stay-at-Home Order: Evidence from Maine, USA.” MPRA Working Paper #102362.
Hoppes, Bradley. 1997. “Shift-Share Analysis for Regional Health Care Policy.” Journal of Regional Analysis and Policy (27), 35-45.
Kong, Edward, and Daniel Prinz. 2020. “The Impact of Shutdown Policies on Unemployment During a Pandemic.” Covid Economics 17 (13 May), 24-72.
Leibovici, Fernando, Ana Maria Santacreu, and Matthew Famiglietti. 2020. “Social Distancing and Contact-Intensive Occupations.” Technical Report, St. Louis Federal Reserve Bank—On the Economy Blog March 2020.
Mongey, Simon, Laura Pilossoph, and Alex Weinberg. 2020. “Which Workers Bear the Burden of Social Distancing Policies?” Working Paper 27085, National Bureau of Economic Research, Cambridge MA, May 2020.
Mongey, Simon, and Alex Weinberg. 2020. “Characteristics of Workers in Low Work-From-Home and High Personal-Proximity Occupations” Becker Friedman Institute White Paper, March 2020.
Table 1. Maine Employment Change: February to July of 2020
February April July February to April to February to
Employment Employment Employment April Change July Change July Change
Mining & Logging 2,000 2,000 2,100 0% 5% 5%
Construction 30,200 28,700 29,600 -5% 3% -2%
Manufacturing 53,200 45,300 44,900 -15% -1% -16%
Wholesale Trade 19,100 18,200 18,100 -5% -1% -5%
Retail Trade 80,800 68,600 78,400 -15% 14% -3%
Transportation, Warehousing, & Utilities 18,500 16,700 17,700 -10% 6% -4%
Information 7,400 5,700 5,500 -23% -4% -26%
Finance & Insurance 26,300 25,700 25,200 -2% -2% -4%
Real Estate & Rental & Leasing 7,000 6,800 6,500 -3% -4% -7%
Professional, Scientific, & Technical Services 27,700 25,500 26,600 -8% 4% -4%
Management of Companies & Enterprises 12,200 10,700 10,600 -12% -1% -13%
Administrative & Support & Waste Management 28,300 25,400 27,200 -10% 7% -4%
Educational Services 22,700 18,900 19,100 -17% 1% -16%
Health Care & Social Assistance 107,300 90,900 99,800 -15% 10% -7%
Arts, Entertainment, & Recreation 9,700 3,800 5,500 -61% 45% -43%
Accommodation & Food Services 60,200 24,900 41,800 -59% 68% -31%
Other Services 23,100 18,900 20,000 -18% 6% -13%
Total Private Nonfarm Employment 535,700 436,700 478,600 -18% 10% -11%
Note: Maine employment figures are seasonally adjusted and use data from the U.S. Bureau of Labor Statistics (BLS). In some cases, the employment figures may be updated (at a later time) by the BLS. The employment figures do not include self-employed workers.
Table 2. Shift-Share Analysis of Maine Employment Change: February to July of 2020
February July Employment National Industry Competitive
Employment Employment Change Growth Effect Mix Effect Effect
Mining & Logging 2,000 2,100 100 -392 126 366
Construction 30,200 29,600 -600 -1,821 78 1,143
Manufacturing 53,200 44,900 -8,300 -3,093 -7 -5,200
Wholesale Trade 19,100 18,100 -1,000 -1,410 311 99
Retail Trade 80,800 78,400 -2,400 -3,735 -928 2,262
Transportation, Warehousing, & Utilities 18,500 17,700 -800 -1,927 540 587
Information 7,400 5,500 -1,900 -1,350 514 -1,064
Finance & Insurance 26,300 25,200 -1,100 -143 3 -960
Real Estate & Rental & Leasing 7,000 6,500 -500 -795 224 71
Professional, Scientific, & Technical Services 27,700 26,600 -1,100 -1,706 527 79
Management of Companies & Enterprises 12,200 10,600 -1,600 -469 -97 -1,034
Administrative & Support & Waste Management 28,300 27,200 -1,100 -4,730 1,280 2,350
Educational Services 22,700 19,100 -3,600 -1,468 -640 -1,493
Health Care & Social Assistance 107,300 99,800 -7,500 -5,157 -1,298 -1,045
Arts, Entertainment, & Recreation 9,700 5,500 -4,200 -3,695 185 -689
Accommodation & Food Services 60,200 41,800 -18,400 -14,113 -180 -4,107
Other Services 23,100 20,000 -3,100 -2,498 146 -748
Total Private Nonfarm Employment 535,700 478,600 -57,100 -48,503 784 -9,381
Note: Maine employment figures are seasonally adjusted and use data from the U.S. Bureau of Labor Statistics (BLS). In some cases, the employment figures may be updated (at a later time) by the BLS. The employment figures do not include self-employed workers. The analysis uses a shift-share model proposed by Hoppes (1997).
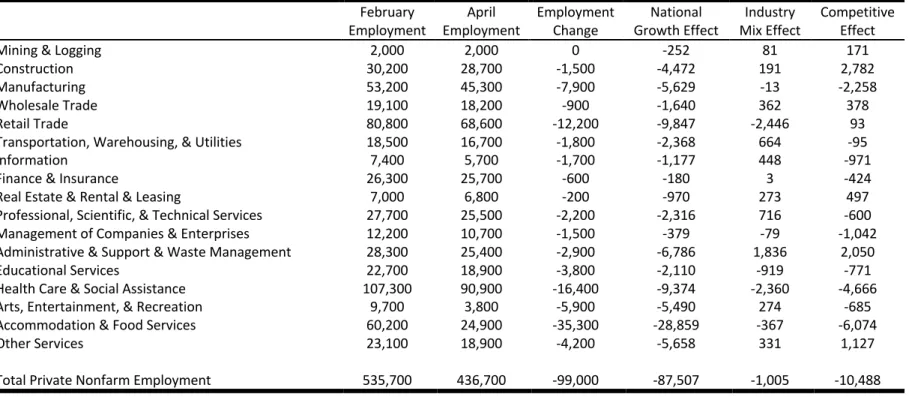
Table 3a. Shift-Share Analysis of Maine Employment Change: February to April of 2020
February April Employment National Industry Competitive
Employment Employment Change Growth Effect Mix Effect Effect
Mining & Logging 2,000 2,000 0 -252 81 171
Construction 30,200 28,700 -1,500 -4,472 191 2,782
Manufacturing 53,200 45,300 -7,900 -5,629 -13 -2,258
Wholesale Trade 19,100 18,200 -900 -1,640 362 378
Retail Trade 80,800 68,600 -12,200 -9,847 -2,446 93
Transportation, Warehousing, & Utilities 18,500 16,700 -1,800 -2,368 664 -95
Information 7,400 5,700 -1,700 -1,177 448 -971
Finance & Insurance 26,300 25,700 -600 -180 3 -424
Real Estate & Rental & Leasing 7,000 6,800 -200 -970 273 497
Professional, Scientific, & Technical Services 27,700 25,500 -2,200 -2,316 716 -600
Management of Companies & Enterprises 12,200 10,700 -1,500 -379 -79 -1,042
Administrative & Support & Waste Management 28,300 25,400 -2,900 -6,786 1,836 2,050
Educational Services 22,700 18,900 -3,800 -2,110 -919 -771
Health Care & Social Assistance 107,300 90,900 -16,400 -9,374 -2,360 -4,666
Arts, Entertainment, & Recreation 9,700 3,800 -5,900 -5,490 274 -685
Accommodation & Food Services 60,200 24,900 -35,300 -28,859 -367 -6,074
Other Services 23,100 18,900 -4,200 -5,658 331 1,127
Total Private Nonfarm Employment 535,700 436,700 -99,000 -87,507 -1,005 -10,488
Note: Maine employment figures are seasonally adjusted and use data from the U.S. Bureau of Labor Statistics (BLS). In some cases, the employment figures may be updated (at a later time) by the BLS. The employment figures do not include self-employed workers. The analysis uses a shift-share model proposed by Hoppes (1997).
Table 3b. Shift-Share Analysis of Maine Employment Change: April to July of 2020
April July Employment National Industry Competitive
Employment Employment Change Growth Effect Mix Effect Effect
Mining & Logging 2,000 2,100 100 -137 33 204
Construction 28,700 29,600 900 2,583 227 -1,910
Manufacturing 45,300 44,900 -400 2,471 -50 -2,821
Wholesale Trade 18,200 18,100 -100 224 -41 -283
Retail Trade 68,600 78,400 9,800 5,956 1,686 2,159
Transportation, Warehousing, & Utilities 16,700 17,700 1,000 431 -114 684
Information 5,700 5,500 -200 -169 77 -108
Finance & Insurance 25,700 25,200 -500 36 0 -536
Real Estate & Rental & Leasing 6,800 6,500 -300 171 -35 -436
Professional, Scientific, & Technical Services 25,500 26,600 1,100 594 -182 689
Management of Companies & Enterprises 10,700 10,600 -100 -88 -11 -1
Administrative & Support & Waste Management 25,400 27,200 1,800 2,003 -372 169
Educational Services 18,900 19,100 200 626 260 -686
Health Care & Social Assistance 90,900 99,800 8,900 4,110 912 3,878
Arts, Entertainment, & Recreation 3,800 5,500 1,700 1,748 -304 256
Accommodation & Food Services 24,900 41,800 16,900 14,367 -2,363 4,896
Other Services 18,900 20,000 1,100 3,078 85 -2,063
Total Private Nonfarm Employment 436,700 478,600 41,900 38,004 -193 4,089
Note: Maine employment figures are seasonally adjusted and use data from the U.S. Bureau of Labor Statistics (BLS). In some cases, the employment figures may be updated (at a later time) by the BLS. The employment figures do not include self-employed workers. The analysis uses a shift-share model proposed by Hoppes (1997).