Job Growth in Early Transition: Comparing Two Paths
Štěpán Jurajda Katherine Terrell
CERGE-EI* University of Michigan**
CEPR, IZA, WDI CEPR, IZA, WDI
August 2002 Abstract
Small start-up firms are the engine of job creation in early transition and yet little is known about the characteristics of this new sector. We seek to identify patterns of job growth in this sector in terms of niches left from central planning and ask about differences in job creation across two different transition economies: Estonia, which experienced rapid destruction of pre-existing firms, and the Czech Republic, which reduced the old sector gradually. We find job growth within industries to be quantitatively more important than job growth due to across-industry reallocation. Furthermore, the industrial composition of start-ups is strikingly similar in the two countries. We offer convergence to "western" industry firm-size distributions as an explanation. We also find regularities in wage evolution across new and old firms, including small differences in job quality across the two transition paths.
Abstrakt
Přestože jsou malé nově vznikající firmy hlavním zdrojem nových pracovních míst v průběhu ranné transformace, jejich charakteristiky jsou málo známé. V tomto článku proto hledáme hlavní oblasti jejich růstu a srovnáváme tvorbu pracovních míst ve dvou různých transformačních ekonomikách: Estonsku, které prošlo obdobím drastické destrukce post-komunistických firem, a České Republice, kde k zániku starých pracovních míst docházelo jen postupně. Naše výsledky ukazují převládající roli relokace uvnitř odvětví pro růst pracovních míst. Dále nacházíme překvapivě shodnou odvětvovou strukturu nových firem v obou transformačních ekonomikách. Jako vysvětlení obou faktů nabízíme konvergenci k typické struktuře velikosti firem uvnitř odvětví. Přestože byl jejich makroekonomický vývoj odlišný, charakter nových firem v obou ekonomikách byl velmi podobný, včetně obdobného vývoje mzdových rozdílů mezi novými a starými firmami a kvality nově vznikajících míst.
* A joint workplace of the Center for Economic Research and Graduate Education, Charles University, Prague, and the Economics Institute of the Academy of Sciences of the Czech Republic. Address: CERGE-EI, POB 882, Politických vězňů 7, Prague 1, 111 21, Czech Republic; Tel.:+420-2-24005-139; E-mail: [email protected]
** William Davidson Institute, University of Michigan Business School, Ann Arbor, MI 48109. Tel: (734) 615-4558; E-mail: [email protected]
Acknowledgements We would like to thank Jan Svejnar, Randall Filer, and Ira Gang for helpful
discussions and valuable suggestions. Raul Eamets provided us with important information on Estonian statistics; Rudolf Winter-Ebmer and Michael Burda provided us with information on firm-size distributions in Austria and Germany, respectively. We benefited from comments of participants at the IZA/WDI Conference on Labor Market Dynamics in Emerging Market Economies in Costa Rica. The Czech data collection was supported by NCEEER grant no. 814-13g. This research was supported by a grant from the CERGE-EI Foundation under a program of the Global Development Network.
1. Introduction
“Transition” of the productive structure in the countries of Central and Eastern Europe (CEE) and the former Soviet Union is a process aimed at achieving efficiency through (1) restructuring of enterprises that were created during central planning (e.g., by privatization), and (2) reallocating capital and labor from these post-communist firms to new start-up private ones.1 Much research within the transition literature has analyzed the process of privatization and whether it has resulted in efficiency-inducing restructuring (for surveys see Roland, 2000 and Svejnar, 1999, 2002). On the other hand, relatively little work has focused on new start-up firms, even though early in transition at least one important author, Kornai (1990), viewed the rise of the small new sector as more important for the success of transition than the restructuring of the old state-owned firms. Only recently has an empirical literature emerged that stresses the importance of the new start-up firms as the engine of growth in these economies (see, e.g., Berkowitz and DeJong, in press, and Mitra et al., 2001). Nevertheless, little remains known about the evolution and characteristics of this new sector.2
In this paper we analyze the growth of the new sector in two countries whose paths of transition have been very different: the Czech Republic and Estonia. Our earlier research (Jurajda and Terrell, 2001) demonstrated that the new sector was an impressive sole engine of job creation in both countries at the start of transition: In only three to five years more jobs were provided by de novo (start-up) firms than by the firms inherited (and potentially
transformed) from communism. This massive new-sector growth occurred on different policy backgrounds. While early transition in Estonia was characterized by massive job destruction of the old firms in the absence of an effective social security net, Czech reallocation proceeded at a more gradual pace, involved relatively generous social support, and featured extensive voluntary moves from the old firms to the new sector.
In our previous work, we interpreted the aggregate job reallocation patterns in terms of macroeconomic theories. In the present analysis we focus on microeconomic
1 For a similar view on adjustment in developing countries see Caballero and Hammour (1996).
2 While there is extensive research on the reallocation of labor across industrial branches (see Boeri and Terrell, 2002, for a summary), as well as work focusing on patterns of private employment, for the most part this literature uses data that do not differentiate between privatized and de novo private firms. This is crucial to the extent that privatized firms did not effectively restructure, which is especially likely in the Czech Republic (see, e.g., Roland, 2000).
3
aspects of the new-to-old reallocation. We ask to what extent these new firms are shaping the economies into more mature market economies, both in terms of industrial and firm-size structure. We expect new-sector job growth to be strongest in industries that were understaffed under central planning. To the extent allowed by data, we also ask about the productivity of the new jobs and hence about their contribution to the economic growth of these economies.
Our previous macroeconomic comparison of the gradual Czech and rapid Estonian transition paths found similar levels of aggregate job creation on the background of dramatically different levels of job destruction and social safety nets. The second line of questioning in this paper asks if these paths led to the creation of different types of jobs in the new sector. One may expect the Estonian new sector to create fewer jobs in the more capital intensive sectors given the relative scarcity of capital in this country compared to the Czech Republic (see Section 2.1). It would also seem that the quality of jobs created in an environment with high incidence of unemployment and low benefits would be lower compared to that of jobs created in an environment of low unemployment and adequate benefits. Hence, it is interesting to ask to what degree the new sector served as a depository for the unemployed, especially in Estonia. Finally, since much of the Czech reallocation occurred as a result of voluntary worker moves from old to new firms while most of the Estonian reallocation resulted from involuntary mobility, we expect higher new-old wage differentials in the Czech Republic than in Estonia. Similarly, the demographic composition of the new sector may be expected to differ under the more voluntary reallocation, with a larger fraction of young workers who can better reap benefits from investing into new skills required in start-up enterprises.
The relative lack of research on new firms is likely caused by the fact that micro data sets on the early transition evolution of employment by the new/old distinction are scarce. Our findings are based on labor market histories from retrospective household survey data which allow one to distinguish old vs. new firms as opposed to distinguishing private (including privatized) vs. state-owned. An important advantage is that the data are representative samples of population in both countries, and hence cover employment in all industries (not just manufacturing) and firm sizes.
The paper proceeds in Section 2 with some background on the transition experience of our two sample economies and with a discussion of the existing literature. In Section 3
we introduce our data and empirical strategy. The findings are presented in Section 4; Section 5 concludes.
2. Background and Previous Literature
2.1 Transition in the Czech Republic and Estonia
A decade after the start of transition, the Czech Republic and Estonia are two of the most market-oriented economies in the region. The Czech Republic became free of Soviet rule at the end of 1989 and undertook its first macroeconomic and institutional reforms in 1991, whereas Estonia gained independence from the Soviet Union in 1991 and enacted a reform package, similar to the Czech one, in 1992.3
However, Estonia experienced a deeper and longer recession than did the Czech Republic.4 Whereas the unemployment rate in the Czech Republic peaked at 4.1 percent during the year of price liberalization (1991) and then stabilized at around 3 percent until 1996 (five years after the start of transition), the unemployment rate in Estonia continued to rise throughout the entire period, reaching almost 10 percent in 1996. According to official statistics, by 1996, the end of our period of study, employment levels in Estonia were 77 percent of their 1989 levels and Czech employment was at 93 percent its 1989 level. The Estonians also faced far higher levels of inflation throughout the entire period, but especially in its year of price liberalization when the country suffered Ruble hyperinflation of 1,076 percent. The government responded to runaway inflation by aggressively implementing a tight monetary and fiscal policy and introducing a currency board for the newly established Estonian currency (crown) in July, 1992 (Eamets, 2001). Finally, real wages declined more in Estonia than in the Czech Republic during the hyperinflation year, but followed a very similar pattern once the new Estonian currency was introduced.
The privatization process proceeded somewhat more rapidly in Estonia than in the Czech Republic (Kotrba and Svejnar, 1994; Eamets and Philips, 1998). There is extensive evidence on the Czech privatization suggesting little success in implied restructuring (see,
3 For more detail, see Dyba and Svejnar (1995) and Eamets (2000).
4 The comparison of Estonia and the Czech Republic is essentially comparing the former Soviet Union with the CEE in all the above respects (except for the low level of the unemployment rate in the Czech Republic).
5
e.g., the survey in Roland, 2000). On the other hand, little information is available on the amount of credit available for the start-up firms. There are no official statistics on the share of bank credit going to small new firms in either country, yet the national statistics do indicate that there was more overall credit available in the Czech Republic than in Estonia. Our calculations indicate that total credit available as a percentage of GDP was about 66-69 percent in the Czech Republic (1991-94) whereas it was only 14-17 percent in Estonia (1994-95). More importantly, new credit was about 10-12 percent of GDP in the Czech Republic (1993-94) whereas it was only 2 percent in Estonia (1994-95). Survey evidence from Central European countries suggests that their credit markets have provided
de novo private firms with large amounts of financing from the early stages of firm
existence and that credit for newly established firms has been more available in the Czech Republic than elsewhere (Bratkowski et al., 1999). We also know that the relative share of GDP allocated to active labor market policies, another source of financing for start-up firms, was lower in Estonia than in the Czech Republic (0.19 percent vs. 0.08 percent during the 1990s, see Riboud et al., 2001).
Finally, we note that in spite of the deeper recession in Estonia its social safety net was substantially less generous than in the Czech Republic. In the first year of transition, the unemployed Czechs were offered 12 months of unemployment benefits entitlement and benefits as high as 90% of the previous wage. As the transition proceeded the Czechs tightened their unemployment benefit system, reducing the entitlement period to six months and lowering the replacement rate to between 50-60% of the previous wage. Whereas an Estonian unemployed worker also received benefits for six months, the replacement rate was only 7-10%. Finally, after six months of unemployment benefits, all poor Czech households are entitled to welfare benefits indefinitely, whereas only the poor Estonian families with three or more children are entitled to welfare assistance and for only up to three months.
2.2 Previous Literature
The firm-based analysis of job creation and destruction in transition pointed out the dominant role of small new firms in job creation and large old firms in job destruction (e.g. Bilsen and Konings, 1998; Johnson et al., 2000). However, this research had to rely on
small samples of firm survey data.5 The data scarcity is reflected in the few detailed analyses performed to-date about the growth of the de novo sector, its determinants and the
impact of this sector on the economy.6
The available evidence suggests that entrepreneurial activity is a critical source of growth in post-socialist countries. Berkowitz and DeJong (in press) find that the number of start-up firms across Russian regions exhibits a strong and enduring relationship with GDP growth rates. McMillan and Woodruff (2001) review studies of China, Poland, Russia and Vietnam and conclude that the robust economic growth enjoyed by Poland and China is attributable in large part to substantial entrepreneurial development they have enjoyed, while the economic stagnation Russia has endured during its transition is largely due to sluggish entrepreneurial development.
In this paper we use worker-level data to analyze job reallocation. Only two other studies use worker data to examine job creation and destruction in Estonia and the Czech Republic. Haltiwanger and Vodopivec (1999) provide an extensive analysis of Estonia, using the same data we use. Among other things, they study job creation and destruction in the public and private sectors, where the latter combines jobs in the privatized sector with those in de novo firms. Here we explicitly focus on start-ups (new sector) and
aggregate privatized sector jobs with the remaining state-owned enterprises (old sector). Jobs in the public sector (education, health, public administration) are partitioned out and not the focus of our study. In our earlier paper (Jurajda and Terrell, 2001), we use the same new/old definitions to relate the degree and timing of aggregate job reallocation to macroeconomic theory.
Finally, since we also examine wage differentials between old and new sector jobs in this paper, we should point out that there is a small literature that focuses on wage gains of individuals who change jobs in transition economies.7 This research sheds light on the nature of labor reallocation to the extent that wage gains reflect productivity gains. However, except for Munich et al. (2001), which uses the same Czech data that we use in this paper, none of these studies examines wage changes associated with the emerging new
5 There are representative studies of self-employment, however. See for example, Earle and Sakova (2000). 6 Bratkowski et. al (1999) are one exception. They offer survey evidence from three Central European countries which implies that credit markets provide de novo private firms with large amounts of financing
from the early stages of firm existence, and that credit for newly established firms is more available in the Czech Republic than in Hungary and Poland.
7
private sector. Munich et al. (2001) study the wage growth of a panel of individuals who were employed in both 1989 and 1996 in the Czech Republic to test competing predictions about the relationship between job and wage mobility, taking into account the decision of workers to quit or stay and to move to firms in the new versus old sector of the economy. Their findings suggest that those who quit an old sector job for a new one had the highest wage gains, and those who were laid off and went to another old sector had the lowest gains.
3. Data and Measurement Issues
Measuring the dynamics of worker and job reallocation into the de novo private sector at
the beginning of the transition from communism to capitalism is not easy. First, most of the start-ups are small firms (see Jurajda and Terrell, 2001) and the statistical offices did not include firms with fewer than 20 workers in their firm surveys. Moreover, the offices were unable to locate many of the newly established firms with more than 20 employees. Second, most of the existing household survey data does not differentiate between new private and privatized firms. Furthermore, the household labor force surveys started to be implemented in these countries only in the mid-1990s, leaving the first crucial years of transition undocumented.
Hence, the only way to gather representative information on the entire population of firms during the early period of transition is to collect retrospective data from households, asking individuals about employer attributes.8 In this section we briefly describe these data and show how measures of job reallocation, which are similar and complementary to those based on firm-level data, can be constructed with individual data. We refer the reader to Jurajda and Terrell (2001) for a more detailed description of the data and these measures.
7 See, e.g., Boeri and Flinn (1997), Burda and Mertens (1998), Hunt (1998), Munich et al. (2001), Noorkôiv, et al. (1998) and Sabirianova (2000).
3.1Data
Our analysis uses data from two similar retrospective surveys. The Czech survey was administered in December 1996 to 3,157 randomly selected households throughout the Czech Republic using the sample frame of the official Labor Force Survey. We have the employment histories of 4,786 individuals, who experience 7,926 main jobs during the 1991-1996 period.9 The Estonian survey was administered in the first quarter of 1995 to one percent of the population between the ages of 16 and 75 in 1995. In Estonia, we have usable data on 7,928 individuals with at least one spell of employment during 1989-1995; in total they experience 14,465 main jobs. The number of jobs per person in the data is therefore quite low at 1.82 in Estonia and 1.65 in the Czech Republic.
For each job there is information on the industry of employment, type of employment and a number of employer attributes. For those that exited their employment, we also observe the reason for separation. Whereas in both countries there is information on the respondents' wage at the beginning and end of each job, in Estonia respondents were also asked to report their earnings in October of each year. However, wage information from the hyperinflation years of 1990-1991 is not usable.10
Retrospective data is often criticized for "recall bias." Yet, research indicates that individuals recall traumatic events more readily and we believe that changes in the labor market status (rare at 1.7 to 1.8 jobs per person during six years) are likely to have been particularly memorable in an economy transiting from a system with many years of steady employment.11
How do we classify firms into the old and the new sectors? Given the evidence on the lack of restructuring in the privatized firms in the Czech Republic (Roland, 2000), we would like to pool state and privatized jobs into the old sector and distinguish the de novo
private enterprises (new sector) from the privatized firms. Whereas the Czech data allow
8 One could also collect firm-level surveys today with retrospective questions about employment, but such sampling would not cover new firms started in early transition that went out of business, which would lead to underestimating the size of the new sector.
9 We have compared the means and distributions of the major demographic characteristics (i.e., age structure, gender, region of residence and household size) of our sample in 1996 with those from the national Labor Force Survey and we find that our sample is representative in terms of these characteristics. See Munich, Svejnar and Terrell (1997) for a description of the survey and sample design as well as the descriptive statistics of the sample relative to the LFS data.
10 To form complete monthly labor market histories, we interpolate wages from the available information.
11 For Estonia, Noorkoiv et al. (1997) compared the responses on economic activity in 1989 in the 1995
survey with the responses in the 1989 census and found that "the recall data corresponded quite well. The majority of the discrepancies are attributable to changes in labor force definitions."
9
us to make these distinctions,12 in the Estonian questionnaire, firm ownership is categorized as state, private, or cooperative/collective. For jobs starting during our sample period the data do not distinguish jobs in a de novo private firm from those starting in
privatized enterprises. Given that Estonian privatization is considered more efficient than that of the Czech Republic in terms of restructuring, we categorize jobs starting in a private firm as new-sector jobs and we keep ongoing jobs in privatized firms in the old sector. Following this strategy, the observed growth of the new sector will not be due to reclassification of ongoing jobs. Our choice maximizes comparability across the two countries given the structure of the data and the relative success of Estonian privatization in restructuring.13
In the end, we therefore distinguish between three main employment sectors: the
old sector (comprised of jobs in the state-owned enterprises, cooperatives, and privatized
firms), the new sector (including all jobs in de novo private firms and the self-employed as
well as jobs of new hires into Estonian privatized firms), and the public sector (public
administration, health and education). Our firm-type assumptions carefully mimic the theoretical concepts and fit the available facts from these transition economies. As demonstrated in Jurajda and Terrell (2001), they also provide a very powerful way of slicing up the data.
3.2 Measurement of Job and Worker Reallocation Rates
Although job destruction and job creation are traditionally measured with firm data, they can also be measured from worker flow data using information on the type of employment separation.14 In the Czech (Estonian) questionnaire, we have 13 (21) answers for how someone separated from their job. We define job destruction (JD) as any separations
12 Respondents are asked about the ownership type of their employer at the end of their employment spell. The choices are, e.g., "newly established private firm," "firm after privatization," "firm in privatization." This is not a perfect measure of ownership. In particular, it is unclear how the respondents consider spin-offs from privatized or state-owned firms. Yet, as we argue above it is the best measure available.
13 It is not possible to gain full comparability of the new-sector definition across the Czech and Estonian data. However, we have compared the implied Estonian employment evolution to simulations based on realistic assumptions about the hiring rates of de novo and privatized firms and concluded that the differences at the
aggregate level are minor. These results are available upon request. An alternative strategy is to reclassify jobs in privatized firms as new. See Haltiwanger and Vodopivec (1999) for an analysis of the Estonian data that relies on such private/state coding, which is, however, not available in the Czech data.
where: 1) the firm was closed down (by the respondent or another employer) and 2) the separation was part of a mass layoff. The JD rate is the total number of job destructions at a given time t, divided by the number of jobs in t-1. Clearly some separations not included
in these two types (e.g., retirement or quit without replacement) also correspond to job destruction; hence, our JD measure is likely to be a lower bound estimate.
To measure job creation (JC), we follow the existing literature and use the simple identity that net employment growth is the difference between job creation and job destruction. This implies that JCtk = ∆Etk + JDtk, where ∆Etk denotes the time change in
employment in sector k, and where JCtk and JDtk are job creation and job destruction counts
in sector k in time t respectively.15
Again, this may be considered as a lower bound estimate for JC because JD may be underestimated. In particular, when the estimated JCtk measure is negative, it informs us
that the minimum number of quits not replaced is -JCtk . Hence, whenever the initial JCtk
estimate based on layoffs without replacement is negative we add the negative of JCtk to
our JDtk measure and set JCtk at zero.16
Our measure produces the same net job creation as that based on firm data but it results in a measure of gross job flows that is not identical to that of the firm-level studies. Nevertheless, our worker-level data offer important advantages. In particular, unlike data sets used in the empirical literature on job creation and destruction in transition, our data are based on well-defined random sampling, cover all economic activities and all firm sizes in the economy, and provide a continuous coverage of transition.17 Many studies on transition countries use small unrepresentative samples of firms or focus on one industry only. Furthermore, these data often suffer from “survival bias” as the firm samples are typically collected only during mid-transition and therefore include only surviving firms. 14 See Davis and Haltiwanger (2000, pp. 2716-7) for the standard definitions of job creation and job
destruction using firm-level data. See Blanchard and Diamond (1990) for the development of comparable measures using worker-level data.
15 This strategy of estimating job creation and job destruction rates relies on random sampling. When we observe a layoff with replacement (not mass layoff) within a given employment category, it is expected to be compensated by hiring another worker within our sample into this employment category. Layoffs with replacement constitute only about 2% (3-6.7%) of all Czech (Estonian) separations.
16 In our final empirical work, we perform this correction at a more detailed level, checking for JC
tks<0 where
s denotes one-digit industry and summing up the corrected JDtks across industries within employment sectors
k to obtain our final estimate of JDtk. This additional level of detail changes the corrected JD measure only in the old sector, which comes as no surprise.
17 The issue of observing firms of even very small size turns out to be particularly important for the Czech transition. See Jurajda and Terrell (2001) for details.
11
Survival bias may not only affect state-owned enterprises, but can come from the closure of newly established private businesses during (chaotic) early transition. This “survival bias” can lead to the underestimation of job destruction rates and is not present in our data.
Perhaps most important is the fact that the firm-level approach is not available for medium and large firms during the early years of transition when Czech unemployment diverged from the rest of the CEE countries, and little firm-level information exists for small firms in all years. Thus relying on firm data alone would ignore potentially important evidence that one can find using our approach. Our data also allow us to simultaneously consider worker and job flows, and our measure of job reallocation captures within-firm restructuring, which is not discernible with firm-level data. Firm-level data contain only the changes in total firm (plant) employment. If firms in a given sector maintain constant employment, but lay off and hire an equal number of workers (into different positions), such restructuring would be ignored in a firm-level data set, but is captured in our data.
4. Results
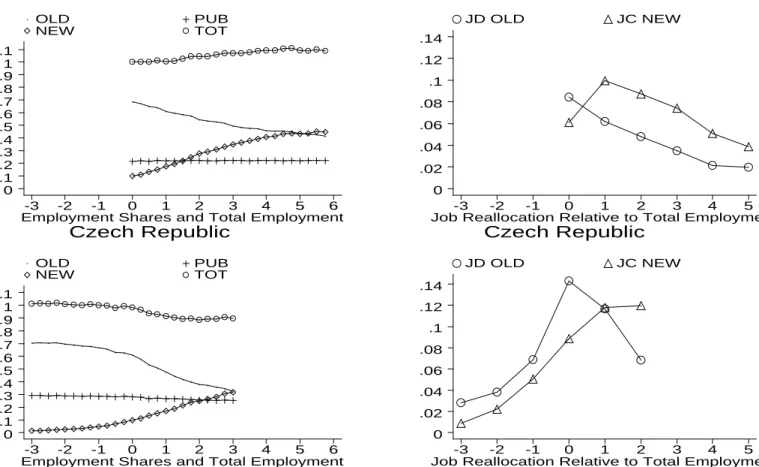
Figure 1 sets the aggregate stage for our inquiry about the nature of job creation in early Czech and Estonian transition. Its two left quadrants summarize employment reallocation across our three main sectors in each country, while the right two graphs show the evolution of job creation and destruction. We recast time in terms of the start of the reforms; year 0 corresponds to 1991 for the Czech Republic and 1992 for Estonia.
Two major patterns may be observed. First, the growth of the new sector is striking in both countries: As seen by their shares of employment (NEW and OLD), the start-up firms provide more jobs than the old firms three to five years into the transition process. The rate of new sector growth in Estonia surpasses that in the Czech Republic. (We note that the size of these firms is relatively small: 85 to 90 percent of all jobs in the new sector during the first few years of transition is located in firms employing less than 100 workers.) Second, the reallocation in Estonia occurs on the background of drastic job destruction in the old sector (JD OLD) and falling employment (TOT) compared to gradual job destruction and rising employment in the voluntary-move driven Czech transition.18
18 Job creation in the new sector (JC NEW) and job destruction in the old sector (JD OLD) are plotted as a share of total employment in each country. TOT is the level of total employment at time t relative to
(We ignore job creation in the old sector and job destruction in the new sector given their negligible size during early transition. See Jurajda and Terrell, 2001).
We explore the characteristics of this new sector’s growth. There are some characteristics we would expect in all transition economies as they become market oriented. Specifically, we would expect that the new sector creates relatively more jobs in industries (economic activities) that represent greater employment and output shares of market economies compared to planned economies (e.g., trade, restaurants and hotels, financial and other services). We would expect that the creation of these new jobs is strongly related to economic growth. Given the near non-existence of small firms under central planning, we expect the new job creation process would lead to convergence in firm size structures to that of the more mature market economies.
In addition to these patterns for transition countries in general, we also expect differences in the evolution of the new sector and its characteristics in Estonia and the Czech Republic because of their different patterns of job destruction and relative levels of unemployment and social safety nets. In particular, we would expect a larger share of job matches in Estonia to be of poor quality, and perhaps simply a repository for the unemployed. The new-to-old sector wage difference should be lower in Estonia than in the Czech Republic, where a higher share of the transitions from old to new was voluntary. For the same reason, one would expect the workers in the Czech new sector to be markedly younger and more educated than the workers in the Czech old sector, whereas in Estonia there would be less of a difference in the characteristics of workers in the new and old sectors. In the following five sections, we gather evidence on each of these expectations.
4.1 Industrial Reallocation
This section provides new evidence on the industrial distribution of job reallocation in early transition.19 We start in Figure 2 with estimates of the annual industry-specific job creation and job destruction rates (as a fraction of industry employment) for eight industrial branches.20 In our previous paper (Jurajda and Terrell, 2001) we show that all of job creation at the aggregate level occurs in the new sector, while job destruction is
19 Here our individual-data analysis complements the firm-level work of Faggio and Konings (2001) based on medium and large firms. Our evidence is also complementary to the extensive research on worker reallocation across industrial branches (see Boeri and Terrell, 2002, for a summary).
13
concentrated in the old sector in both economies. Hence, in what follows we do not need to differentiate between the new and old sectors in our presentation of industry job reallocation rates.
We find in all industries that there is a higher level of job reallocation (JC + JD) in Estonia than in the Czech Republic. This is because of both higher JC and higher JD in Estonia (JD being especially high in Estonian agriculture, but also in trade, which enjoys a very high JC). The time pattern of JC is different across the two economies in some of the industries. In all branches of the Czech economy and in half of the Estonian industries, JC peaks in one or two years after the start of transition. On the other hand, Estonian JC continues to climb at the end of our sampling period in manufacturing, construction, other services, and finance.21 Overall, the patterns of JC and JD are very different across industries and across the two countries for a given industry, indicating very different processes. However, it is true that for all but a few cases, the national pattern of JD or JC dominance (i.e., JD>JC in Estonia and JC>JD in the Czech Republic) prevails within each industry as well.
What is the result of these industry job flows in terms of sectoral reallocation of employment? Each graph of Figure 3 shows the evolution of two indicators for each of our eight grouped industrial branches in the Czech Republic and Estonia. We plot the total employment in each industry as an index of its level at the start of transition (SIZE) to highlight growing and declining industries and juxtapose to this the share of start-up employment in all jobs within the industry (NEW) to see where “new employment” is growing most rapidly.
The patterns of industry employment (SIZE) during transition are well known and it is not surprising to see agricultural employment as well as employment in manufacturing decline, while employment of trade and finance industries grow. The largest decline within each country occurs in agriculture, with its employment falling almost 40 percent in both countries when compared to the start of transition. On the other hand, wholesale and retail trade and finance showed the largest gain in each country.22 Overall, transition leads to a convergence in the industrial structure of employment typical for mature market economies.
21 The JC rate in the small Estonian finance industry in year 2 is over 0.7 and would not fit on our graphs.
22 There are also sizeable cross-country differences in industry employment evolution, for example services grow faster and manufacturing falls slower during Czech transition.
We expected that new firms would contribute to this convergence, and indeed they constitute a large share of the growing new economic activities (see NEW). Only three years into transition, over 70 percent of employment in trade and over 50 percent in construction and restaurant industries is in start-up firms in both countries.
However, Figure 3 indicates that start-ups grow in importance not only in expanding, but also in declining industries. By the end of 1995 (Czech t=4, Estonian t=3) new firms provide over a third of all jobs within both manufacturing and service industries
in each country, despite the misallocation across those two industry groups at the outset of
transition. While manufacturing was over-staffed under central planning and shrank during transition, the number of new manufacturing jobs is comparable to the number of new jobs in the rapidly expanding trade industries in both the Czech Republic and Estonia.
This finding leads us to quantitatively compare new job growth across industries with new job growth within industries. How can we know if new jobs emerge from reallocation across as opposed to within industry? Obviously, a part of new job growth corresponds to the expansion of industries under-staffed under central planning. In industries that are shrinking, however, all of new sector growth is due to within-industry job reallocation. (Reduction of employment in a given industry could have been achieved by scrapping of old jobs alone without any growth of new firms.) In growing industries, within-sector reallocation amounts to that part of new-sector job growth that replaces disappearing old-sector jobs. The remaining part of the new sector's growth in growing industries is attributable to across-industry reallocation.
We compare the start of transition (year 0) with transition year 3 in both countries and calculate the size of both "within" and "across" job growth. In the Czech Republic and Estonia the sum of within-industry new-sector job growth amounts to 18% and 21% of the
total employment at the start of transition. In contrast, summing up the new-sector job growth in expanding industries (net of the replacement of old-sector jobs there) gives 12% for the Czech Republic and 5% for Estonia. In both countries, within-industry start-up job growth is quantitatively more important than increases in employment in new firms across industries.23
Finally, Figure 3 is surprising not only because of the large growth of new jobs
23 The total across-industry job destruction of old jobs over this 4-year period, which equals the sum of job losses of declining industries, is 18% in Estonia and only 5% in the Czech Republic.
15
within declining industries, but also because of the similarity in the share of new employment across countries. Even though Estonian and Czech transition followed a different policy path, reflected by a different pattern of job creation and destruction and a different evolution of total employment (Figure 2), the share of new jobs within industries in Figure 3 is remarkably analogous. This holds true even for industries which grew in one country and shrank in another (e.g., construction).24
4. 2 Firm-size Reallocation
Why is it that new jobs are created not only in the niches left open by central planning (e.g. in services) but within all branches of the economy? And why is it that the share of new jobs on industry employment is so similar across two different macroeconomic scenarios? It is a well-known fact that one of the main distortions of central planning was to do away with small firms. Given that almost all new job creation occurs in small firms, one natural interpretation of these reallocation patterns is that they are driven by convergence to "normal" industry-specific firm-size distribution.
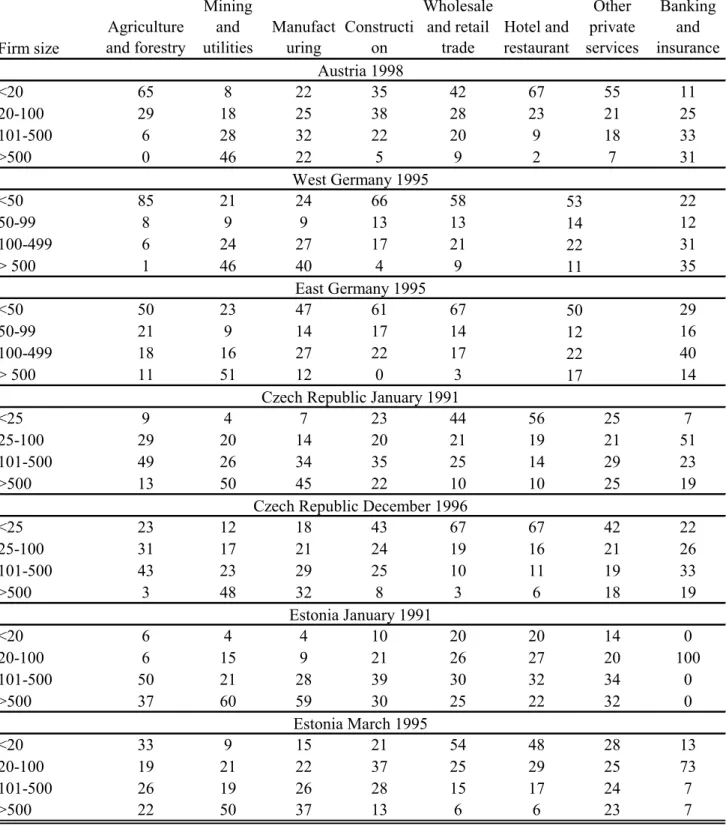
While different open economies specialize in different industries given their comparative advantage, it is more natural to expect the firm-size distribution within an industry to be similar across countries. For example, Kumar et al. (1999) analyze European data on average firm size by country and industry, and find that 63% of variation in firm size is attributable to industry identity and only 2.5% to country identity. This finding is confirmed in the top panel of Table 1, which provides a summary of the firm-size distribution over broad groups of industries from Austria in 1998 and East and West Germany in 1995. Indeed, comparing the fraction of workers employed in firms in the upper two categories (the lower two are not always strictly comparable) suggests a striking similarity of firm-size distribution in Austria and West Germany.25 These distributions provide one possible benchmark against which one can measure transition reallocation.
The bottom four panels of Table 1 contain industry firm-size distributions in the Czech Republic and Estonia at the start of transition and then again in mid-transition. The initial distortion towards large firms is clear, especially in manufacturing, construction, and
24 The only difference is the particularly severe decline of old firms in some Estonian industries (agriculture and manufacturing), resulting in the faster growth of the share of the new sector there.
25 The statistics are based on representative samples of social security records excluding the public sector. See Bender et al. (2000) and Stiglbauer et al. (2002) for descriptions of the German and Austrian data.
services. It is also equally clear that there was a substantial shift toward western distributions and this shift roughly "explains" the growth of the share of the new-sector employment within each industry. Correlating the share of the new sector on an industry employment in the Czech Republic with the corresponding employment share of firms with less than 100 workers across our 8 industries (from Section 4.1) in December 1996 results in a correlation of 0.93. For Estonia this correlation from March 1995 is lower, at 0.76, reflecting the bigger role of large new firms in Estonia compared to the Czech Republic (see Jurajda and Terrell, 2001).
4. 3 Demographic Reallocation
Given the differences in the transition paths of our two countries, it is natural to ask whether there are differences in the demographic composition of the sectoral reallocation. In Figure 4 we plot the share that each demographic group (in terms of gender, age, and education) represents out of total employment (SHARE), and the fraction that new sector jobs represent out of all jobs for each demographic group (NEW). The remarkable finding is the similarity in patterns across the two countries. The young, the better educated and males are progressively getting the new jobs in transition. And, despite the different job destruction policies, the different time pattern of job creation in the new sector, or the differences in cross-industry flows, the demographic composition of the old-new reallocation is virtually identical. Again, as with the share of the new sector on industry employment, there are striking similarities in the transition process for the two countries at different levels of development, facing different extents of misallocation and different macroeconomic shocks.
4.4 "Quality" of New Jobs
We are interested in the productivity of the new jobs and its potential difference across our two countries. But since we do not have direct data on productivity, we use two indirect approaches to learn about it. First, the industry estimates of job reallocation allow us to ask about the relationship between the growth of start-ups and GDP growth. Here, we draw on Berkowitz and DeJong (in press) who correlate across Russian regions the GDP growth and the number of small-scale enterprises—a measure similar to our JC rate in the new sector. They find a strong positive correlation between the number of small enterprises and
17
growth using an OLS regression. Furthermore, they are able to instrument for the number of small enterprises, and their two-stage-least-squares (2SLS) estimate confirms the OLS effect.26
While we construct estimates of Estonian annual job creation for a number of industries from 1992 until 1994, Estonian GDP level by industry is only available since 1993, allowing us to only work with GDP growth and JC rates from 1994 (transition year 2). These data are plotted in Figure 5a, and indicate a strong positive correlation between job reallocation and GDP growth.27 Next, we compare the Estonian graph with the relationship between GDP growth and JC rates in the Czech transition year 2. Figure 5b again suggests a positive correlation, even higher than in Estonia during the same year of transition.28 While the dispersion in JC rates is similar across countries, the variation in Czech industry GDP growth rates is much wider.29 Of course, these are not causal relationships, as both JC rate and GDP growth rate can be higher in an industry hit by a positive shock. However, Berkowitz and DeJong (in press) suggest that at least in Russia, the OLS effects are similar to those of 2SLS.30
Another way to evaluate the increases in productivity from the new sector jobs is to calculate the total wage bill by sector. This measure reweights aggregate employment counts of Figure 1 in terms of "effective" output and captures employment losses as well as gains. Weighting employment by wages increases the speed of Czech new-sector growth: a higher total wage bill is paid out in start-up firms in mid 1994, whereas higher employment was only achieved in 1996. Using the wage-bill measure, the Estonian new sector again rises as in the Czech Republic, but the old sector does not lose much of its 1993 position so
26 They exclude regional education levels, initial income, reformist voting, and privatization indicators and they successfully test these restrictions. Their first-stage regression attains a high R2 of 0.82.
27 We excluded Estonian finance due to an imprecise JC estimate. We always exclude the public sector. 28 Czech 1993 GDP growth rates are available for 8 grouped industries: (1) Agriculture, (2) Manufacturing, Mining and Utilities, (3) Construction, (4) Trade, Restaurant and Hotel, (5) Transport and Communication, (6) Finance, (7) Business Services, and (8) Other Personal Services. We exclude (1) as an outlier.
29 When we run OLS regressions of industry-specific GDP growth in year 2 on both JD and JC rates, the JC rate coefficient is significant in both countries and larger in the Czech Republic (1.60 as opposed to 0.62). The JD rate coefficient is negative and similar across countries (-0.73 and -0.56 for Czech and Estonian regression respectively), although only statistically significant in Estonia.
30 To control for industry-specific time-constant shocks we use the time dimension of our Czech data and estimate an OLS regression of GDP growth rates across our 7 industries in 1993 and 1996 on the
corresponding JC and JD rates as well as on a set of industry and year fixed effects (we work with 5 degrees of freedom). Both job rate coefficients are large and positive (4.44 for the JC rate, and 7.58 for the JD rate) suggesting a positive effect on output of both start-up of new jobs and scrapping of old jobs. We obtain similar effects when using the GDP-per-employee growth rate. However, the estimated coefficients are substantially smaller and insignificant when we use 1995 or 1994 data.
that the intersection of old and new wage bills occurs by the end of 1995 – similar to the simple employment counts. Hence, our data imply that the wage bill paid out in the new firms surpasses the old-sector wage bill by about 3 to 4 years under both transition regimes.31
In both countries, we find a strong positive correlation between JC rates and GDP growth and a similar increase in the new-sector wage bill. Still, one might suspect that some of the job creation in Estonia is of low quality. Job creation (as a rate of total employment) in early transition Estonia is substantial; it is larger than job creation in the Czech Republic. However, it occurs in the context of drastic scrapping of old large firms and in the presence of minimal unemployment insurance and social benefits. We therefore ask if and to what extent some of the Estonian new jobs pay very low wages.
First, in Figure 6 we plot the fraction of employment in the new sector with wages below the 20th percentile of the wage distribution in the whole economy. (Unfortunately, in Estonia wage information is only usable since the introduction of the stable Estonian currency in late 1992.) We see that this fraction of low-wage jobs is indeed higher in Estonia after the peak of job destruction there, reaching almost 22% versus about 18% in the Czech Republic in the same year of transition. In both countries the share is much less in the first 18 months of transition; then it seems to level off. Nevertheless, Estonia maintains a share above 20% whereas the Czech Republic’s average share is slightly below 20%.
Second, we consider the large difference between replacement ratios of the unemployment insurance system in the two countries and ask which Estonian new-sector jobs are (at the start of employment) paying less than 60% (the Czech replacement ratio) of the wage in the previous employment. In 1992-1995, this fraction is between 0.05 and 0.06 in Estonia as compared to 0.02 to 0.035 in the Czech Republic. We thus conclude that while there is more low-wage new-sector employment in Estonia than in the Czech Republic, the extent of this phenomenon is surprisingly small given the near absence of unemployment insurance during early Estonian transition. The growth of productive new jobs in Estonia appears as real as what we see in Czech lands.
31 It is interesting to note that there was an enormous growth of dollar-denominated wage bills in the sample
period. The exchange rates were stable in both countries, while in the Czech Republic the local-currency-denominated nominal wage bill of January 1991 doubled by the end of 1996. The comparable Estonian wage bill of January 1993 more than doubled before the end of 1994.
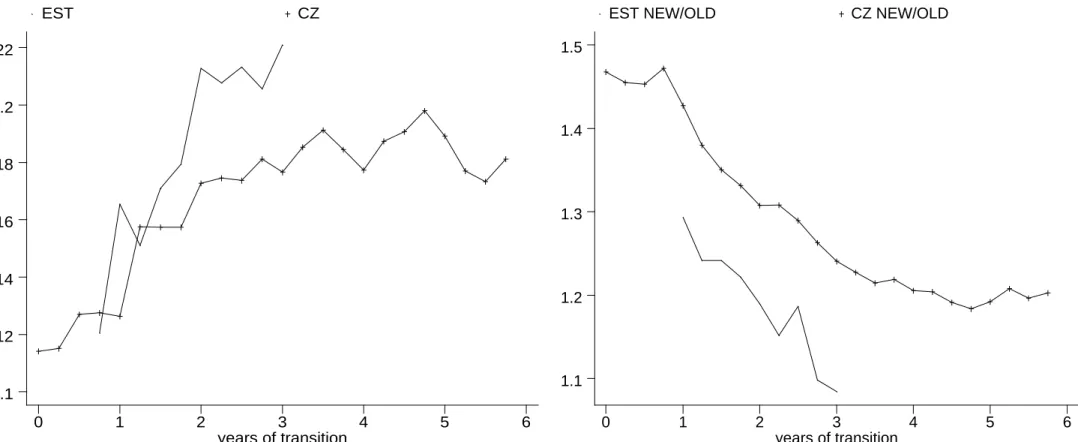
19 4.5 Reallocation and Wages
Much of the Czech transition reallocation occurred as voluntary worker moves from old to new firms (Jurajda and Terrell, 2001), which suggests an important role for new-old wage differentials. Our data contain representative information not only on the distribution of jobs but also on the corresponding wages (starting in late 1992 in Estonia). Comparing the relative wage level in the new sector to that in the old sector in Figure 6 reveals a similar pattern in both countries: The average wage in the new sector starts out substantially higher, but the gap gradually diminishes.
While the pattern is similar, the ratio of the average wages in the new to the old sector is always higher in the Czech transition, consistent with our expectations. The voluntary movement (and adequate unemployment benefits) allowed for more job search and better job matches in the Czech Republic; alternatively, employers in the Czech new sector had to offer higher wages to attract workers from the old jobs, which were slow to close down.32 Munich et al. (2001) examine the Czech Republic and study the wage change between 1989 and 1996 for workers employed at both time moments, where wage growth is explained by the type of move across new and old sectors. They find that, indeed, quits give the largest gain – approximately 9 percent higher wages than the average person who was laid off.
While we have an intuition for why the wage gap is larger in the Czech Republic, it is less clear why the initial wage premium is so large and why it gradually diminishes over the course of transition. One possible explanation for the markup has to do with sectoral differences in the productive characteristics of workers. Second, the large initial markup can be due to a self-selection process where those with high benefits from moving to a start-up do so first. Alternatively, one can think of this wage markup as a risk premium or as an efficiency wage that induces harder work in new jobs. Finally, it may arise from the rent received from first-mover advantage (as the new firms entered unfilled niches), which shrank over time as more firms entered and competition ensued.Below, we explore some of these hypotheses.
First, we study the gap in simple pooled cross-sectional regressions including a
32 New firms in the Castanheira and Roland (2000) model offer higher wages in order to pull workers from old firms facing soft budget constraints. However, it is not clear why the wage premium should be so large.
dummy for new sector job and controlling for demographic characteristics. The top panel of Table 2 shows that conditioning on worker characteristics (and imposing the same wage structure in the new and old sector), the OLS new-sector wage premium from transition year 1 is almost 50% smaller in both countries when compared to the unconditional premium of Figure 7. Still, the initial gap remains economically significant and follows a pattern similar to that of Figure 7: declining during transition in both countries. It is also the case that the premium is higher in the Czech Republic than in Estonia. Three years into transition, the Czech new wage premium is still over ten percent, while there is no significant difference in Estonian wages across the new and old sectors after correcting for observable worker characteristics.33
Second, if workers with larger gains from working in the new sector choose to move there, the new-sector dummy is endogenous. One simple way to get at the size of the self-selection effect is to instrument the new-sector dummy using a binary indicator for the worker having been laid off from the old sector in the past.34 Most of the old-firm layoffs are mass layoffs or plant closures where one would expect workers across the entire spectrum of unobservables to be laid off. That is: our instrument is valid to the extent that low-quality workers (conditional on observable characteristics) are not targeted in mass layoffs. The 2SLS results should be viewed as a tentative first-step attack at a complicated issue.
The new-sector wage premium based on the IV estimator, which attempts to filter out the self-selection part of the premium, implies that at the start of transition there is no difference between wages of a randomly selected worker placed in either the new or the old sector.35 Later in transition, the effect of working in a new firm on the wages of a randomly selected worker actually becomes negative and large, especially in Estonia. Taking the results of this simple IV estimator at face value, once the niches left open by central planning are filled, moving a random worker from the old to the new sector has a substantial negative effect on wages. Yet, the OLS effects are never negative, suggesting that self-selection (moving according to one's comparative advantage) is a powerful force of transition reallocation. Self-selection on gains from working in the new sector appears
33 In both countries, the OLS gap increases in size if we also condition on firm size. 34 This indicator is a highly significant predictor of being employed in a new firm.
21
as a driving force of wage gains in transition and, to the extent that wages reflect productivity, of macroeconomic growth.
Why does the gap close over time? This could be caused by restructuring and productivity gains in the old sector (as in Aghion and Blanchard, 1994) or by competition for workers and increased effort in the old sector (as in Roland and Sekkat, 2000). If the initial wage premium has to do with self-selection, its positive effects evaporate over time, especially in Estonia. Alternatively, the risk rent of working for the new sector goes away with transition, or competition drives niche rents-and hence wages-down in the new sector.
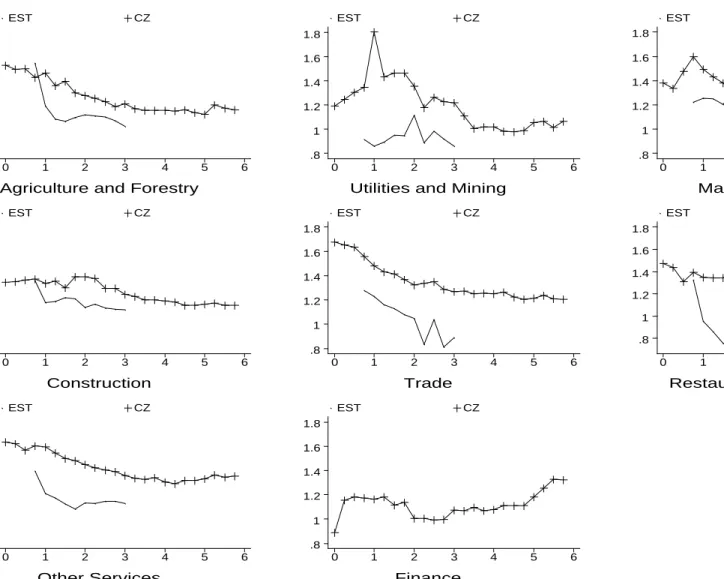
In Figure 3 we saw a differential growth of the new sector within industries as well as differential growth of total industry employment. Below we ask whether those differences are reflected in relative wages; we use wage information to shed light on the nature of job growth in new small firms across industries. Figure 8 shows the relative average wage of the new to the old sector in each industry in both countries. (We drop Estonian finance because there were too few wages reported; the wage level appears about twice as high in Estonian new-sector finance compared to old-sector.)
While there are differences across industries, average wage differences between the new and old sectors are apparently not related to the varying share of new jobs within an industry—the industry-specific wage pattern typically does not diverge much from the average country one. The bottom panel of Table 2 confirms this unconditional view with OLS new-sector wage effects while controlling for workers' productive characteristics. There appear to be no systematic differences in the estimated new-job wage effect linked to the evolution of industry size or the growth of the new sector within each industry. Instead, wages in the new sector are apparently set in comparison to wages in the old sector in the same industry, no matter whether that industry is growing or shrinking. This
appears consistent with the efficiency wage explanation for the new-old wage premium. 5. Conclusions
This paper offers stylized facts on the type and sources of start-up job growth in early transition using data from two countries. In particular, we identify patterns of job growth in terms of niches left from central planning. Further, we compare job creation under two different transition paths: one involving drastic job destruction and high unemployment,
the other based on gradual scrapping of old firms. Of course, differences or similarities in outcomes across our two countries can be due to differences in both policies and underlying fundamentals of each economy. While we do not attempt to create counterfactual evidence, we believe a careful descriptive analysis of the two different paths of transition is useful given our lack of knowledge about small new sector growth.
Given the amount of industrial reallocation needed in transition economies that over-employed resources in agriculture and manufacturing, we were surprised to find job growth within industries to be quantitatively more important than job growth due to across-industry reallocation. Furthermore, the industrial composition of start-ups is strikingly similar in the two countries, especially given large differences in capital constraints. We offer convergence to western industry firm-size distributions as an explanation.
We also document regularities in wage evolution across new and old firms and suggest that the new jobs were significant contributors to output (as reflected by wage level), rather than stop gap measures to relieve unemployment. New-sector job creation is strongly correlated with GDP growth rates. However, the relationship is weaker in Estonia than in the Czech Republic and a slightly larger fraction of jobs are of poorer quality (very low wage) in Estonia. This was expected, knowing the differences in the unemployment benefits and access to capital in these two countries.
There is strong correspondence in the size and trend of the wage gap between the new and old sectors in each country. We expected, and found, a larger wage differential in the Czech Republic, where most reallocation was driven by quits. We show that the early-transition new-old wage differentials remain in both countries after controlling for selectivity bias by using mass layoffs as an instrument for moving to the new firms.
Overall, we are struck by the similarities between the two countries in the structure of new-to-old reallocation in terms of industries, demographics, or wages. It appears as if the difference in macroeconomic policies was chiefly manifested on the aggregate level of unemployment and wages, but not in the composition of the new sector.
On the methodological front, our analysis illustrates the usefulness of inexpensive household data for studying structural job change. Not only does worker-level data allow for estimation of job reallocation patterns, one can also use individual wage information to learn about the nature of job reallocation, both at the micro and aggregate levels.
23
In future research it would be ideal to combine similar data from a number of countries to estimate the effects various policies have on the speed and nature of job reallocation and to identify differences in the reallocation patterns with potential consequences for long-term growth. The path of early transition may affect long run growth through selection among multiple equilibria as in Berkowitz and Cooper (1997) or through sclerosis effects from insufficient reallocation as in Caballero and Hammour (2000).
References
Aghion, Philippe and Olivier Blanchard (1994) "On the Speedof Transition in Central Europe," NBER Macroeconomics Annual, pp. 283-320.
Bender, Stefan, Haas, Anette, and Christoph Klose (2000) "IAB Employment Subsample 1 975-1995 Opportunities for Analysis Provided by the Anonymised Subsample," IZA Discussion Paper No. 117.
Berkowitz, D. and D.J. Cooper (1997) "Start-Ups and Transition," William Davidson Institute Working Paper Number 84.
Berkowitz, D. and D.N. DeJong (in press) "Policy Reform and Growth in Post-Soviet Russia," forthcoming in European Economic Review.
Bilsen, Valentin and Jozef Konings (1998) "Job Creation, Job Destruction and Growth of Newly Established, Privatized and State-owned Enterprises in Transition Economies: Survey Evidence from Romania, Bulgaria and Hungary," Journal of Comparative Economics, 26:
429-445.
Boeri, Tito and Katherine Terrell (2002) "Institutional Determinants of Labor Reallocation in Transition," Journal of Economic Perspectives, 16(1): 51-76.
Bratkowski, A., I. Grosfeld, , and J. Rostowski (1999) "Investment and Finance in De Novo Private Firms: Empirical Results from the Czech Republic, Hungary and Poland," William
Davidson Institute Working Paper Number 236.
Caballero, Ricardo J. and Mohamad L. Hammour (2000) "Creative Destruction and Development: Institutions, Crises, and Restructuring, " NBER Working Paper No. 7849.
Castanheira, M. and Gerard Roland (2000) “The Optimal Speed of Transition: A General Equilibrium Analysis,” International Economic Review, 41(1): 219-39.
Davis, Steven J. and John C. Haltiwanger (1992) “Gross Job Creation, Gross Job Destruction and Employment Reallocation,” Quarterly Journal of Economics, 107(3): 819-863.
Eamets, Raul and Kaia Philips (1998) "Estonian Labour Market and Labour Policy: Country Study presented to the International Labour Organization," University of Tartu.
Eamets, Raul (2001) "Reallocation of Labour During Transition: Disequilibrium and Policy Issues, the Case of Estonia." Ph.D. Dissertation, Tartu University.
Earle, John and Zuzana Sakova (2000) “Business Start-ups or Disguised Unemployment? Evidence on the character of self-employment from transition economies.” Labour Economics, 7 (5): 575-601.
Faggio, Giulia and Josef Konings (2001) "Job Creation, Job Destruction, and Employment Growth in Transition Countries in the 90s," IZA Discussion Paper No. 242.
Haltiwanger, John C. and Milan Vodopivec (1999) "Gross Worker and Job Flows in a Transition Economy: An Analysis of Estonia," World Bank Policy Research Working Paper 2082, March.
25
Johnson, Simon, John McMillan and Christopher Woodruff (2000) “Entrepreneurs and the Ordering of Institutional Reform: Poland, Slovakia, Romania, Russia and Ukraine Compared,” Economics of Transition, 8(1): 1-36.
Jurajda, Stepan and Katherine Terrell (2001) "What Drives the Speed of Job Reallocation during Episodes of Massive Adjustment?" CERGE-EI Working Paper No. 170 and William Davidson Institute Working Paper No. 432.
Konings, Josef, Hartmut Lehmann and Mark Shaffer (1996) "Job Creation and Job Destruction in a Transition Economy: Ownership, Firm Size and Gross Job Flows in Polish Manufacturing, 1988-1991," Labour Economics, 3: 299-317.
Kornai, J. (1990) The road to a free economy shifting from a Socialist system: The example of Hungary, W.W. Norton, New York.
Kumar, Krishna B., Rajan, Raghuram G., and Luigi Zingales (1999) "What Determines the Firm Size?" NBER Working Paper No. 7208.
Lízal, Lubomir and Jan Svejnar (2000) "Financial Conditions and Investment during the Transition: Evidence from Czech Firms," CERGE-EI Working Paper No. 153.
McMillan, John and Christopher Woodruff (2001) “Entrepreneurs in Economic Reform,” Stanford University Business School unpublished paper, July 26.
Mitra, Pradeep et al. (2000) "Transition After a Decade: Lessons and Agenda for Policy," unpublished World Bank Paper, November.
Munich, D., Svejnar, J. and K. Terrell (2002) "The Returns to Job Mobility during the Transition: Evidence from Czech Retrospective Data," mimeo, William Davidson Institute.
Noorkôiv, Rivo, Orazem, Peter F., Puur, Allan, & Vodopivec, Milan (1998), “Employment and Wage Dynamics in Estonia, 1989-95,” Economics of Transition, 6 (2): 481-503.
Richter, Andrea and Mark E. Shaffer (1996) "Growth, Investment, and Newly-established Firms in Russian Manufacturing," in: Simon Commander, Qimiao Fan and Mark E. Shaffer, eds.,
Enterprise restructuring and economic policy in Russia. EDI, World Bank, Washington,
D.C.
Roland, Gerard (2000) Politics, Markets and Firms: Transition and Economics. The MIT Press:
Cambridge, Mass.
Roland, Gerard and Khalid Sekkat (2000) "Managerial Career Concerns, Privatization and Restructuring in Transition Economies," European Economic Review, 44(10): 1857-72.
Sorm, Vit and Katherine Terrell (2000) “Sectoral Restructuring and Labor Mobility: A Comparative Look at the Czech Republic,” Journal of Comparative Economics,
September, 28: 431-458.
Stiglbauer, Alfred M., Stahl, Florian, Winter-Ebmer, Rudolf, and Josef Zweimüller (2002) "Job Creation and Job Destruction in a Regulated Labor Market: The Case of Austria," mimeo, University of Linz, Austria.
Svejnar, Jan (1999) “Labor Markets in the Transitional Central and East European Economies,” Chapter 42 in Orley Ashenfelter and David Card (eds.) Handbook of Labor Economics,
Tables Firm size Agriculture and forestry Mining and utilities Manufact uring Constructi on Wholesale and retail trade Hotel and restaurant Other private services Banking and insurance <20 65 8 22 35 42 67 55 11 20-100 29 18 25 38 28 23 21 25 101-500 6 28 32 22 20 9 18 33 >500 0 46 22 5 9 2 7 31 <50 85 21 24 66 58 22 50-99 8 9 9 13 13 12 100-499 6 24 27 17 21 31 > 500 1 46 40 4 9 35 <50 50 23 47 61 67 29 50-99 21 9 14 17 14 16 100-499 18 16 27 22 17 40 > 500 11 51 12 0 3 14 <25 9 4 7 23 44 56 25 7 25-100 29 20 14 20 21 19 21 51 101-500 49 26 34 35 25 14 29 23 >500 13 50 45 22 10 10 25 19 <25 23 12 18 43 67 67 42 22 25-100 31 17 21 24 19 16 21 26 101-500 43 23 29 25 10 11 19 33 >500 3 48 32 8 3 6 18 19 <20 6 4 4 10 20 20 14 0 20-100 6 15 9 21 26 27 20 100 101-500 50 21 28 39 30 32 34 0 >500 37 60 59 30 25 22 32 0 <20 33 9 15 21 54 48 28 13 20-100 19 21 22 37 25 29 25 73 101-500 26 19 26 28 15 17 24 7 >500 22 50 37 13 6 6 23 7
Tab. 1: Industry Firm-size Distribution
Estonia January 1991 Estonia March 1995 22 17 22 14 11 12 50
Czech Republic December 1996 East Germany 1995 West Germany 1995
Austria 1998
Czech Republic January 1991
27
Tab. 2: New-job Wage Premium
transition year 1 3 6 1 3 OLS 0.24 * 0.132 * 0.104 * 0.17 * -0.037 (0.023) (0.016) (0.016) (0.025) (0.024) R2 0.29 0.32 0.3 0.11 0.14 IV -0.005 -0.069 -0.173 * -0.025 -0.521 * (0.118) (0.101) (0.104) (0.081) (0.103) R2 0.21 0.28 0.2 0.1 0.04 N 2435 2639 2681 3963 3993 OLS in
Agriculture and Forestry 0.24 * -0.069 -0.069 0.122 * -0.046 (0.023) (0.101) (0.101) (0.068) (0.068)
R2 0.32 0.29 0.32 0.06 0.1
N 234 184 147 877 620
Manufacturing, Mining & Util. 0.214 * 0.099 * 0.077 * 0.13 * -0.077 * (0.051) (0.03) (0.026) (0.046) (0.037) R2 0.29 0.35 0.34 0.11 0.16 N 1075 1094 1084 1327 1282 Construction 0.2 * 0.151* 0.104 * 0.105 0.042 (0.058) (0.044) (0.06) (0.071) (0.098) R2 0.17 0.17 0.14 0.12 0.1 N 243 272 263 370 356 Trade 0.2 * 0.2 * 0.066 0.196 * -0.156 * (0.058) (0.058) (0.054) (0.057) (0.066) R2 0.31 0.34 0.31 0.16 0.14 N 293 356 413 554 727
Services , Rest. and Hotel 0.288 * 0.162 * 0.119 * 0.114 * -0.063 (0.052) (0.042) (0.042) (0.059) (0.049)
R2 0.32 0.31 0.32 0.13 0.22
N 362 468 481 728 871
Estonia
Notes: *denotes significance at 10% level with robust standard errors. All regressions control for age, gender, and education type. Public sector is excluded as well as observations with missing values of the regressors. Data taken from January of each year.
Figures
Fig. 1: Aggregate Evolution of Employment and Job Reallocation
Czech Republic
Employment Shares and Total Employment
OLD PUB NEW TOT -3 -2 -1 0 1 2 3 4 5 6 0 .1 .2 .3 .4 .5 .6 .7 .8 .9 1 1.1 Czech Republic
Job Reallocation Relative to Total Employmen JD OLD JC NEW -3 -2 -1 0 1 2 3 4 5 0 .02 .04 .06 .08 .1 .12 .14 Estonia
Employment Shares and Total Employment
OLD PUB NEW TOT -3 -2 -1 0 1 2 3 4 5 6 0 .1 .2 .3 .4 .5 .6 .7 .8 .9 1 1.1 Estonia
Job Reallocation Relative to Total Employmen JD OLD JC NEW -3 -2 -1 0 1 2 3 4 5 0 .02 .04 .06 .08 .1 .12 .14
Fig. 2: Job Creation (JC) and Destruction (JD) by Industry
Agriculture and ForestryEST JD EST JC CZ JD CZ JC -3 -2 -1 0 1 2 3 4 5 6 0 .1 .2 .3 .4
Utilities and Mining
EST JD EST JC CZ JD CZ JC -3 -2 -1 0 1 2 3 4 5 6 0 .1 .2 .3 .4 Manufacturing EST JD EST JC CZ JD CZ JC -3 -2 -1 0 1 2 3 4 5 6 0 .1 .2 .3 .4 Construction EST JD EST JC CZ JD CZ JC -3 -2 -1 0 1 2 3 4 5 6 0 .1 .2 .3 .4 Trade EST JD EST JC CZ JD CZ JC -3 -2 -1 0 1 2 3 4 5 6 0 .1 .2 .3 .4
Restaurant and Hotel
EST JD EST JC CZ JD CZ JC -3 -2 -1 0 1 2 3 4 5 6 0 .1 .2 .3 .4 Other Services EST JD EST JC CZ JD CZ JC -3 -2 -1 0 1 2 3 4 5 6 0 .1 .2 .3 .4 Finance EST JD EST JC CZ JD CZ JC -3 -2 -1 0 1 2 3 4 5 6 0 .1 .2 .3 .4
Fig. 3: Industry Employment Change and Fraction New
Agriculture and ForestryEST SIZE EST NEW
CZ SIZE CZ NEW -3 -2 -1 0 1 2 3 4 5 6 -.4 -.2 0 .2 .4
Utilities and Mining
EST SIZE EST NEW
CZ SIZE CZ NEW -3 -2 -1 0 1 2 3 4 5 6 -.2 0 .2 Manufacturing
EST SIZE EST NEW
CZ SIZE CZ NEW -3 -2 -1 0 1 2 3 4 5 6 -.2 0 .2 .4 Construction
EST SIZE EST NEW
CZ SIZE CZ NEW -3 -2 -1 0 1 2 3 4 5 6 -.5 0 .5 1 Trade
EST SIZE EST NEW
CZ SIZE CZ NEW -3 -2 -1 0 1 2 3 4 5 6 -.5 0 .5 1
Restaurant and Hotel
EST SIZE EST NEW
CZ SIZE CZ NEW -3 -2 -1 0 1 2 3 4 5 6 -.5 0 .5 1 Other Services
EST SIZE EST NEW
CZ SIZE CZ NEW -3 -2 -1 0 1 2 3 4 5 6 0 .2 .4 .6 Finance
EST SIZE EST NEW
CZ SIZE CZ NEW -3 -2 -1 0 1 2 3 4 5 6 0 .5 1 1.5
31
Fig. 4: Demographic Composition of Employment
SHARE of Group on Total Employment and Fraction of NEW by Group
Males
EST NEW EST SHARE
CZ NEW CZ SHARE -3 -2 -1 0 1 2 3 4 5 6 0 .2 .4 .6 Females
EST NEW EST SHARE
CZ NEW CZ SHARE -3 -2 -1 0 1 2 3 4 5 6 0 .2 .4 .6 Age<25
EST NEW EST SHARE
CZ NEW CZ SHARE -3 -2 -1 0 1 2 3 4 5 6 0 .2 .4 .6 25<Age<35
EST NEW EST SHARE
CZ NEW CZ SHARE -3 -2 -1 0 1 2 3 4 5 6 0 .2 .4 35<Age<45
EST NEW EST SHARE
CZ NEW CZ SHARE -3 -2 -1 0 1 2 3 4 5 6 0 .2 .4 45<Age
EST NEW EST SHARE
CZ NEW CZ SHARE -3 -2 -1 0 1 2 3 4 5 6 0 .2 .4 .6 Primary Education
EST NEW EST SHARE
CZ NEW CZ SHARE -3 -2 -1 0 1 2 3 4 5 6 0 .1 .2 .3 .4 Secondary Education
EST NEW EST SHARE
CZ NEW CZ SHARE -3 -2 -1 0 1 2 3 4 5 6 0 .2 .4 .6 .8 Tertiary Education
EST NEW EST SHARE
CZ NEW CZ SHARE -3 -2 -1 0 1 2 3 4 5 6 0 .1 .2 .3 .4
G D P growt h rat e by indust ry
Fig. 5a: Estonian Industry Growth and JC in 1994 (t=2)
JC rate by industry 0 .1 .2 .3 .4 -.1 -.05 0 .05 Agricult Mining Manuf Util Constr Trade Restaur Transpor BusServ PersServ GD P gr ow th r a te by i ndust ry
Fig. 5b: Czech Industry Growth and JC in 1993 (t=2)
JC rate by industry 0 .05 .1 .15 .2 -.2 -.1 0 .1 .2 Manuf/Mi Constr Trade/Re Transpor Finance BusServ PersServ
33
Fig. 6: % of New Wages<Economy-wide 20th Percentile
years of transition EST CZ 0 1 2 3 4 5 6 .1 .12 .14 .16 .18 .2 .22
Fig. 7: Relative Average Wages
years of transition
EST NEW/OLD CZ NEW/OLD
0 1 2 3 4 5 6 1.1 1.2 1.3 1.4 1.5
Fig. 8: Relative Average Wages by Industry
transition time
Agriculture and Forestry
EST CZ 0 1 2 3 4 5 6 .8 1 1.2 1.4 1.6 1.8
Utilities and Mining
EST CZ 0 1 2 3 4 5 6 .8 1 1.2 1.4 1.6 1.8 Manufacturing EST CZ 0 1 2 3 4 5 6 .8 1 1.2 1.4 1.6 1.8 Construction EST CZ 0 1 2 3 4 5 6 .8 1 1.2 1.4 1.6 1.8 Trade EST CZ 0 1 2 3 4 5 6 .8 1 1.2 1.4 1.6 1.8
Restaurant and Hotel
EST CZ 0 1 2 3 4 5 6 .8 1 1.2 1.4 1.6 1.8 Other Services EST CZ 0 1 2 3 4 5 6 .8 1 1.2 1.4 1.6 1.8 Finance EST CZ 0 1 2 3 4 5 6 .8 1 1.2 1.4 1.6 1.8