LNG Project Valuation with Financial Leasing Contracts *
ByMagne Emhjellen** , Kjell Løvås*** and Petter Osmundsen Abstract
Financial leasing is prevalent in LNG projects. Actually, in many LNG infrastructure projects, leasing is the only option for oil companies. A common approach in such settings is to treat financial leasing costs as operating cost and discount with the firm s weighted average cost of capital (WACC). This method, which is applied on huge investments in LNG infrastructure, overstates project profitability and may lead to overinvestment. Since financial leasing
payments are contractual and deterministic, a separate cash flow valuation is called for, with a lower discount rate for financial leasing costs. We present a correct method for calculating the net present value of projects when there are no investment alternatives, i.e., when leasing is the only option. Finally, we demonstrate through a real LNG project example, the magnitude in the project net present value error with the current valuation method.
Keywords: Project Valuation, Capital Budgeting, Financial leasing, Financial cost. Jel.class.no.: G31, G32
Magne Emhjellen is currently a Senior Commercial Advisor in the Norwegian oil company Petoro AS. He came from the position as Associate Professor, Department of Economics and Business Administration at the
University of Stavanger (2000-2002). In the period 1988-1990 and 1992-2000 he held various commercial and management positions in Statoil AS (Norwegian oil company). In the period 1990-1992 he was a financial analyst in Orkla Finance AS. He holds a PhD degree in economics from the University of New South Wales, Sydney Australia,1999.
Kjell Løvås holds a Master in business administration from the Norwegian School of Economics and Business Administration (NHH) in Bergen, joined Statoil in 1986. He is now working as an Advisor in Corporate Planning and Analysis. His area of responsibilities is economic analysis and profitability methodology on the Group level. Before he joined the Corporate staff in 1995 he had a broad experience from the E&P business both on the NCS and on international projects.
Petter Osmundsen is Professor of Petroleum Economics at University of Stavanger, where he is head of the Section of Petroleum Economics in the Department of Industrial Economics and Risk Management. He has a Ph.D. from the Norwegian School of Economics and Business Administration (NHH) in Bergen. In 1992/93 he was a Research Fellow at the Massachusetts Institute of Technology. He has previously held positions as Associate Professor at NHH and Research Manager at the NHH affiliated Institute for Research in Economics and Business Administration (SNF).
* We would like to express our appreciation to Chris Alaouze for helpful comments. Address of correspondence: Petter Osmundsen, University of Stavanger, Department for Industrial Economics, 4068 Stavanger, Norway. Tel: (47) 51 83 15 68, Email: [email protected], Internet:
http://www5.uis.no/kompetansekatalog/CV.aspx?ID=08643&sprak=BOKMAL
** Magne Emhjellen, Senior Advisor, Petoro AS, PO Box 300 Sentrum, 4002 Stavanger, Norway. Tel: (47) 51 50 20 55, Fax: (47) 51 50 20, E-mail: [email protected]
*** Kjell Løvås, Statoil ASA, 4033 Forus, Norway, Tel:(47) 911 87 572, E-mail: [email protected]
1. Introduction
The textbook method for the lease or buy decision is to estimate the expected cost cash flow after tax for the two cost alternatives and calculate the present value of these using the after-tax borrowing rate in discounting. The lowest cost option is the preferred choice. However, in some cases there is no investment alternative for the financial asset to be leased. These are situations where there are only offers for leasing an asset, there is no available development time for investing in the asset, or management does not consider owning this type of asset.
In such cases the textbook method may not be used since there is no investment option. Consequently the calculation of the net present value of the project for a decision (and comparison to other projects) must include the leasing contract. This inclusion of the financial leasing cost must be undertaken correctly in order to estimate a correct project net present value. To allocate investment funds optimal within petroleum companies, it is necessary to apply consistent valuation methods.
We find the common practice of treating leasing payments as operating costs and applying the WACC does not reflect the actual risk structure, as leasing payments often are fixed by contracts for up to twenty years. The current practice, which applies to huge
investments in LNG infrastructure, overrates profitability. It may thus lead to overinvestment. Also, there is a potential problem of sub-optimisation in the companies internal capital allocation process. Project managers that would like to achieve support for their project, may have an incentive to opt for leasing, as this would give an undue increase in NPV with the current evaluation methods. Thus, there may be distortions in the decision to buy or lease, in the overall investment decision, and in the internal allocation of investment funds. Most critical this would be in a critical bidding situation where wrongful valuation could induce too aggressive bidding. A real world example of such distortions is provided in Section 8.
2. Introduction to Liquefied Natural Gas projects and leasing
The liquefied natural gas (LNG) technology is able to utilise marine transportation, and LNG is like oil slowly becoming an internationally traded commodity. The LNG project chain consists of four links (occasionally five); 1) field development, in some cases 2) a pipeline to the coast, 3) the liquefaction facility, 4) tanker transportation, and 5) the receipt/regasification terminal.1 Each element is highly capital intensive and front-end loaded. Field development will in many cases only represent a quarter of the overall capital expenditure.
Financial leasing is prevalent in links 2) to 5). There are several reasons why the international oil companies choose leasing. There has been a trend towards a narrowing of the strategic core. Oil companies engage in exploration, development and distribution of
petroleum, and make active use of outsourcing in situations where there exist a functioning marked for services. Leasing may also be beneficial if the infrastructure lasts longer than the estimated production time of the reservoir. Another motive for financial leasing is to reduce the capital employed, to improve return on average capital employed (RoACE). Investment banks benchmark international oil companies according to their RoACE, and use this
indicator for valuation. For a given year, UBS Warburg identifies a clear relationship between RoACE and the EV/DACF multiple, and conclude:
Figure 1: RoACE and EV/DACF for Major International Oil Companies 2003 0 5 10 15 20 25 Amerada Hess Hydro Repsol YPF Marathon Oil ConocoPhillips Eni BP Occidental Statoil Royal Dutch ChevronTexaco Total Petro-Canada Exxon RoACE EV/DACF Data source: Deutsche Bank: Major Oils 2004.
Each of the stocks which we rate a Buy is trading below the average level relative to its returns. EV/DACF versus RoACE provides the key objective input into the process of setting our target prices. 2
Similar statements about valuation, multiples and return on capital are made in Deutsche Bank s publication Major Oils. For more details on valuation of oil projects and companies, see Osmundsen et. al (2006, 2007) and Emhjellen and Alaouze (2002a, 2002b).
If financial leasing were adequately adjusted for in financial valuation analyses, leasing decisions would not have any impact. It is unclear, however, if external analysts who are tracking many companies - have the necessary information and resources to do such adjustments in a consistent manner. In the numbers behind Figure 1, such adjustments have not been made. If most companies follow a strategy of leasing, thus reducing capital
employed and boosting RoACE, a deviation from this strategy by one company would harm its performance on the RoACE benchmarking.
LNG leasing arrangements often involve long term contracts with fixed payments from companies that are financially robust. Thus, one could from a separate cash flow perspective argue that the oil companies themselves could own the infrastructure, which would be the optimal solution if appropriate risk adjustments were made to this partial cash
1
flow. But if investors expect high RoACE - and implicitly a higher risk profile from oil companies (clientele effect) - it might be optimal to leave this job to specialised companies having different owners and a different return profile (lower return, lower risk). The LNG investment analyses of the oil companies should in these cases reflect the fact that the leasing payments on dedicated infrastructure represent fixed payments for some 20 years.
3. Existing literature
In reviewing the existing literature on leasing and project valuation we have found no work on project valuation where an investment alternative to the financial lease contract does not exist. Early work by Lewellen et al (1976), Brealey and Young (1980) and Ang and Peterson (1984) focus on incentives for leasing and whether debt and leasing is complements or substitutes. Recent work in this area has been provided by Sharpe and Nguyen (1995), Kang and Long (2001) and Ezzell and Vora (2001).
Sharpe and Nguyen (1995) argue that firms facing high costs of external funds can economize on the cost of funding by leasing. Kang and Long (2001) find that leasing and debt financing is substitutes and that tax position, agency cost, bankruptcy cost and asymmetric information are significant factors in predicting leasing levels. They also find results
consistent with Sharpe and Nguyen (1995) that higher levels of leasing is more likely in less profitable, risky firms with lower levels of fixed assets. Ezzell and Vora, 2001 find support for increase in lessee equity value for the tax savings hypothesis and the savings in
bankruptcy costs hypothesis of sale and leasebacks but less so for direct leases.
Other research focus on the yield/return of lease contracts (Grenadier, 1996 and Schallheim et al, 1987) and the valuation of the lease contract itself (Trigeorgis, 1996 and McConnell and Schallheim, 1983).
Grenadier (1996) presents a model for the estimation of equilibrium credit spread on leases subject to default risk. Schallheim et al (1987) examine a representative sample of
2
financial leases and find some evidence of a relationship between lease yields and the default risk of the lessee. In addition, they find the yield to be related to treasury bond yields, their proxy for the systematic risk of the leased assets residual value and the transaction and information cost associated with the lease.
Trigeorgis (1996) and McConnell and Schallheim (1983) work on the valuation of leasing contracts when different option values are present. With option values present in the contract there are added benefits to the lessee or leaser. The lease contract is no longer a strict financial lease since there are other benefits to the contract than financing only.
We complement the existing literature in the present paper by focusing on the challenges in applied valuation in situations where leasing is the only option.
4. Investment decisions with financial leasing
In this paper we present a method for calculating the net present value of a project with a financial lease contract when there is no investment alternative to leasing and the lease is a strict financial lease. There are no options in the lease contract and leasing is assumed to be a perfect substitute for debt.
Treating the financial lease as an operating cost will provide an erroneous estimate of the net present value (NPV) of the project. An alternative method for estimating a project net present value is suggested: calculating an investment equivalent from the financial lease contract and replacing the investment equivalent for the financial lease payments in the project cash flow.
The rest of the paper is organized as follows. In section 5 we demonstrate the textbook method of the lease and buy decision. In section 6 we present the difference between total capital and equity capital and the mistake of treating the financial lease as an operating cost.
Section 7 presents the method for calculating project net present values with financial leasing contracts and section 8 provides a practical LNG project example. We conclude in section 9.
5. The Textbook Approach
The textbook method for the lease or buy decision involves estimating the expected difference cash flow after-tax between leasing and buying, and discounting it using the after-tax
borrowing rate of the firm (Brealey and Myers, 2003 pp. 737-743). Thus, the present value of the cost of the leasing alternative and the invest alternative is compared using the after-tax debt financing cost of the firm. The lowest cost option is then the preferred alternative. The method assumes that the lease or buy decision is a strict finance decision. Most firms treat leasing using the textbook method (Mukherjee, 1991).
When deciding to lease an asset rather than owning it one looses the right to the depreciation amounts and gains the right to deduct the down payments from the loan. The net present value of leasing for the lessee is (Copeland and Weston, 1992, 623)
T t t d c c t c t r T T D T L I NPV 1 1 (1 ) ) 1 ( , (1)
where I is the investment, Lt is the lease payments, Dt is the depreciation amounts, Tc is the
corporate tax rate and rd is the corporate borrowing rate.
For illustration, a simple numeric example is presented. An oil firm is evaluating a new oil lease development and are faced with the option of leasing a production vessel for 6 years at a cost of 120 million USD per year or investing in the production vessel at a cost of 600 million USD. The corporate tax is 28%, and investments in the vessel may be tax
after-tax borrowing rate of 5,04% [7% x (1-0,28)]. The net present value of the financial lease for the lessee - the NPV of the differential cash flow - is then
1 . 20 07 , 0 ) 28 . 0 1 ( 1 ) 28 . 0 ( 100 ) 28 . 0 1 ( 120 600 6 1 t t NPV . (2)
Since the NPV is positive the present value of the after-tax financial lease cost is lower than the after-tax investment cost and the decision is to lease the production vessel. However, before this decision can be made the value of the project when investing must be estimated. The value of the project when investing is
T t t c t c t t WACC T D T O R I NPV 1 1 ) 1 )( ( , (3)
where Rt is revenue, Ot is operating cost and WACC is the weighted average cost of
capital. Assuming a WACC of 10% and project revenues and operating costs of 200 million and 50 million per year, respectively, the value of the project is
7 . 7 1 , 1 ) 28 . 0 ( 100 ) 28 . 0 1 )( 50 200 ( 600 6 1 t t NPV . (4)
Based on investing with the normal cost of financing reflected in the WACC the project should be rejected. However, with the cheaper than normal financing provided by the financial leasing offer the project NPV is positive and the project should be accepted (-7.7+20.1=12.4).3
3
The application of the textbook approach requires that there exist an investment alternative for the financial lease object in question and that the investment cost is known. In many practical situations this is not the case. There are situations where there are only offers for leasing the asset or there is no development time for an investment alternative in order for the project to be realised. In other cases management does not consider owning this type of asset and the true cost of investing is not known. In such cases the calculation of the net present value of the project must incorporate the cost of the financial lease before an acceptance or rejection of the project.
6. Total capital, equity capital and debt capital
WACC consists of the cost of equity obtained from the capital asset pricing model (CAPM) (Sharpe, 1964) and the cost of debt, and is a weighted average of the two based on the firm s capital structure. WACC is therefore applicable only in discounting the total capital cash flow.
In table I the total capital cash flow, debt capital cash flow and equity capital cash flow is presented.
Table I: Total Capital-, Debt Capital- and Equity Capital cash flow
Total capital cash flow Debt capital cash flow Equity capital cash flow
+Revenues +Revenues
-Investment -Investment
-Operating cost -Operating cost
-Tax payments -Tax payments
-Loan +Loan
+Interest -Interest
Financial lease payments are for all practical purposes equivalent with a debt cash flow. From the table is clear that introducing leasing in the total capital cash flow will change it to an equity capital cash flow. The two cash flows have different systematic risk because the inclusion of debt in the equity cash flow amplifies the equity cash flow risk (Copeland and Weston, 1992, pp. 458-459). The WACC may therefore not be used in calculating project value when the financial lease cost is included in the cash flow stream as an operating cost (i.e. in effect increasing leverage). In addition, including the financial lease in the project cash flow will cause the debt level to change during the life of the project. The use of the WACC in discounting project cash flow requires a constant debt ratio (Miles and Ezzell, 1980). Different debt levels during the life of the project are not consistent with a constant WACC. Consequently, a project NPV estimate using WACC is incorrect.
Our example will exemplify the project valuation error of treating the financial lease as an operating cost. In equation (5) the financial lease payments are included as operating cost in the project cash flow stream.
T t t d c c t t t r T T L O R NPV 1 1 (1 ) ) 1 )( ( . (5)
Using equation (5), the net present value of the example in Section 5 is calculated to 94.1 million USD. 1 . 94 1 , 1 ) 28 . 0 1 )( 120 50 200 ( 6 1 t t NPV . (6)
The financial leasing cost payments (120 per year) are included in the cash flow as an operating cost . Interest and down payments enter the cash flow and are deducted as
operating cost. The net present value of 94.1 million USD is a substantial increase from the 12.4 million calculated from equation (2) and (4). The calculation is erroneous since the cash flow is no longer a total capital cash flow where the WACC may be used in discounting.
7. The Method - Calculating project NPV with a financial lease
The method requires calculating an investment equivalent from the lease payments. This investment equivalent is an estimate of the present value of the financial commitment the lease represents. The investment equivalent (E) is calculated by estimating the present value of the lease payments using the corporate borrowing rate. Since this is a strict financial lease where borrowing and leasing are perfect substitutes, the corporate borrowing rate before tax is used in discounting. In equation 7 E is calculated
T t t d t r L E 1(1 ) , (7)
where Lt is the lease payments and rd is the corporate borrowing rate before tax.
The lease payment is an annuity with present value E and interest and down payments of it and dt, respectively. The tax shield resulting from it is accounted for in the WACC. The
down payments, dt, are the estimates of the depreciation amounts of the investment equivalent E. The value equation is then
T t t c t c t t WACC T d T O R E NPV 1 1 ) 1 )( ( , (8)
where E has replaced I and dtTc has replaced DtTc in equation (3). The example case value of
the project is then
5 . 12 1 , 1 28 . 0 ) 28 . 0 1 )( 50 200 ( 572 6 1 t t t d NPV . (9)
With leasing payments of 120 million and a borrowing rate of 7%, E is calculated to 572, and the down payments (dt) as estimate of the depreciation amounts associated with E are
calculated to [80.0, 85.6, 91.5, 98.0, 104.8, 112.1] from years 1 through 6 respectively (annuity from lease). The estimated NPV of the project using the investment equivalent method is 12.5 million USD. This project NPV estimate is a better estimate of the project net present value than the erroneous project NPV of 94.1 million USD calculated in equation (6).
In Appendix 1 we provide a test of our proposed invest equivalent method, indicating that it is an accurate method.
8. Case: Liquefied Natural Gas example
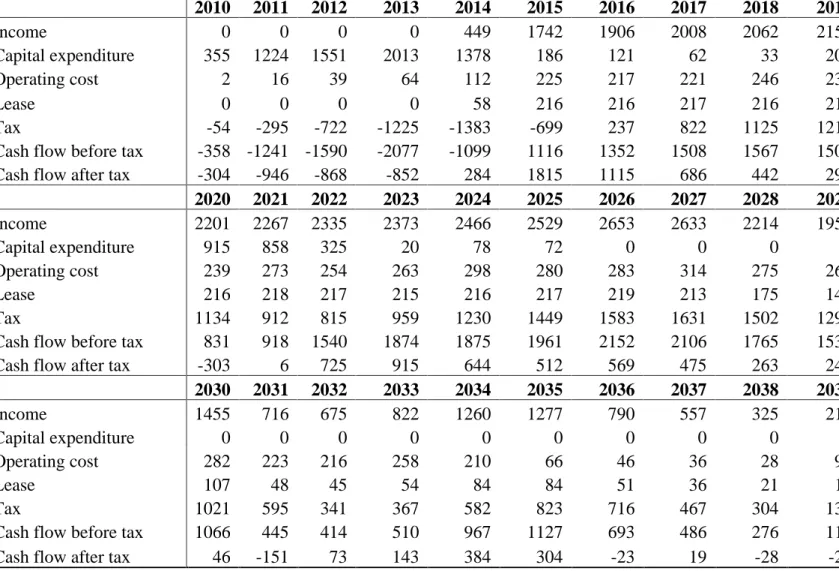
To illustrate the magnitude in the net present value calculation error an example from an offshore Liquefied Natural Gas (LNG) field development is presented. Detailed project data are available in Appendix 2. The building of the necessary LNG trains and field capital expenditure (wells and modification) amount to 7.6 billion 2006 USD. The project has an upfront committed contractual agreement with the ship owner and the regasification terminal (at the east cost of the USA) owner for the whole production period (2014-2039). The
contractual agreement is a take or pay agreement that commits the oil company to pay the tariff whether they use the facilities or not. We do not have access to reliable information on investment cost for LNG transportation ships or a regasification terminal.
The shipping and regasification costs (paid in terms of tariffs) are 1 USD per mill Btu. Ordinary operating costs are 5,5 billion USD over the lifespan of the project. Investment start is set to 2010 and production is in the period from 2014 to 2039. Total production amounts to 100 billion standard cubic meter of Gas and 14 million standard cubic meter of condensate.
Price assumptions are an eastern USA Gas price of 6,25 USD (2006) per million Btu and an oil price of 38 USD (2006) per barrel. The required rate of return is 10% after tax (real), inflation is 2.5%, and the reference year for discounting is 2006. The Norwegian offshore tax regime with a 78% marginal tax rate is assumed and the investment in shipping and regasification is assumed to be in a tax regime with a 28% marginal tax rate (ordinary tax rate in onshore Norway). The shipping and regasification cost, however, is assumed to be deductible against the 78% tax rate regime by the oil companies.
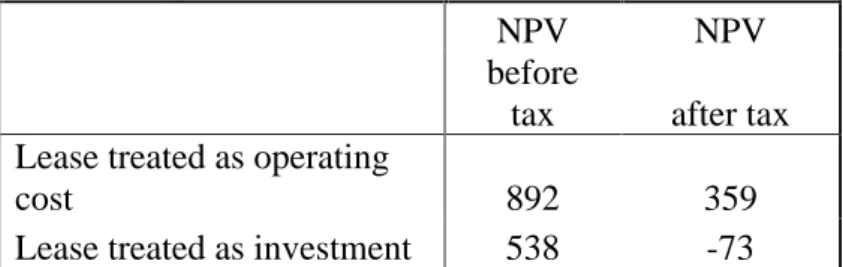
The shipping and regasification cost of 1 USD per mill Btu will amount to 3,8 billion USD over the lifespan of the project. In a standard net present value calculation where the shipping and regasification cost erroneously classified as operating cost, the project net present value is 359 million USD. If we calculated the net present value of the project in accordance with the investment equivalent method presented in this article, however, the net present value is negative; minus 73 million USD.
Table II. NPV, LNG example Mill 2006USD
NPV NPV
before
tax after tax Lease treated as operating
cost 892 359
Lease treated as investment 538 -73
This demonstrates the magnitude of the error in net present value calculation and the possibility of a wrong project acceptance decision. Management must be aware of this
possible net present value calculation error and treat leasing arrangements correctly in the valuation of the project. If capital leasing is not treated correctly in the project net present value calculation, other investment cost (7.6 billion USD in this example) could make project managers eager to lease additional assets, thereby reducing the investment amount and increasing the extent of leasing. This could give rise to even larger errors.
9. Conclusion
An important objective for capital investment valuation procedures in a company is to establish a level playing field for the capital allocation process, to facilitate an optimal allocation of investment funds. A common way to achieve this end is to take financing decisions out of the projects NPV calculations. This is sometimes challenged by inseparable project financing, e.g., financial leasing of LNG infrastructure. Financial leasing represents fixed payments, analogously to debt financing. Thus, project leasing increases the company s gearing and thereby increases the funding cost of all the company s projects. This negative external effect is not accounted for in the traditional way of treating financial leasing.
Accordingly, the profitability of such projects is overrated, and there are too strong incentives to take on project financing. In the paper we have presented a method that accounts for the distortions that may be imposed by leasing in investment projects.
The textbook method for the lease or buy decision is to compare the after tax
investment cost with the after tax cost of leasing using the after tax borrowing rate. In many LNG-projects, however, leasing is the only option. A common approach in such settings is to treat financial leasing costs as operating cost and discount with the firm s weighted average cost of capital (WACC). This method, which is applied on huge investments in LNG
leasing payments are contractual and deterministic, a separate cash flow valuation is called for, with a lower discount rate for financial leasing costs. We demonstrate that by including leasing payments in the total capital cash flow, it changes to an equity capital cash flow. WACC is thus not applicable.
We present a method for calculating project values with financial lease contracts when there are no investment alternatives to leasing. The method uses the cash flow from the financial lease contract offer in obtaining an estimate for an investment equivalent to replace the financial lease cost in the project cash flow. The firm weighted average cost of capital is then applicable in discounting the project cash flow. The method developed provides better estimates of project values since the alternative approach makes the error of treating the financial lease costs as operating costs. The example of an LNG project calculation
demonstrates that the error in the project net present value calculation may be substantial, and that erroneous investment decisions may be made.
References
Ang, J., and P. Peterson, 1984, The Leasing Puzzle, Journal of Finance 39, 1055-1064. Brealey, R.A., and S.C. Myers, 2003. Principles of corporate finance: Seventh Edition
(McGraw-Hill, New York).
Brealey, R.A., and C.M. Young, 1980, Debt, Taxes and Leasing-A Note, Journal of Finance 35, 1245-1250.
Copeland, T.E., and J.F. Weston, 1992. Financial Theory and Corporate Policy: Third Edition (Addison - Wesley, Menlo Park, California,).
Emhjellen, M. and Alaouze, C. M. 2002 Project Valuation when There are Two Cashflow Streams , Energy Economics, Vol. 24, September, pp. 455-467.
Emhjellen, M. and Alaouze, C. M. 2002. The Discounted Net Cashflow Method and A Modern Asset Pricing Method Implications for Project Selection and Policy , Energy Policy, Vol. 31, December, pp. 1213-1220.
Ezzell, J.R., and P.P. Vora, 2001, Leasing versus purchasing: Direct evidence on a
corporation's motivations for leasing and consequences of leasing, The Quarterly Review of Economics and Finance 41, 33-47.
Grenadier, S. R., 1996, Leasing and credit risk, Journal of Financial Economics 42, 333-364. Jensen, J.T., 2004, The development of a global LNG market, Oxford Institute for Energy
Studies.
Kang, S., and M.S. Long, 2001, The fixed payment financing decision: To borrow or lease, Review of Financial Economics 10, 41-55.
Lewellen, W.G., M.S. Long, and J.J. McConnell, 1976, Asset leasing in competitive capital markets, Journal of Finance 31, 787-798.
McConnell, J.J., and J.S. Schallheim, 1983, Valuation of asset leasing contracts, Journal of Financial Economics 12, 237-261.
Miles, J.A., and J.R. Ezzell, 1980, The weighted average cost of capital, perfect capital markets, and project life: a clarification, Journal of Financial and Quantitative Analysis, 15, 719-730.
Mukherjee, T. K., 1991, A survey of corporate leasing analysis, Financial Management
20, 96-107.
Osmundsen, P., Asche, F., and K. Mohn (2006), Valuation of Oil Companies Size Matters , Energy Journal, 27, 3, 49-64.
Osmundsen, P., Mohn, K., Asche, F., and B. Misund (2007), Is the Oil Supply Choked by Financial Markets? , Energy Policy 35, 1, 467-474.
Schallheim, J. S., R.E. Johnson, R.C. Lease, and J.J. McConnell, 1987, The determinants of yields on financial leasing contracts, Journal of Financial Economics 19, 45-67.
Sharpe, S. A., and H.H. Nguyen, 1995, Capital market imperfections and the incentive to lease, Journal of Financial Economics 31, 271-294.
Sharpe, W., 1964, Capital asset prices: A theory of capital market equilibrium under conditions of risk, Journal of Finance 19, 425-442.
Trigeorgis, L., 1996, Evaluating leases with complex operating options, European Journal of Operational Research 91, 315-329.
UBS Warburg, 2003, Global Integrated Oil Analyzer, quarterly assessment of the strategies and valuation of the world s largest integrated oil companies.
Appendix 1: Test of the accuracy of the proposed investment equivalent method
In Section 7, we demonstrated a considerable deviation in project value between the common method of treating leasing costs as OPEX, and our proposed investment equivalent method. We now test the accuracy of our method by comparing with the textbook method. As pointed out, the textbook method is not applicable when the investment amount is not known to the lessee. For testing our method, however, we check the accuracy of our method in a case where the investment cost is known to the lessee.
From equation (1), (3), (7) and (8) the project value difference, which we denote PVD,
between the textbook method and the investment equivalent method, is given by
T t T t t c t c t t t d t T t t d c c t c t T t t c t c t t D WACC T d T O R r L r T T D T L I WACC T D T O R I PV 1 1 1 1 ) 1 ( ) 1 )( ( ) 1 ( ) 1 ( 1 ) 1 ( 1 ) 1 )( ( (10) . Simplifying the expression, we get
T t t d c c t c t T t T t t c t t t d t D r T T D T L WACC T d D r L PV 1 1 1 1 (1 ) ) 1 ( ) 1 ( ) ( ) 1 ( (11)
For our example with T equal to 6 periods,
1 . 0 ) 0504 . 1 ( ) 28 . 0 ( 100 ) 28 . 0 1 ( 120 ) 1 . 1 ( 28 . 0 ) 100 ( ) 07 . 1 ( 120 6 1 6 1 6 1 t t t t t t t D d PV . (12)
The difference the textbook method less investment equivalent method - is merely given by -0.1, i.e., indicating accuracy of the proposed investment equivalent method.
When deciding to lease an asset rather than owning it one looses the right to the depreciation amounts and gains the right to deduct the down payments from the loan. The difference in equation (11) is caused by the fact that the tax gain from this difference is discounted differently with the two methods. In the textbook method the difference is discounted using the after tax borrowing rate while in the suggested investment equivalent method the difference is discounted using the WACC. Equation (13), as equation (11), therefore expresses the net present value difference between the two methods
T t t c t t T t t c d c t t D WACC T d D T r T d D PV 1 1 (1 ) ) ( )) 1 ( 1 ( ) ( . (13)
Using (13) for our example the present value difference is -0.1 million USD which is equal to the difference shown in (12).
Setting (11) equal to (13), we get
T t t d c t t T t t d c c t c t T t t d t r Tc T d D r T T D T L r L 1 1 1 (1 (1 ) ) ) ( ) 1 ( 1 ) 1 ( ) 1 ( . (14)
Since the lease payment (Lt) is equal to the down payment (dt) plus the interest payment (it),
(14) is equal to T t t d c t c t T t t d t r T d T i r L 1 1 1 (1 ) ) 1 ( ) 1 ( . (15)
Equation (15) demonstrates that the present value of a loan is equal to the present value of the interest payments after-tax plus the present value of the down payments, both discounted using the after-tax interest rate.
For any given t since
) 1 ( d d r Lr i and ) 1 ( d d r Lr L d
d c d d c d d d T r r r L L T r r L r L ) 1 ( 1 ) 1 /( ) 1 ( ) 1 /( ) 1 (
(16) and ) 1 ( ) 1 )( 1 ( ) 1 ( ) 1 ( d c d d d d c d d r L r r T r r T r L r L
. (17)
In the case where there is no investment alternative, there exist no alternative but to use the corporate WACC in discounting the depreciation tax shields. Differences in cash flows between alternative development concepts are in practical analysis evaluated by using the WACC. The suggested investment equivalent method is, as a result of using the WACC when discounting the depreciation tax shields, consistent with current practice.
An alternative method to the investment equivalent method is to estimate a correct required rate of return for the project cash flow including the financial lease (i.e. an equity cash flow). Such a project valuation method would be difficult and not very practical since the financial lease will cause the debt level to change during the lifetime of the project, requiring a new estimate for the required rate of return for each individual period.
Appendix 2: Data from the LNG example Table 1: Lease treated as operating cost
Mill USD 2010 2011 2012 2013 2014 2015 2016 2017 2018 2019 Income 0 0 0 0 449 1742 1906 2008 2062 2157 Capital expenditure 355 1224 1551 2013 1378 186 121 62 33 201 Operating cost 2 16 39 64 112 225 217 221 246 230 Lease 0 0 0 0 58 216 216 217 216 218 Tax -54 -295 -722 -1225 -1383 -699 237 822 1125 1213
Cash flow before tax -358 -1241 -1590 -2077 -1099 1116 1352 1508 1567 1509
Cash flow after tax -304 -946 -868 -852 284 1815 1115 686 442 295
2020 2021 2022 2023 2024 2025 2026 2027 2028 2029 Income 2201 2267 2335 2373 2466 2529 2653 2633 2214 1953 Capital expenditure 915 858 325 20 78 72 0 0 0 0 Operating cost 239 273 254 263 298 280 283 314 275 268 Lease 216 218 217 215 216 217 219 213 175 149 Tax 1134 912 815 959 1230 1449 1583 1631 1502 1292
Cash flow before tax 831 918 1540 1874 1875 1961 2152 2106 1765 1536
Cash flow after tax -303 6 725 915 644 512 569 475 263 244
2030 2031 2032 2033 2034 2035 2036 2037 2038 2039 Income 1455 716 675 822 1260 1277 790 557 325 215 Capital expenditure 0 0 0 0 0 0 0 0 0 0 Operating cost 282 223 216 258 210 66 46 36 28 93 Lease 107 48 45 54 84 84 51 36 21 12 Tax 1021 595 341 367 582 823 716 467 304 138
Cash flow before tax 1066 445 414 510 967 1127 693 486 276 110
Cash flow after tax 46 -151 73 143 384 304 -23 19 -28 -28
Table 2: Lease treated as investment Norwegian offshore taxation case as table 1
Mill USD 2010 2011 2012 2013 2014 2015 2016 2017 2018 2019 Income 0 0 0 0 449 1742 1906 2008 2062 2157 Capital expenditure 355 1224 1551 2013 1378 186 121 62 33 201 Operating cost 2 16 39 64 112 225 217 221 246 230 Lease 0 0 0 0 58 216 216 217 216 218 Tax -54 -295 -722 -1225 -1383 -699 237 822 1125 1213
Cash flow before tax -358 -1241 -1590 -2077 -1099 1116 1352 1508 1567 1509
Cash flow after tax -304 -946 -868 -852 284 1815 1115 686 442 295
2020 2021 2022 2023 2024 2025 2026 2027 2028 2029
Capital expenditure 915 858 325 20 78 72 0 0 0 0
Operating cost 239 273 254 263 298 280 283 314 275 268
Lease 216 218 217 215 216 217 219 213 175 149
Tax 1134 912 815 959 1230 1449 1583 1631 1502 1292
Cash flow before tax 831 918 1540 1874 1875 1961 2152 2106 1765 1536
Cash flow after tax -303 6 725 915 644 512 569 475 263 244
2030 2031 2032 2033 2034 2035 2036 2037 2038 2039 Income 1455 716 675 822 1260 1277 790 557 325 215 Capital expenditure 0 0 0 0 0 0 0 0 0 0 Operating cost 282 223 216 258 210 66 46 36 28 93 Lease 107 48 45 54 84 84 51 36 21 12 Tax 1021 595 341 367 582 823 716 467 304 138
Cash flow before tax 1066 445 414 510 967 1127 693 486 276 110
Cash flow after tax 46 -151 73 143 384 304 -23 19 -28 -28
Vessel and Regasification Owner company
2010 2011 2012 2013 2014 2015 2016 2017 2018 2019
Income 0 0 0 0 58 216 216 217 216 218
Capital expenditure 0 0 0 2161 0 0 0 0 0 0
Tax 0 0 0 0 0 36 38 36 35 33
Cash flow before tax 0 0 0 -2161 58 216 216 217 216 218
Cash flow after tax 0 0 0 -2161 58 180 179 181 182 185
2020 2021 2022 2023 2024 2025 2026 2027 2028 2029
Income 216 218 217 215 216 217 219 213 175 149
Capital expenditure 0 0 0 0 0 0 0 0 0 0
Tax 31 30 28 26 24 22 19 17 14 11
Cash flow before tax 216 218 217 215 216 217 219 213 175 149
Cash flow after tax 184 189 189 189 192 195 200 196 161 138
2030 2031 2032 2033 2034 2035 2036 2037 2038 2039
Income 107 48 45 54 84 84 51 36 21 12
Capital expenditure 0 0 0 0 0 0 0 0 0 0
Tax 9 7 6 5 5 4 3 2 1 1
Cash flow before tax 107 48 45 54 84 84 51 36 21 12
Cash flow after tax 98 41 39 49 79 80 48 34 20 11
Combined Cash flows
2010 2011 2012 2013 2014 2015 2016 2017 2018 2019
Cash flow before tax -358 -1241 -1590 -4238 -1041 1332 1568 1725 1783 1727
Cash flow after tax -304 -946 -868 -3013 342 1995 1294 867 624 480
2020 2021 2022 2023 2024 2025 2026 2027 2028 2029
Cash flow before tax 1047 1136 1757 2089 2091 2178 2371 2319 1940 1685
Cash flow after tax -118 195 914 1104 837 707 768 671 424 382
2030 2031 2032 2033 2034 2035 2036 2037 2038 2039
Cash flow before tax 1173 493 459 564 1051 1211 744 521 297 122