Parallel Query Evaluation
as a Scientific Data Service
Bin Dong, Surendra Byna, and Kesheng Wu
Computational Research Division Lawrence Berkeley National LaboratoryBerkeley, CA, 94720
Email:{DBin, SByna, KWu}@lbl.gov Abstract—Scientific experiments and simulations produce
mountains of data in file formats, such as HDF5, NetCDF, and FITS. Often, a relatively small amount of data holds the key to new scientific insight. Locating that critical information in these large files is challenging because existing solutions need significant user involvement in preparing the data, generating indexes, and answering queries. Data management systems that support querying, such as SciDB, require a costly process of loading data from scientific data formats to these systems. The search results also need to be converted back to a format needed by the subsequent data analysis and visualization tools. These steps are time-consuming, tedious, and possibly error-prone.
Toward providing efficient data management directly on these scientific file formats, we introduce a framework called Scientific Data Services (SDS). SDS targets to provide efficient data management optimizations as services. In this paper, we introduce the design and implementation of one such service, the parallel querying service. To answer the queries efficiently, we transparently augment user data with bitmap indexes and ordered datasets. We design the querying service to manage these augmented datasets and to redirect queries automatically to bitmap indexes or to ordered datasets based on their availability and the expected query response time. The generation of bitmap indexes and sorted datasets and querying are parallelized to work on large supercomputers. We show that SDS achieves 22X, 55X, and 62X speedups compared to conventional full-scan approach of sifting through data in answering three queries from a plasma physics analysis application.
Keywords—Scientific Data Services, Parallel Query Processing
I. INTRODUCTION
Large-scale simulations and experiments are generating high-resolution data that could lead to better understanding of various physics phenomenon around us. The ability to quickly analyze the massive amounts of data is critically important to scientific discoveries. As high-performance computing is advancing towards extreme scale, even more data is expected [15]. Often, a relatively small amount of data records hold the key to new scientific insights. In such a case, an effective data querying mechanism could significantly accelerate the data analysis process. In this work, we report our effort in designing and developing such a parallel querying mechanism.
Scientific data is typically stored on parallel file systems, such as Lustre [17] and GPFS [27]. These parallel file systems treat the data as “sequences of bytes” [16]. Such an abstraction simplifies file system design and implementation, but fails to capture even simple semantic information about the data,
Data Analysis Applications HDF5/PNetCDF/ ... API
Scientific Data Service (SDS) Parallel File System
Storage Hardware
SDS Query API
Fig. 1. SDS in the parallel I/O stack
which significantly limits the support for data analysis. For example, in a plasma physics simulation [6], each particle contains a few properties, such as energy and spatial locations (x, y, and z). A typical analysis by domain scientists is to select a subset of the particles satisfying some user-specified conditions on these properties. High-level I/O libraries, such as HDF5 [14], PnetCDF [21], and ADIOS [23], have been developed to facilitate the management of these properties, but they offer little or no support for value-based queries.
A large amount of data outside of the scientific community are managed by database management systems (DBMS). A key distinction between DBMS and file systems is that DBMS maintains certain semantic information about user data through a high-level data model called relational data model. Recently, several such data management systems have been developed specifically for managing scientific data, for example, SciDB [4], PostSQL [26], ArrayDB [25], and SciHadoop [5]. While these systems provide relational queries across multiple vari-ables either with SQL queries or with SQL-like interfaces, they require loading data from existing files to a format that these systems work with. This loading process is often time consuming and error-prone as it requires extensive user involvement [3]. Moreover, results produced by these systems need to be converted back to data formats that visualization tools and analysis tasks can understand. To avoid the loading and the conversion processes, a number of research efforts have explored the option of directly indexing scientific data files [1], [9]. For example, Chou et al. developed FastQuery [9] to generate bitmap indexes to support queries on a number of different file formats. However, to use these systems, ap-plication developers have to make significant changes to their analysis programs. To improve the usability and to provide transparent parallel functionality, we develop an option that minimizes changes to the user program for data analysis.
Our parallel querying capability is a new service in the Scientific Data Services (SDS) framework, where the overall objective is to provide easy-to-use scientific data management
services [12], [33]. As shown in Fig. 1, SDS is a lightweight layer in the parallel I/O stack, between the applications and parallel file system. Developing an efficient querying capability to handle scientific file formats and to run on massively parallel systems has many challenges. Solutions are needed for loading only the data that satisfies given query conditions. These solutions have to make use of the abundant parallelism available on large-scale clusters. The analysis programs have to transparently request for data in their original data formats without the need to understand the physical placement of the data. Towards solving these challenges, we develop SDS to separate logical and physical views of user data. Using SDS, applications can access data in an array data structure, while the actual data access to the underlying physical data can be optimized through reorganization or indexing. We provide a query interface for searching the data of interest, called
SDSQuery[12]. This interface permits applications to directly
read the interesting portions of data defined by query condi-tions. We develop optimizations such as balancing the data reads among parallel processes and selecting the best physical organization of the data to obtain efficient performance. In this paper, we describe bitmap index generation and query execution strategies on large HDF5 datasets. In summary, the main contributions of this paper are as follows:
• We introduce a parallel querying service and explore generating bitmap indexes and sorting
• We propose a method for query execution to select among the original, reordered, and indexed datasets. • We implement a balanced reader to distribute the
data reading workload as equal as possible among the participating computing processes.
• We extensively evaluate the performance of the SDS querying service using a real plasma physics dataset and demonstrate the usability of the SDS framework.
The rest of the paper is organized as follows: In Section II, we provide a brief background to querying and using bitmap indexes towards querying. We also present an overview of the SDS framework. We present details of the SDS server, parallel methods for generation of indexed or ordered files for supporting query evaluation, and transparent query processing in Section III. In Section IV, we report performance evaluation results of SDS querying service using the data and queries from a real plasma physics application. We review related work in Section V, and conclude the paper with a brief discussion of future work in Section VI.
II. BACKGROUND
Query-driven analysis of data reduces data movement in scientific data exploration. Instead of accessing all the data records and scanning through them for information, querying for the interesting features in the form of conditional state-ments, such as “temperature > 100 AN D pressure > 200”, reduces the amount of data movement. While database management systems (DBMS) support these types of queries using SQL statements, support for such queries on scientific data formats is primitive. Our team has been working on various technologies including FastBit bitmap indexing and FastQuery towards that goal. In this section, we present a brief
introduction to those technologies and an introduction to the Scientific Data Services (SDS) framework, which is aimed at providing data management tasks as transparent services.
A. Bitmap Indexing
Bitmap indexes show a significant advantage over other data structures in querying low-cardinality data [29]. The basic idea of bitmap index is to pre-build the bit arrays (bitmaps) with data and then use them to answer the data selection query. For our work, we use an open-source bitmap indexing library named FastBit [34]. This library has many state-of-the-art bitmap indexing techniques [35], and is demonstrated to work well in a variety of scientific applications [34].
The FastBit library supports thread-based parallelism. To work on large datasets on massively parallel computers, we have developed FastQuery. It partitions the user data into fixed size blocks, manages the bookkeeping of the blocks, invokes FastBit to generate indexes and evaluates queries. This parallelization strategy has shown to work well in a number of examples [9]. FastQuery implements I/O drivers for accessing array data stored in different file formats, such as HDF5, PnetCDF and ADIOS. However, using FastBit and FastQuery requires users to make significant changes to their analysis programs to instantiate query processing objects and to per-form query execution. Moreover, users have to build bitmap indexes explicitly before using them for query execution. These steps are often tedious and time consuming. Through SDS, we provide services that generate the indexes transparently and select the right options for query evaluations.
B. Scientific Data Services Framework
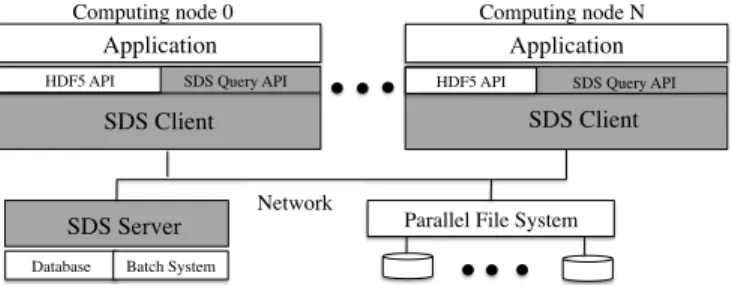
In our previous paper [12], we have described the design of the Scientific Data Services (SDS) framework that automates data management tasks such as reorganizing data layout on file system to improve read performance. The SDS framework has two components: SDS Clients and SDS Server. In Fig. 2, we show a high-level overview of the SDS framework. The Server is responsible for monitoring data usage patterns, executing data optimizations such as generating indexes and sorting data, and managing the metadata related to the optimized datasets. The server can make decisions to sort or to generate bitmap indexes based on observed data usage patterns. We also provide an administrative interface for users of SDS to initiate data optimizations without waiting for the server to observe and detect possible data optimizations. The current implementation of SDS uses one Server to support a number of Clients, and the Server runs on a compute node with static IP address. The clients use this IP address to request the server and to identify the optimized datasets. The clients, accessed by an analysis application using a runtime library, run on the compute nodes where the analysis runs. When the analysis opens a file to read or to query data from a HDF5 file, a designated SDS client requests the SDS Server for the availability of optimized datasets for the HDF5 file. The designated SDS client is typically the master process, i.e., Rank 0, of Message Passing Interface (MPI) programs. When optimized datasets are available and deemed beneficial to read them, the designated client broadcasts that information to all other MPI processes. A full description of the components of
the Server and the Clients are available in [12]. In this paper, we focus on the challenges and solutions of parallel querying.
Network Computing node 0
Application
HDF5 API
SDS Client
Parallel File System SDS Server
Database Batch System
Computing node N Application
HDF5 API
SDS Client
SDS Query API SDS Query API
Fig. 2. An overview of SDS architecture. An application links with the SDS Client library, where each MPI process links with an SDS Client. The Client on MPI Rank 0 contacts the SDS Server to find the location of the data organized by the Server for faster access than the original data and broadcasts the location information to all the Clients.
III. SDS PARALLELQUERYINGSERVICE
A parallel querying service directly on scientific data files has multiple challenges. First, there isn’t a widely used query interface for applications to specify query conditions or to execute the search operations. As a prototype query interface, we devise a simple API on top of HDF5. This API can compose query conditions in a string. The conditions on each variable can be joined together with AND and OR operators. The next challenge is in generating secondary datasets effi-ciently and transparently while keeping the original data files intact. In Section III-A, we describe transparent augmented data generation. Finally, the query execution has to be efficient. We explain the operation of query execution in Section III-B that includes a discussion of the selection of efficient datasets based on the expected query performance.
A. Augmented Data Generation
As mentioned earlier, the SDS framework has Server and Client components. The server is responsible for generating datasets that would provide better performance, for placing them on storage space managed by SDS, and for managing their location. In Fig. 3, we show the components of the SDS server and the interactions among them.
SDS Client Request Dispatcher SDS Service Job Manager SDS Metadata Manager Request Evaluator SDS Service Evaluator
SDS request Metadata request
SDS file information
Read information statistics
SDS metadata and Request
SDS metadata
Frequently read file and its SDS metadata
Attribute of SDS file File handle and service type SDS Server User requested service SDS Admin Interface File registration or user requested service
Data Service Recommender SDS metadata and Request Recommend Service Recommend Service
Fig. 3. Main components of SDS Server and their interactions.
When optimized datasets are created by SDS, the metadata of these datasets, such as the identity of the original data, lo-cation, access permissions, and type of optimization are stored in a lightweight database, called SDS Metadata Manager. We implemented the Metadata Manager using Berkeley DB and use the original data file as a key to find the optimized datasets.
TheRequest Dispatcher accepts requests from Clients and
the Admin Interface. The SDS server can detect data usage patterns and then decide to perform various optimizations, or a user or an administrator can use the Admin Interface to suggest an optimized organization of the original data. We also use the Admin Interface for indexing or sorting the original data. A request can either register a file for possible optimizations or start a specific data service such as indexing. When the file is registered, the information such as access patterns and preferred data service can also be provided. A request from an SDS client or an administrator can be directed to SDS Service Evaluator and Request Evaluator, respectively. We implement the communication between client and server with the use of protocol buffers1.
In this paper, we use two types of augmentation of data to support querying: bitmap indexes and ordered dataset based on a given column. We describe the two types in the following subsections. The SDS Service Evaluator, shown in Fig. 3, parses the request given to the Admin Interface and initiates a batch job creation request to the Service Job Manager. TheSDS
Service Job Manager composes a job batch script based on
the requested augmentation and submits it to a parallel system where the SDS server is running. The Service Job Manager has access to a pool of executable binary files to perform augmentations, such as FastBit bitmap indexing and sorting data. The Job Manager determines the number of processes to use for running these services based on the size of the data, and memory requirement. The Job Manager monitors the progress of the submitted batch jobs and stores the metadata in the Metadata Manager at the completion of the jobs.
1) Parallel Bitmap Index Generation: To build the bitmap
index from the data, we have implemented an MPI program based on FastBit library. The data from the original file is equally partitioned into multiple chunks based on the number of processes participating and the rank of each process. Then, each chunk is read into the memory by individual process concurrently. The FastBit library is called in the following index construction steps. The bitmap construction functions of FastBit first split the data into bins with different boundaries. In each single bin, one representative key is selected. The distinct values of these representative keys are selected and the original data are mapped into 0 or 1 based on these distinct values. In the process of index creation, the compression method named Word-Aligned Hybrid compression (WAH) is employed to reduce the index file size. Our previous implementation of parallel bitmap index generation, which resulted in FastQuery, writes the produced bitmaps from different cores into a single HDF5 file. However, due to synchronization requirements of the HDF5 library, we noticed significant inefficiencies in writing metadata to the bitmap file. To tackle this problem, SDS writes the bitmaps into separate individual binary files in a single directory, where the directory name is the original data file name. As writing one file-per-process (fpp) is considered to achieve peak I/O performance [7], parallel bitmap index generation strategy will avoid costly synchronization overhead. The index files are named with a prefix of the HDF5 dataset that has been indexed. After the indexes are generated, the SDS Job Manager stores the directory location, the indexed HDF5 dataset name, and the number of index files into the
Metadata Manager.
2) Sorted Organization of Data: In typical data analysis
operations, selecting the data located in a certain range is a common practice. For example, in mass spectrometry imaging data analysis [11], accessing a range of consecutive spectra in images with certain mass-to-charge ratio (m/z) values is one basic requirement. The data requests are typically expressed within the logically contiguous space of the data. However, the physical data layout of the requested data may have been scattered across the whole file. In such cases, accessing data from different regions of a file performs poorly due to a large number of disk accesses. By reorganizing data into a contiguous region and accessing large chunk of data with fewer requests to disk can achieve serious performance benefits.
SDS can order the datasets using parallel sorting and manage the sorted datasets. Our parallel sorting algorithm is based on the classic Sample Sorting algorithm [22]. This algorithm partitions the data into chunks and assigns each chunk to one processor. Each processor applies a quick sorting on the local chunk and sample its local sorted chunk. One process (typically rank 0 of MPI) then gathers chunks from all processes together and samples it again. The final sample at rank 0 processor is used to choose pivots, which are sent to all processors. After receiving the pivots, all processors exchange the data based on its pilots. When exchange is done, each processor sorts its local data again and writes the results to file. The sorted data for each process is combined into single sorted file. SDS Job Manager stores the ranges of sorted data and the size of each chunk in the Metadata Manager.
B. Parallel Querying
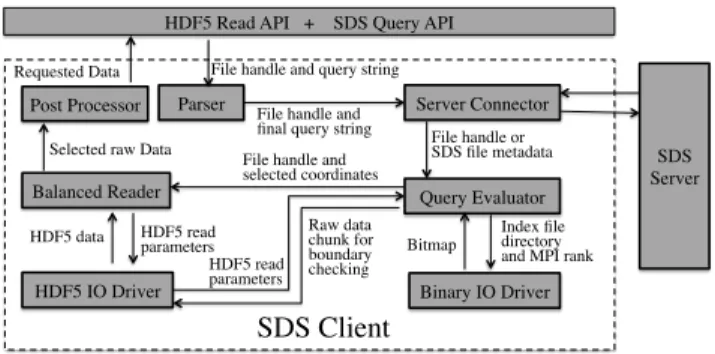
The SDS Client library, which is linked to each MPI process at runtime, performs query evaluation and execution, reads data either from the augmented datasets or from the original data files, and returns the data that satisfies a given query condition to the application. In Fig. 4, we show the internal structure of the SDS Client. The SDS Client library is capable of handling the HDF5 API and the SDSQuery API. The Parser intercepts either of the API calls and the Server Connector contacts the SDS Server for locating any optimized datasets. The Server Connector uses protocol buffers to communicate with the SDS Server. As mentioned above, only the SDS Client linked to the MPI Rank 0 contacts the server and broadcasts all the other processes with any information received from the server. If optimized datasets are available, Query Evaluator evaluates the query condition and determines the co-ordinates or indexes of the data records that satisfy the given query and passes the co-ordinates to the Balanced Reader. The Reader executes the query, i.e., reads the data from the augmented datasets. If optimized datasets are not available, the Balanced Reader reads the entire data from the original files and scans for information that satisfies the given query condition.
We will now elaborate the operation of the Query Evaluator and Balanced Reader for different types of augmented datasets.
1) Selection among Augmented Datasets: When there are
multiple augmented datasets, such as ordered and indexed datasets, choosing a dataset that would give the best querying performance is a challenge. We have developed a heuristic
Parser
Balanced Reader Post Processor
HDF5 Read API + SDS Query API
File handle and query string
File handle or SDS file metadata Selected raw Data
Requested Data
Server Connector
SDS Client File handle and final query string
Query Evaluator
File handle and selected coordinates
Binary IO Driver HDF5 IO Driver
Index file directory and MPI rank Bitmap
HDF5 read parameters
HDF5 data Raw data chunk for
boundary checking HDF5 read parameters SDS Server
Fig. 4. An overview of the SDS Client and the interactions among various components
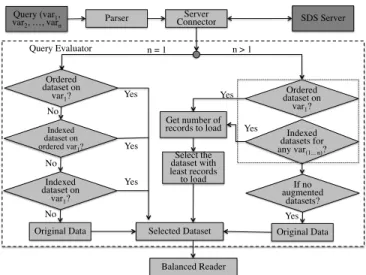
algorithm, shown in Fig. 5, that selects a dataset based on the availability, on the number of variables in a query condition, and on the number of data records to read after evaluating a query. When a query comes to the parser, the query string is sent to the server and the Query Evaluator obtains the metadata related to the availability of augmented datasets and the ranges of data to be read. If none of the augmented datasets are available, the original data files are chosen for reading the entire data and for scanning the data where query conditions match. When augmented datasets are available, the Query Evaluator assesses each of the datasets and selects an augmented dataset that it estimates to give the best query execution performance.
If the number of variables in a condition is equal to one, reading an ordered dataset for that variable results in reading contiguous data and provides the best performance. In this case, reading an indexed dataset will involve reading data from different and possibly non-contiguous locations causing poor performance than reading an ordered dataset. If an ordered dataset is not available, then this algorithm chooses an indexed dataset. If an augmented dataset is unavailable, then the SDS reads the original data files and scans through the entire data. If there are multiple variables being evaluated in a query condition, the selection is dependent on whether there are indexes or ordered datasets based on any of the variables and the number of records to load from the data. Evaluating a query from ordered datasets needs a simple calculation of the chunks of data to be loaded. The evaluation of sorted dataset is based on the first variable that has been based for sorting all the records. Evaluating bitmap indexes involves reading the bitmap indexes and identifying all the coordinates where the matching data records are available. Query Evaluator uses FastBit software for obtaining the coordinates through evaluating a query, where FastBit uses various optimizations to reduce the number of records to be loaded to memory [34]. Our current implementation of Query Evaluator selects the dataset with the least number of records to load. The Balanced Reader reads the data either from the augmented datasets or from the original data files based on the selected dataset.
The Evaluator processes the ranges of sorted chunks and passes them to the Balanced Reader on each process to read data in those chunks. When using the indexed files, the Evaluator reads the index files from the location returned by the Server, and obtains the coordinates. If the size of index files is larger than the memory of a process, the Evaluator splits
Parser Connector Server Query (var1,
var2, …, varn SDS Server
Ordered dataset on var1? n = 1 n > 1 Selected Dataset Yes Indexed dataset on ordered var1? No Yes Indexed dataset on var1? No No Original Data Yes Get number of records to load Ordered dataset on var1? Indexed datasets for any var(1... n)? Yes If no augmented datasets? Yes Yes Original Data Select the dataset with least records to load Query Evaluator Balanced Reader
Fig. 5. Process of selecting an augmented dataset between ordered and
indexed datasets
the load into multiple chunks and iterates through the chunks. After each iteration, the Evaluator sends the coordinates to the Balanced Reader to read the data. When using the coordinates from indexed datasets, there is a possibility of load imbalance among the processes, i.e., some processes may not have enough coordinates to read while some are overloaded. The Reader balances the load, where the overloaded processes send the coordinates to underloaded processes. The Balanced Reader uses the number of hits to distribute the reading load as evenly as possible to all the participating processes by dividing the number of hits by the number of processes. In an unsorted dataset, the Balanced Reader exchanges the number of coordinates among processes, while in a sorted dataset, it exchanges the number of coordinates and the size of the data to be read. The Post Processor is not used in reporting the querying results, but is available to perform any matrix transformations or expansion of compressed data [12].
Through dynamic interception of SDS Query calls and evaluation of queries makes the operation of SDS Client trans-parent without the need of user involvement. The automatic augmented data generation to support querying directly on scientific file formats is an important feature making the SDS framework a vital tool for data management. We plan to integrate our recent work on performing complex operations, such as JOIN operations on different HDF5 datasets that would make SDS even more compelling.
IV. EVALUATION
We have conducted all the experiments reported in this paper on Edison2, a Cray XC30 supercomputer at the National
Energy Research Scientific Computing Center (NERSC). Each compute node of Edison is configured with two 12-core Intel “Ivy Bridge” processors at 2.4 GHz and 64 GB DDR3 1600 MHz memory. We used a Lustre file system of Edison, which has a peak performance of 72 GB/sec. The number of OSSs and OSTs for this file system is 36 and 144, respectively. In our tests, the stripe size for all files is set to be 1 MB, and the stripe count is 144. We used one of the 24 resource manager
2http://www.nersc.gov/users/computational-systems/edison/
nodes, called MOM nodes, for running the SDS Server. The server runs as a daemon and submits the indexing and sorting jobs to batch system to run on compute nodes. The SDS Client processes of the jobs running on compute nodes contact the Server for locating SDS optimized files.
We have analyzed the overheads involved in creating the augmented datasets needed to support querying and compared the times for executing a query. We have used the data and analysis queries from a real plasma physics application, called magnetic reconnection simulation and analysis based on Vector Particle-in-cell (VPIC) code [6]. The number of particles in the data are 1.2 trillion and each particle has seven properties, i.e.,
x,y,z,Ux,Uy,Uz, andEnergy, representing the location, the momentums, and the energy of the particles. The total size of each variable is467GB and the total size of the file is3.2TB. The queries of the analyses done on this data include searching for location of highly energetic particles in the entire dataset, and searching for the momentums of highly energetic particles in certain locations. In the former analysis, the query condition is based on theEnergyvariable, i.e.,Energy > value. In the latter, the query condition extends to x, y, andz, along with
Energy. Table I shows the queries we used in this evaluation.
TABLE I. QUERIES INVOLVED IN ANALYZINGVPICDATA
Query ID Query Condition String
Q1 Energy >1.7
Q2 Energy <1.3&&308< X <309&&149< Y <150 Q3 Energy >1.3&&300< X <310&&140< Y <150
We divide the evaluation into two parts: (i) generation of augmented datasets and (ii) execution of queries. In augment-ing the datasets, we compare the performance and storage space requirements with different types of augmented datasets. In the execution of queries, we compare performance with the support of augmented datasets. We also compare the query evaluation overhead for selecting the best augmented dataset based on the estimated cost of accessing the selected data. We also show the benefit of using a balanced load among processes in reading data from the storage compared to an imbalanced approach.
A. Augmented Data Generation Overheads
The cost of augmented data generation in SDS is analogous to building indexes to accelerate queries in database manage-ment systems. In SDS, we expect to generate bitmap indexes or ordered datasets transparently when the system is idle through observing data usage patterns or by taking user commands through the Admin Interface. In the current implementation, we require the user to initiate augmented data generation. The available options are to generate sorted data according to a specified variable and to index one or more variables either in the original data or in the sorted data. In our comparisons, we represent these options asSorting,Indexing original data, and
Indexing sorted data. We compare the execution time overhead
for generating these datasets and for storing them, and discuss the trade-offs.
1) Execution time overhead: In Fig. 6, we compare the
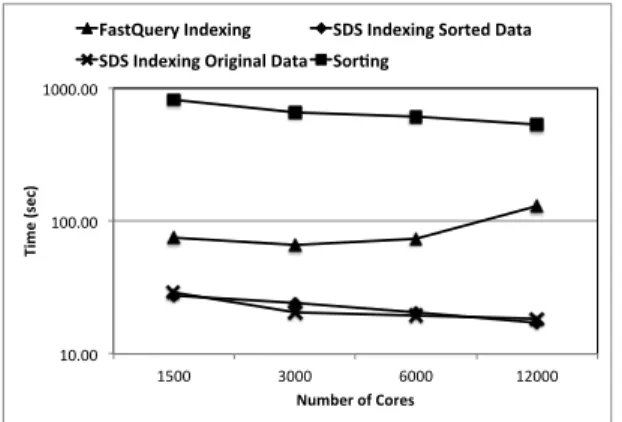
execution times for generating the three augmented datasets mentioned above for the VPIC data using different numbers of CPU cores. We also show the execution time for generating a single HDF5 index file using FastQuery [9]. We can observe
that the index generation overhead with FastQuery increases as we increase the number of processes. This is due to the increased metadata storing overhead in the HDF5 index files. In our current implementation of bitmap index generation, we use one file-per-process, where the metadata is small and stored in individual files without the need for synchronization. We observe that the cost of parallel sorting is higher than that of index generation as all the variables have to be read and written to a replicated file according to one variable’s sorted order, whereas indexing is performed only by reading the variable to be indexed. In this figure, we also show that we can easily use thousands of CPU cores and can generate indexes in the order of a few tens of seconds. As generation of these datasets can occur off-line in the background, this overhead does not affect the analysis performance directly.
10.00 100.00 1000.00 1500 3000 6000 12000 Ti me ( sec)
Number of Cores
FastQuery Indexing SDS Indexing Sorted Data SDS Indexing Original Data Sor?ng
Fig. 6. Time to construct augmented datasets for one variable (Energy) of the VPIC dataset using different numbers of CPU cores
2) Storage overhead: In Table II, we show the storage
requirements of augmented data produced by multiple methods using different number of MPI processes. FastQuery produces a single HDF5 file with a size of varying from≈8 GB to≈37 GB as the number of processes increases. Because FastQuery collects all the bitmaps into one single file, it has to maintain offsets of where bitmaps end for each process. As a result, the size of the index file grows with the number of processes. Indexing the original data with FastBit directly by SDS and producing multiple binary files generate a number of files equal to the number of processes. The file size is constant at 67 GB. Maintaining individual files with their own bitmaps reduces compression of bitmaps compared to storing one single file causing increase in the size of bitmap indexes. However, this is only 14% of the size of the Energy variable and using it for searching is reasonable. Sorting the original data according to the Energy variable replicates the original data in a different order. The size of the sorted file is equal to the size of the original data, i.e., 3.2TB. Indexing the sorted data reduces the bitmap index size significantly as bitmaps compress efficiently. In this case, we can delete the sorted data as we can use the bitmap indexes to locate the queried data. The increase in the file size with the number of processes is due to the creation of more files. However, the storage footprint of the largest index using 12,000 processes is ≈0.7 GB, which is quite small.
From the time and the storage space overheads for creating augmented datasets, we can see that generating bitmap indexes is less costly compared to replicating the entire data. In the following discussion, we evaluate the performance of analysis
TABLE II. SIZE OF AUGMENTED DATA(INGB)PRODUCED WITH
1500, 3000, 6000,AND12000PROCESSES
1500 3000 6000 12000
FastQuery 7.8 9.3 19 37
Bitmap indexes of original 67.88 67.79 67.77 67.77
Bitmap indexes for sorted 0.09 0.18 0.35 0.69
Sorted 3264.94 3264.94 3264.94 3264.94
using these augmented datasets.
B. Query Execution Performance
We analyze the performance of executing the three queries listed in Table I. The overall query execution involves multiple steps: SDS Client requests the Server for the availability and location of augmented datasets, query evaluation, and reading data from storage to memory. The overhead of SDS Client and Server interaction is negligible as the communication involves a few bytes of data transfer. We have already shown in our previous paper [11] that this communication overhead is negligible even when a large number of clients requesting the server simultaneously. In this paper, we focus on discussing query evaluation time and overall query execution time. We will discuss running Q1 from the list, where the query contains a condition on one variable, and then running Q2 and Q3, where a condition contains multiple variables. We execute these queries using a different number of CPU cores to evaluate parallel query execution. In all these tests, we use the augmented datasets produced with 6,000 CPU cores, i.e., the number of bitmap files is equal to 6,000.
1) Single Variable Condition (Q1): In Fig. 7, we compare
the performance of executing Q1 with a different number of CPU cores ranging from 8 to 1024. Our comparison includes query execution time for conventional analysis, i.e., scanning entire data to find the records that satisfy a given condition (labeled “full-scan”), and for analysis using sorted data (“using sorted data”), bitmap indexes for the original dataset (“using original data indexes”), and bitmap indexes for the sorted dataset (“using sorted data indexes”). There are a few missing values in processing the data with full-scan using a small number of cores. Because partitioning a large number of data records on a small number of processes caused out-of-memory (OOM) errors, using at least 512 or 1024 processes was needed for the full-scan approach.
As can be observed, using the sorted data for query execution obtains the best performance, i.e. 55X faster than full-scan using 1024 cores. Using bitmap indexes also obtain 7X to 10X speedup compared to the full-scan. The crucial performance benefit with sorted data comes from reading a small number of contiguous data records in the storage, where the data records are sorted according to the variable in the condition string. The query evaluation cost of using bitmap indexes involves loading the bitmap indexes whereas query evaluation of sorted datasets involves simply knowing the ranges and locations of the sorted data chunks. We present the query evaluation costs for using the three augmented datasets in Fig. 8. We note that while using sorted data obtains the best performance, the overhead of sorting is significant compared to maintaining indexes as discussed above in Section IV-A. Depending on the storage space availability, SDS can adapt to generate one of these augmented datasets. When using the indexes, SDS still obtains reasonable speedups.
0.1 1 10 100 8 16 32 64 128 256 512 1024 Ti me ( sec.)
Number of Cores
Q1 Performance
full scan using sorted data using sorted data indexes using original data indexes
Fig. 7. Query execution time for Q1 (Energy >1.7) with different numbers of CPU cores and with using different augmented datasets
0.1 1 10 100 8 16 32 64 128 256 512 1024 Ti me ( sec)
Number of Cores Q1 Evalua7on Overhead
using sorted data using sorted data indexes
using original data indexes
Fig. 8. Query evaluation overhead for Q1
2) Multiple Variable Conditions (Q2 and Q3): Fig. 9 shows
the performance of query execution of multi-variable query condition Q2, and Fig. 11 shows that for condition Q3. In Q2, the condition on Energy (i.e.,Energy <1.3) matches 97% of the data records and in Q3, the condition Energy > 1.3
matches 3% of the data records. The locations of x and y
coordinates are narrower in Q2 than those in Q3. Examined evaluation options include full-scan, using sorted data, using indexes on original data, and using indexes on sorted data.
For Q2, using bitmap indexes on original data obtains the best performance as FastBit software evaluates all the conditions simultaneously and selects the condition that has the least number of data records to load. In this case, using bitmap indexes on original data is 22X faster compared to full-scan. Using sorted dataset performs the worst among the augmented datasets as it evaluates Energy variable first and loads almost all the data to memory. It also suffers OOM errors when using a small number of cores. We are currently working to solve the OOM errors with the use of an iterator to partition fixed size chunks equal to the memory capacity.
In evaluating Q3, using sorted dataset performs the best (62X faster than full-scan) as the number of records to load is small. While using bitmap indexes of sorted and original datasets achieves 12X and 14X speedups, respectively, our SDS selects sorted dataset. In the absence of sorted dataset, SDS still achieves significant speedups.
In Fig. 10 and 12, we show the evaluation overheads of Q2 and Q3. They reiterate that the overhead with sorting is low and much of the query execution time with indexing is due to the evaluation overhead.
1 10 100 1000 10000 8 16 32 64 128 256 512 1024 Ti me ( sec.)
Number of Cores
Q2 Performance
full scan using sorted data using sorted data indexes using original data indexes
Fig. 9. Query execution time for Q2
0.1 1 10 100 1000 8 16 32 64 128 256 512 1024 Ti me ( sec.)
Number of Cores
Q2 Evalua8on Overhead
using sorted data indexes using original data indexes using sorted data
Fig. 10. Query evaluation overhead for Q2
1 10 100 1000 10000 8 16 32 64 128 256 512 1024 Ti me sec.)
Number of Cores Q3 Performance full scan using sorted data using sorted data indexes using original data indexes
Fig. 11. Query execution time for Q3
3) Balanced vs Imbalanced Reads: In Fig. 13, we show the
importance of balancing the data reading load among processes when using the indexed datasets. In sorted dataset, the load can be balanced easily based on splitting the number of data records equally among the processes. When using the bitmap indexed data, data records at the selected coordinates may have the imbalanced read workload for each process. The plot in Fig. 13 compares the times to read data from the storage when
0.1 1 10 100 8 16 32 64 128 256 512 1024 Ti me ( sec.)
Number of Cores Q3 Evalua8on Overhead
using sorted data indexes using original data indexes using sorted data
Fig. 12. Query evaluation overhead for Q3
0 1 2 3 4 5 6 8 16 32 64 128 256 512 1024 Ti me ( seco nd )
Number of cores
Imbalanced Read Balanced Read
Fig. 13. Performance Comparison between Balanced Read and Unbalanced
Read for queryEnergy >1.7
the workload is imbalanced and balanced. We can clearly ob-serve that balancing the load achieves significant performance improvement. We observe similar trend in executing the Q2 and Q3 queries.
V. RELATEDWORK
Parallel file system plays a significant role in data-intensive scientific applications [19]. Often, a file stored in parallel file system may have a fixed layout throughout its life time. But, the diversity of data analysis patterns in scientific applications [10], [28] needs different data layouts. To bridge this gap, file reorganization methods are widely explored [36], [20], [31], [32], [2], [13]. Typically, these methods aim at deriving an optimal data layout for specific data operations and cannot easily generalize for multiple operations. In contrast, the SDS framework aims at improving I/O operations with automatic and transparent data reorganization and augmentation.
Meanwhile, the data model and associated interface of most existing parallel file systems are still based on ‘sequences of bytes’ concept, which makes it hard to extract semantic information from the data. A few high-level libraries, including HDF5 [14] and Parallel netCDF (PnetCDF) [21], are currently in use as popular scientific data formats. Such libraries provide the scientific applications an abstract view (typically arrays) rather than a physical view of the data. To facilitate the array based data accesses, both HDF5 and PnetCDF provide high-level programming interfaces rather than POSIX-IO interface. Since most of the scientific applications need to access a
subset of the values [6], [8], [18], [24], these libraries also provide functions like H5Sselect hyperslab to select a part of an array. However, when analysis applications need to select data records based on values of a data property, such as range queries, users of HDF5 and PnetCDF need to write special functions to extract the desired data records. Efforts to design new query interface for HDF5 and PnetCDF have been in progress recently [24], [30], [37]. The key distinction of SDS is that the SDS framework supports value-based query interface and provides efficient data query operations through its transparent services. For example, the selection of indexes or reorganized data or sorted data is transparent to the users. The SDS approach makes it easier to take advantage of efficient data management services.
Successes of database management research have been extended to serve scientific data querying in the recent years. SciDB [4], PostSQL [26], ArrayDB [25], and SciHadoop [5] are typical examples of recently developed such data manage-ment systems. The most related to SDS is SciDB[4], which is based on array model, and works on a distributed architecture. One motivation for SciDB is that most of the scientific datasets are generated and stored in array formats. For example, in a high-energy particle dataset, each variable can be represented as a column and each particle’s properties can be stored as a tuple. But, a typical characteristic of scientific data is that the size is extremely large. For example, a single file of a few trillion particle plasma physics simulation can be larger than 100 TB. To take advantage of massive parallelism on large clusters, the data is written to files. Transferring that data into data management systems such as SciDB is extremely time-consuming. With SDS, we target in place data analysis to avoid data transferring time while providing efficient value based querying. In our recent work [3], we have demonstrated that in place analysis of SQL queries outperforms PostgreSQL by 4X and Apache Hive by 10X. Based on the foundations of FastBit and FastQuery, SDS targets at using cutting edge massively parallel systems to achieve efficient data management with minimal user involvement while managing data in existing file formats that have extensive analysis and visualization tool support.
VI. CONCLUSIONS ANDFUTUREWORK
Data analysis plays a key role in extracting knowledge from large scientific data. To support efficient data analysis, we have recently proposed Scientific Data Service (SDS), a lightweight transparent optimization layer in the parallel I/O stack. In SDS, data is abstracted as multi-dimensional arrays, instead of byte sequences stored in a parallel file system. In this work, we present the design and development of a parallel querying as a service of SDS. The key features of the querying service include an easy-to-use interface, cost-based selection of augmented datasets, and efficient query execution. The querying service parallelizes the index generation, sorting, and query answering tasks without user intervention. Furthermore, by taking advantage of the flexibility offered by SDS, we are able to automatically balance the workload of different processes and to improve query processing speed.
To assess the performance of the querying service, we have evaluated it with three different queries of a plasma physics analysis task. Our evaluations show that the querying service
achieved up to 60X faster than the conventional full-scan process of the answering the same queries. The extensions of this effort include automatic identification of variables to be sorted or indexed and efficient storage management for placing replicas of data.
ACKNOWLEDGMENT
This work is supported by the Director, Office of Labora-tory Policy and Infrastructure Management of the U.S. Depart-ment of Energy under Contract No. DE-AC02-05CH11231, and used resources of The National Energy Research Scientific Computing Center (NERSC).
REFERENCES
[1] I. Alagiannis, R. Borovica, M. Branco, S. Idreos, and A. Ailamaki. NoDB: Efficient query execution on raw data files. InSIGMOD, pages 241–252, 2012. http://doi.acm.org/10.1145/2213836.2213864. [2] J. Bent, G. Gibson, G. Grider, et al. PLFS: a checkpoint filesystem
for parallel applications. In Proceedings of the Conference on High
Performance Computing Networking, Storage and Analysis, SC ’09,
pages 21:1–21:12, 2009.
[3] S. Blanas, K. Wu, S. Byna, B. Dong, and A. Shoshani. Parallel data analysis directly on scientific file formats. In 2014 ACM SIGMOD, pages 385–396, 2014. http://doi.acm.org/10.1145/2588555.2612185. [4] P. G. Brown. Overview of SciDB: Large Scale Array Storage,
Process-ing and Analysis. InACM SIGMOD, pages 963–968, 2010.
[5] J. B. Buck, N. Watkins, J. LeFevre, K. Ioannidou, C. Maltzahn,
N. Polyzotis, and S. Brandt. SciHadoop: Array-based Query Processing in Hadoop. In Proceedings of the Supercomputing Conference 2011, SC ’11, pages 66:1–66:11, New York, NY, USA, 2011. ACM. [6] S. Byna, J. Chou, O. R¨ubel, Prabhat, H. Karimabadi, et al. Parallel
I/O, analysis, and visualization of a trillion particle simulation. In
Proceedings of the Supercomputing Conference 2012, SC ’12, 2012.
[7] S. Byna, A. Uselton, Prabhat, D. Knaak, , and Y. He. Trillion Particles, 120,000 cores, and 350 TBs: Lessons Learned from a Hero I/O Run on Hopper. InCray User Group meeting, 2013.
[8] J. Chen. Terascale direct numerical simulations of turbulent combustion.
InProceedings of the 2006 ACM/IEEE conference on Supercomputing,
SC ’06, 2006.
[9] J. Chou, K. Wu, and Prabhat. FastQuery: A Parallel Indexing System for Scientific Data. InCLUSTER, pages 455–464. IEEE, 2011. [10] P. E. Crandall, R. A. Aydt, A. A. Chien, and D. A. Reed. Input/output
characteristics of scalable parallel applications. InProceedings of the
1995 ACM/IEEE conference on Supercomputing (CDROM),
Supercom-puting ’95, 1995.
[11] B. Dong, S. Byna, and K. Wu. Expediting scientific data analysis with reorganization of data. InCluster Computing (CLUSTER), 2013 IEEE
International Conference on, pages 1–8, Sept 2013.
[12] B. Dong, S. Byna, and K. Wu. SDS: A Framework for Scientific Data Services. InProceedings of the 8th Parallel Data Storage Workshop, PDSW ’13, pages 27–32, New York, NY, USA, 2013. ACM. [13] B. Dong, X. Li, L. Xiao, and L. Ruan. A new file-specific stripe size
selection method for highly concurrent data access. InGrid Computing
(GRID), 2012 ACM/IEEE 13th International Conference on, pages 22–
30. IEEE, 2012.
[14] M. Folk, G. Heber, Q. Koziol, E. Pourmal, and D. Robinson. An
overview of the HDF5 technology suite and its applications. In
Proceedings of the EDBT/ICDT 2011 Workshop on Array Databases,
AD ’11, pages 36–47, 2011.
[15] G. Fox, G. von Laszewski, J. Diaz, K. Keahey, J. Fortes, R. Figueiredo, S. Smallen, W. Smith, and A. Grimshaw.FutureGrid - a reconfigurable
testbed for Cloud, HPC, and Grid Computing. CRC Computational
Science. Chapman & Hall, 4 2013.
[16] D. Hildebrand, A. Nisar, and R. Haskin. pNFS, POSIX, and MPI-IO:
a tale of three semantics. InProceedings of the 4th Annual Workshop
on Petascale Data Storage, PDSW ’09, pages 32–36, 2009.
[17] P. J.Braam. The Lustre Storage Architecture (Tech. Rep.). Technical report, Available: http://wiki.lustre.org/., 2004.
[18] S. Klasky, S. Ethier, Z. Lin, K. Martins, D. McCune, and R. Samtaney. Grid-based parallel data streaming implemented for the gyrokinetic toroidal code. InProceedings of the 2003 ACM/IEEE conference on
Supercomputing, SC ’03, pages 24–, 2003.
[19] S. Lang, P. Carns, R. Latham, R. Ross, K. Harms, and W. Allcock.
I/O performance challenges at leadership scale. InProceedings of the Conference on High Performance Computing Networking, Storage and
Analysis, SC ’09, pages 40:1–40:12, 2009.
[20] L.-W. Lee, P. Scheuermann, and R. Vingralek. File Assignment in
Parallel I/O Systems with Minimal Variance of Service Time. IEEE
Trans. Comput., 49(2):127–140, Feb. 2000.
[21] J. Li, W.-k. Liao, A. Choudhary, R. Ross, R. Thakur, W. Gropp,
R. Latham, A. Siegel, B. Gallagher, and M. Zingale. Parallel netCDF: A High-Performance Scientific I/O Interface. In Proceedings of the
2003 ACM/IEEE Conference on Supercomputing, SC ’03, pages 39–,
New York, NY, USA, 2003. ACM.
[22] X. Li, P. Lu, J. Schaeffer, J. Shillington, P. S. Wong, and H. Shi. On the versatility of parallel sorting by regular sampling.Parallel Comput., 19(10):1079–1103, Oct. 1993.
[23] Q. Liu et al. Hello ADIOS: the challenges and lessons of developing
leadership class I/O frameworks. Concurrency and Computation:
Practice and Experience, 2013.
[24] B. Ma et al. Efficient attribute-based data access in astronomy analysis.
InSupercomputing (SC), 2012 SC Companion:, pages 562–571. IEEE,
2012.
[25] A. P. Marathe and K. Salem. Query Processing Techniques for Arrays.
The VLDB Journal, 11(1):68–91, Aug. 2002.
[26] PostgreSQL Global Development Group. PostgreSQL. http://www.
postgresql.org/.
[27] F. Schmuck and R. Haskin. GPFS: A Shared-Disk File System for Large Computing Clusters. InProceedings of the 1st USENIX Conference on
File and Storage Technologies, FAST ’02, 2002.
[28] E. Smirni and D. A. Reed. Lessons from characterizating the
in-put/output behavior of parallel scientific applications. Perform. Eval., 33(1):27–44, June 1998.
[29] I. Spiegler and R. Maayan. Storage and retrieval considerations of binary data bases. Inf. Process. Manage., 21(3):233–254, Aug. 1985.
[30] Y. Su and G. Agrawal. Supporting User-Defined Subsetting and
Aggregation over Parallel NetCDF Datasets. In Proceedings of the 2012 12th IEEE/ACM International Symposium on Cluster, Cloud and
Grid Computing (ccgrid 2012), CCGRID ’12, pages 212–219, 2012.
[31] X.-H. Sun, Y. Chen, and Y. Yin. Data layout optimization for petascale file systems. InProceedings of the 4th Annual Workshop on Petascale
Data Storage, PDSW ’09, pages 11–15, 2009.
[32] Y. Tian et al. EDO: Improving Read Performance for Scientific
Applications through Elastic Data Organization. InProceedings of the
2011 IEEE International Conference on Cluster Computing, CLUSTER
’11, pages 93–102, 2011.
[33] K. Wu, S. Byna, D. Rotem, and A. Shoshani. Scientific data services – A high-performance I/O system with array semantics. In HPCDB. IEEE, 2011.
[34] K. Wu et al. FastBit: Interactively Searching Massive Data. Journal of
Physics Conference Series, Proceedings of SciDAC 2009, 180:012053,
June 2009. LBNL-2164E.
[35] K. Wu, E. J. Otoo, and A. Shoshani. Optimizing bitmap indices with efficient compression. ACM Trans. Database Syst., 31(1):1–38, Mar. 2006.
[36] T. Xie and Y. Sun. A file assignment strategy independent of workload characteristic assumptions.Trans. Storage, 5(3):10:1–10:24, Nov. 2009.
[37] Y. S. Yi Wang and G. Agrawal. Supporting a Light-Weight Data
Management Layer Over HDF5. InProceedings of the International