DigitalCommons@University of Nebraska - Lincoln
DigitalCommons@University of Nebraska - Lincoln
Theses and Dissertations in Animal Science Animal Science Department 12-2012
Beef cattle production: Understanding the effect of heifer
Beef cattle production: Understanding the effect of heifer
development system, late gestation protein supplementation, and
development system, late gestation protein supplementation, and
ovarian steroidogenic environment on productivity, reproduction,
ovarian steroidogenic environment on productivity, reproduction,
and longevity
and longevity
Adam SummersUniversity of Nebraska-Lincoln, adamfsummers@gmail.com
Follow this and additional works at: https://digitalcommons.unl.edu/animalscidiss
Part of the Other Animal Sciences Commons
Summers, Adam, "Beef cattle production: Understanding the effect of heifer development system, late gestation protein supplementation, and ovarian steroidogenic environment on productivity, reproduction, and longevity" (2012). Theses and Dissertations in Animal Science. 63.
https://digitalcommons.unl.edu/animalscidiss/63
This Article is brought to you for free and open access by the Animal Science Department at
DigitalCommons@University of Nebraska - Lincoln. It has been accepted for inclusion in Theses and Dissertations in Animal Science by an authorized administrator of DigitalCommons@University of Nebraska - Lincoln.
AND OVARIAN STEROIDOGENIC ENVIRONMENT ON PRODUCTIVITY, REPRODUCTION, AND LONGEVITY
by
Adam F. Summers
A DISSERTATION
Presented to the Faculty of
The Graduate College at the University of Nebraska In Partial Fulfillment of Requirements For the Degree of Doctor of Philosophy
Major: Animal Science
Under the Supervision of Professors Richard N. Funston and Andrea S. Cupp
Lincoln, Nebraska
BEEF CATTLE PRODUCTION: UNDERSTANDING THE EFFECT OF HEIFER DEVELOPMENT SYSTEM, LATE GESTATION PROTEIN SUPPLEMENTATION,
AND OVARIAN STEROIDOGENIC ENVIRONMENT ON PRODUCTIVITY, REPRODUCTION, AND LONGEVITY
Adam F. Summers, Ph.D. University of Nebraska, 2012
Advisors: Richard N. Funston and Andrea S. Cupp
Beef cattle longevity is related to reproductive success, which can be influenced by development system and maternal environment. Three experiments were conducted to determine the impact of development system, maternal protein supplementation, and ovarian steroidogenic environment on beef cattle reproduction.Experiment 1 evaluated the effect of heifer development system on heifer performance and reproduction. Heifers developed on corn residue (CR) had reduced BW from prebreeding through pregnancy diagnosis compared with drylot (DL) developed heifers, but there was no difference in reproductive performance. A subset DL and CR heifers were placed in an individual feeding system to determine feed efficiency during late gestation. Drylot heifers tended to have increased final BW and ADG. In Exp. 2, primiparous heifers were individually fed grass hay and received either no supplement (CON), a distillers based supplement (HIGH), or a dried corn gluten feed (LOW) based supplement during late gestation. Weaning calf BW tended to be greater for steers born to HIGH supplemented dams compared with CON. Similarly, carcass characteristics were altered in calves based on maternal nutrition. The objective of Exp. 3 was to identify the effect of ovarian and
follicular environment on oocyte molecular phenotype. Ovariectomy was performed on beef cows approximately 36 h after CIDR removal and PGF administration. Cows were classified as high (HGE) or low (LGE) based on granulosa cell efficiency. Cows
classified LGE had increased androgen secretion and expression of steroidogenic
pathway enzymes in theca cells. Furthermore, mRNA abundance of ZAR1 was reduced in LGE oocytes. In summary, these experiments support the following findings: (1)
developing heifers on CR does not reduce reproductive performance or impact late gestation feed efficiency compared with DL-developed heifers; (2) primiparous heifer protein supplementation improved steer calf weaning BW and altered progeny carcass characteristics; (3) Increased androgen production in LGE animals increases
steroidogenic enzyme gene expression and/or mRNA stability during oocyte growth and maturation.
Table of Contents
CHAPTER I: Review of the literature ... 1
INTRODUCTION ... 1
EPIGENETIC MODIFICATIONS ... 2
DNA methylation ... 3
Histone modifications ... 6
MicroRNAs and epigenetics ... 7
Intergenerational effects of fetal programming ... 8
IMPACT OF EARLY GESTATIONAL NUTRTION ... 9
Maternal nutrition and placental development ... 10
Maternal nutrtion and fetal organ development ... 13
Primordial follicle assembly ... 13
Antral follicle counts... 17
Impact of maternal nutrition on progeny follicle development ... 19
Maternal nutrition and muscle development... 20
IMPACT OF LATE GESTATION NUTRITION ON PROGENY PERFORMANCE ... 22
Impact of maternal nutrtion on male progney performance ... 23
Economic impact of maternal protein supplementation ... 28
Impact of maternal undernutrition on female progeny performance ... 29
Effect of late gestation protein supplementation on heifer progeny performance ... 30
Impact of maternal body reserves on progeny performance ... 34
Impact of maternal overnutrition on progeny performance ... 35
Effect of maternal age, milk production, and birth date on progeny performance ... 36
Maternal nutrition and progeny health ... 39
IMPACT OF PREWEANING NUTRITION ON HEIFER PRODUCTIVITY ... 41
Impact of early weaning on heifer productivity ... 43
POSTWEANING MANAGEMENT ... 44
Traditional heifer development ... 44
Reduced input systems ... 45
Winter grazing development systems ... 47
Protein supplementation during heifer development ... 51
Compensatory gain ... 53
Feed efficiency ... 55
Economics of heifer development ... 58
PUBERTY ATTAINMENT ... 62 ESTROUS CYCLE ... 65 Follicular phase ... 67 Luteal phase ... 68 Estrus synchronization ... 70 FOLLICLE MORPHOLOGY ... 73 Steroidogenesis ... 74 Theca cells ... 77 Granulosa cells ... 79 Growth factors ... 80
Maternal effect genes ... 84
MicroRNAs ... 87
Meiotic resumption ... 88
POLYCYSTIC OVARY SYNDROME ... 89
Ruminants as a human model ... 92
CONCLUSIONS ... 94
OBJECTIVES ... 96
LITERATURE CITED ... 97
CHAPTER II: Effect of beef heifer development system on ADG, reproduction and feed efficiency during first pregnancy... 122
ABSTRACT ... 122
INTRODUCTION ... 123
MATERIALS AND METHODS ... 124
Developing heifer management ... 124
Blood collection and RIA ... 126
Primiparous heifer manangement ... 126
Economic analysis ... 127
Statistical analysis ... 128
RESULTS AND DISCUSSION ... 129
Heifer devlopment BW gain and reproduction ... 129
Economic evaluation ... 132
Primiparous heifer feed efficiency ... 132
IMPLICATIONS ... 136
LITERATURE CITED ... 137
FIGURE LEGENDS ... 139
CHAPTER III: Late gestation supplementation impacts primiparous beef heifers and progeny ... 148
ABSTRACT ... 148
INTRODUCTION ... 149
MATERIALS AND METHODS ... 150
Primiparous heifer management ... 150
Preweaning calf management ... 153
Calf feedlot manangement ... 153
Statistical analysis ... 154
RESULTS AND DISCUSSION ... 155
Primiparous heifer production ... 155
Preweaning and weaning calf performance ... 158
Calf feedlot performance ... 161
Carcass characteristics ... 162
IMPLICATIONS ... 165
LITERATURE CITED ... 166
CHAPTER IV: Bovine females with theca cell androgen excess result in altered oocyte maternal effect gene expression ... 178
ABSTRACT ... 178
INTRODUCTION ... 179
Animals ... 182
Ovarian tissue collection ... 183
Hormone assays ... 184
Granulosa cell efficiency (GCE) classification ... 184
RNA extraction and RT ... 185
Quantitative RT-PCR ... 185
Statistical analysis ... 187
RESULTS ... 188
Ovarian phenotypic data and hormone concentrations ... 188
Theca cell RT-PCR gene expression ... 189
COC RT-PCR gene expression ... 190
DISCUSSION ... 191
IMPLICATIONS ... 197
FIGURE LEGENDS ... 198
List of Figures
CHAPTER I: Review of the literature ... 1 Figure 1. The four ‘Rs’ of nutritional eprigenomics ... 3 Figure 2. Epigenetic marks alter gene expression ... 4 Figure 3. Summary diagram of the main pathways involved in cellular one-carbon
metabolism including the production of S-adenosylethionine (SAM) for DNA
methylation ... 6 Figure 4. Sheep conceptus growth and development in gestation and periods of specific organ development that can be influenced by maternal nutrition ... 11 Figure 5. Breakdown of germ cell nests and primordial follicle assembly ... 15 Figure 6. Effects of maternal nutrition on bovine fetal skeletal muscle developmet ... 22 Figure 7. Schematic representation of the changes in mean circulating LH and FSH concentrations from birth to first ovulation in heifers ... 64 Figure 8. Schematic depiction of the pattern of secretion of follicle-stimulating hormone (FSH), luteinizing hormone (LH), and progesterone (P4); and the pattern of growth of ovarian follicles during the estrous cycle in cattle ... 66 Figure 9. The Δ4 and Δ5 pathways of gonadal steroid synthesis ... 75 CHAPTER II: Effect of beef heifer development system on ADG, reproduction, and feed efficiency during first pregnancy... 122 Figure 1. Illistration of heifer development system ... 140 Figure 2. Heifer BW change over time ... 141 CHAPTER IV: Bovine females with thecal cell androgen excess result in altered oocyte maternal effect gene expression ... 178 Figure 1. Co-Synch + CIDR estrus synchronization protocol utilized prior to ovariectomy... 201 Figure 2. Messenger RNA abundance for genes involved with steroidogenesis in theca cells ... 205 Figure 3. Messenger RNA abundance for genes involved with angiogenesis and hormone regulation in theca cells ... 206 Figure 4. Messenger RNA abundance for genes involved with angiogenesis in the
cumulus oocyte complex ... 207 Figure 5. Messenger RNA abundance for microRNA processing genes in the cumulus oocyte complex ... 208 Figure 6. Messenger RNA abundance for maternal effect and meiotic resumption genes in the cumulus oocyte complex... 209
List of Tables
CHAPTER I: Review of the literature ... 1 Table 1. Effect of maternal nutrition on steer progeny performance ... 23 Table 2. Effect of maternal protein supplementation on steer progeny performance ... 24 Table 3. Effect of maternal weaning date and winter grazing treatement on progeny performance ... 26 Table 4. Effect of level of feed input provided to dam and to progeny on progeny
performance ... 30 Table 5. Effects of maternal protein supplementation on heifer progeny performance ... 33 Table 6. Influence of postpartum nutrtion on future milk yield ... 42 Table 7. Influence of postweaning nutrition on heifer reproductive performance ... 47 CHAPTER II: Effect of beef heifer development system on ADG, reproduction, and feed efficiency during first pregnancy... 122 Table 1. Compostion and nutrient analysis of supplement offered to heifers grazing corn residue or winter range... 142 Table 2. Compostion of diet provide to drylot heifers from February to May ... 143 Table 3. Effect of winter heifer development system on ADG and reproductive
performance ... 144 Table 4. Economics of developing beef heifers on corn residue or drylot……….145 Table 5. Effect of winter heifer development system on late gestation ADG and feed efficiency... 146 Table 6. Effect of heifer development system on calving and reproductive performance through the subsequent breeding season ... 147 CHAPTER III: Late gestation supplementation impacts primiparous beef heifers and progeny ... 148 Table 1. Composition of high and low supplemets offered heifers during late gestation ... 170 Table 2. Nutrient balance for primiparous heifers during late gestation ... 171 Table 3. Composition of backgrounding and finishing diets fed in the feedlot to progeny of primiparous heifers fed either no, 0.82 kg/d high RUP or 0.82 kg/kg low RUP
supplement during the last trimester of gestation ... 172 Table 4. Effects of supplementation on primiparous heifer late gestation performance, calving results and subsequent breeding season reproductive efficiency ... 173 Table 5. Effect of late gestation supplementation on steer progeny preweaning and
feedlot performance ... 174 Table 6. Effect of late gestation supplementation on heifer progeny preweaning and feedlot performance ... 175 Table 7. Effect of late gestation protein supplementation on steer progeny carcass
characteristics ... 176 Table 8. Effect of late gestation protein supplementation on heifer progeny carcass
characteristics ... 177 CHAPTER IV: Bovine females with thecal cell androgen excess result in altered oocyte maternal effect gene expression ... 178 Table 1. Quantitative RT-PCR primers and probes used for theca cells ... 202
Table 2. Quantitative RT-PCR primers and probes used for cumulus oocyte complexes ... 203 Table 3. Phenotypic measurements and follicular fluid hormone concentrations of high granulosa cell efficient (HGE) and low granulosa cell efficient (LGE) cows ... 204
CHAPTER I: Review of the literature INTRODUCTION
There are several characteristics reported that make the “ideal” beef cow. First, she calves at 2 yr of age, doesn’t require human intervention to calve or assistance in nursing her calf, maintains a 365-d calving interval and weans a marketable calf each yr. Furthermore, this animal must remain structurally sound, be able to graze the forages provided in her area and be tolerant of environmental stressors and disease (Hohenboken, 1988). Profitability of beef cattle producers is tied directly to the productive life span of mature cows. Heifer development costs are recovered through subsequent calf crops. Reproductive failure represents a major reason females leave the herd, impacting producers’ ability to recoup heifer development costs. Nutrition plays a major role in all aspects of beef cattle productivity. Furthermore, it is suggested the fetus is rarely able to completely express its full genetic potential for growth owing to insults caused by maternal environment (Gluckman and Liggins, 1984).
The main factors influencing nutrient partitioning between the dam and fetus include age of the dam, number of fetuses, production demand, and environmental stress (Reynolds et al., 2010). These factors play a role in programming the fetus for its future environment and available resources. Also, fetal programming reportedly impacts neonatal mortality and morbidity, postnatal growth rate, body composition, health, and reproduction (Wu et al., 2006).
EPIGENETIC MODIFICATIONS
Epigenetics is defined as heritable changes in gene expression resulting from alterations in chromatin structure but not in DNA sequence. Three main mechanisms cause epigenetic changes to the genome: DNA methylation, histone modification, and noncoding micro-RNAs (Canini et al., 2011). These processes regulate both the intensity and timing of gene expression during cell differentiation (Zeisel, 2009; McKay and Mathers, 2011). Current understanding of these genomic modifications has led to the hypothesis that epigenetics is a key mechanism allowing for phenotypic plasticity with regard to a fixed genotype (Mathers and McKay, 2009).
Human epidemiological studies report associations between low birth BW and adult disease. Researchers propose a fetal programming mechanism occurs in which environment stimuli in utero impact fetal growth and health, not only during gestation but also later in life (Barker, 1995; 1999). Animal models that report intrauterine growth retardation due to maternal undernutrition indicate altered organ and tissue development in utero (Vonnahme et al., 2003; Ford et al., 2009). These studies suggest modification of the growing fetus to allow environmental adaptation. Epigenetic modifications can result from internal as well as external stimuli (Mathers and McKay, 2009), thus allowing gene expression in the fetus to best fit with environmental stimulation.
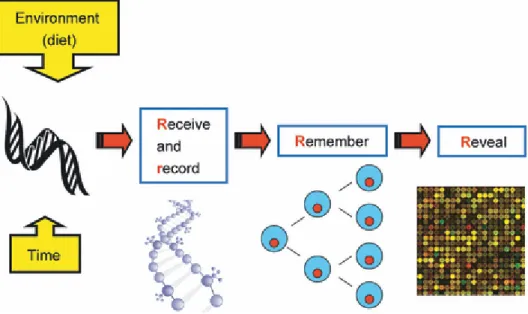
To help explain the main events and processes linking dietary exposures to epigenetic marks and, later, health outcomes, Mathers & McKay (2009) developed the four Rs of nutritional epigenomics (Figure 1). From this model, we learn nutrition stimuli and other exposures are (a) received and (b) recorded by the genome. Exposures are also
(c) remembered across successive cell generations and, finally, (d) revealed in altered gene expression, cell function, and overall health (Mathers and McKay, 2009).
DNA methylation
Most mammalian DNA, including exons, intergenic DNA, and transposons, is methylated. Methylation sites are located at cytosine bases followed by a guanosine (CpG) (Holliday, 1993). Although most CpG sites are methylated, specific CpG-rich areas of the genome, known as CpG islands, are not methylated (Figure 2). These regions span the 5’ end of the regulatory region of a gene (Ziesel, 2009). The pattern of CpG island DNA methylation varies based on tissue type, and this variation likely results in the differing expression of genes in various tissues (Suzuki and Bird, 2008).
Figure 1. The four ‘Rs’ of nutritional epigenomics. Environmental (i.e., maternal nutrition) factors occurring at select times of gestation can result in alterations of the genome that are recorded, remembered, and revealed (adapted from Maters and McKay 2009).
Figure 2. Epigenetic marks alter gene expression. Normally transcription factors (TF) bind to the promoter regions of DNA and induce gene expression producing messenger RNA (mRNA). However, when specific CpG islands in the promoter are methylated, capping proteins that prevent access of the transcription factor to DNA are attracted and gene expression is repressed (adapted from Zeisel, 2009).
The DNA methyltransferase (Dnmt) family of enzymes plays an important role in DNA methylation and, ultimately, embryonic development and survival. DNA
methyltransferase1, Dnmt3a, and Dnmt3b catalyze cytosine methylation. Furthermore, Dnmt3a and Dnmt3b can establish methylation patterns on unmodified DNA, whereas Dnmt1 maintains these patterns (Cheng and Blumenthal, 2008) when DNA is duplicated prior to cell division. Dnmt-null mice die in early gestation (Lei et al., 1996), and
methyltransferase mutations can cause not only abnormal fetal growth but also
immunodeficiency and brain abnormalities in humans (Clouaire and Stancheva, 2008). Methyltransferases utilize S-adenosylmethionine (SAM) as a methyl donor, and SAM can be directly influenced by diet. Methyl donors for SAM include choline, methionine, and methyl-tetrahydrofolate, which are related metabolically at the point homocystine is converted to methionine (Ziesel, 2009). Owing to the close relation and interaction among pathways, if the metabolism of any of these methyl donors is altered, compensatory changes will occur in the other methyl donors (Figure 3). Offspring of
pregnant mice fed choline- and methionine-deficient diets reportedly had diminished methylation in CpG islands of genes controlling brain development (Niculesca et al., 2006). Additionally, if diets are choline deficient in late pregnancy, offspring have decreased methylation of genes inhibiting cell cycling, which results in decreased progenitor cell proliferation, increased apoptosis in the fetal hippocampus, and reduced visuospatial and auditory memory (Williams et al., 1998; Albright et al., 1999; Niculescu et al., 2004).
A metabolite of one-carbon metabolism, SAM acts as a methyl donor for methylation reactions, whereas S-adenosylhomocysteine (SAH) acts as a product inhibitor for methyltransferases in DNA and histone methylation. Thus, alterations of folate, vitamin B12, methionine, choline, and betaine through nutrition can alter one-carbon metabolism and disrupt the availability of methyl donor groups (Choi and Friso, 2010). Restriction of folate, vitamin B12, and methionine from the periconceptional diet of ewes resulted in offspring that were obese as adults and had impaired immune function (Sinclair, 2007). Furthermore, studies in rats indicate DNA methylation of the liver increased 14% for individuals provided a low-folate diet from weaning to puberty (Kotsopoulos et al., 2008). These reports indicate reducing dietary methyl nutrients may alter methylation patterns and potentially increase disease susceptibility later in life.
Figure 3. Summary diagram of the main pathways involved in cellular one-carbon metabolism including the production of S-adenosylethionine (SAM) for DNA
methylation. Nutrients and other dietary components that have the potential to modulate epigenetic marks through altering SAM production are illustrated in red (adapted from McKay and Mathers, 2011).
Histone modifications
Extensive wrapping of the DNA during packaging occurs in the nucleus, forming chromatin. The fundamental unit of chromatin is the nucleosome which consists of an octamer of the four core histones (H3, H4, H2A, H2B), wrapped with 147 base pairs of DNA (Kouzarides, 2007). Histone tails protrude from the globular core and allow for further epigenetic modification via posttranslational modifications of specific amino acid residues (Kouzarides, 2007; McKay and Mathers, 2011). Histones can undergo more than 100 distinct posttranslational modifications (Kouzarides, 2007). For example, similar to
DNA, histones can be modified by methylation. However, unlike DNA, histones can also be modified through several types of N-terminal tail modifications, including acetylation, phosphorylation, biotinylation, ubiquitination, and ADP ribosylation (Canini et al., 2011) and these modifications can lead to further compaction of DNA and alter access of transcription factors (Faulk and Dolinoy, 2011). DNA methyltransferase-1 and Dnmt3a reportedly can also act with histone deacetylases to repress transcription (Burgers, et al., 2002).
Protein restriction in maternal diets has resulted in reduced DNA methylation and histone modification in rat offspring as both juveniles and adults (Lillycrop et al., 2007; 2008). However, high-protein maternal diets during gestation and lactation result in sex-specific differences in progeny. Male rat pups from mothers fed a high-protein diet had higher blood pressure compared with male pups from control-fed rats. Female pups born to high–protein intake rats had greater fat pad and body mass compared with females from control-fed rats (Thone-Reineke et al., 2006).
MicroRNAs and epigenetics
Hundreds of microRNA (miRNA), usually 22 nucleotides in length, are encoded in the genome and can impact gene expression. MicroRNA bind to target mRNA and impact stability and/or translation; miRNA binding with complete complementarity can lead to degradation of the target mRNA (Esquela-Kerscher and Slack, 2006; Chaung and Jones, 2007). After transcription and packaging, mature miRNA are able to regulate gene expression at the posttranscriptional level (Iori et al., 2010). MicroRNA bind through partial complementarity to the 3’ untranslated region of target mRNA and disrupt translation through either mRNA degradation or translation inhibition (Iori et al., 2010).
Owing to its ability to regulate gene expression, miRNA is involved in many cellular processes, including development, differentiation, and metabolism (Iori et al., 2010).
MicroRNA can play an important role in regulating epigenetic changes (Choi and Friso, 2010). Furthermore, miRNA reportedly control DNA methylation and histone modifications; promoter methylation and histone modification also affect miRNA expression (Choi and Friso, 2010). Much understanding of miRNA functions has been determined through cancer research. Abnormal expression of miRNA can alter cell proliferation and apoptosis, which leads to progression of cancer in humans(Iori et al., 2010).
Intergenerational effects of fetal programming
Programming of the genome can have lasting effects on future generations through intergenerational influences, described as factors, conditions, exposures, and environments in one generation that impact the health, growth, and development of subsequent generations (Emanuel, 1986). Drake & Walker (2004) suggested three possible explanations for the occurrence of intergenerational effects: genetic attributes may manifest themselves similarly in mother and offspring; adverse extrinsic
environmental conditions may persist across generations; and adverse in utero experiences may permanently affect maternal growth and development, altering the mother’s metabolism in a way that provides an adverse environment for her fetus (Drake and Walker, 2004). In a recent review, Ford and Long (2012) report data from human, rat, and sheep studies indicating an intergenerational effect of maternal nutrition on offspring. Zamenhof et al. (1971) reported reduced birth BW in rats born two generations after protein restriction. In addition, Susser & Stein (1994) reported women
undernourished during late pregnancy had babies with reduced birth BW, who subsequently had lower birth BW babies in the next generation.
Stewart et al. (1980a) reported rats maintained on a control diet for 12 generations had greater first-generation birth BW compared with individuals born to rats fed a diet marginally deficient in protein. Epigenetic adaptations also occurred approximately halfway through the experiment when a more unpalatable diet was supplied accidentally to rats on both diets. The subsequent generation of rats had more reduced birth BW for the protein-deficient colony as well as a slight reduction in birth BW for pups born in the control colony. Following readministration of a more palatable diet, birth BW in the control-born pups increased, but colony birth BW did not return to the baseline level for approximately three generations despite adequate maternal nutrition (Stewart et al., 1980a).
IMPACT OF EARLY GESTATIONAL NUTRITION
Robinson et al. (1977) reported 75% of ruminant fetal growth occurs during the last two months of gestation (Figure 4). Owing to the minimal nutrient requirement during early gestation, inadequate nutrition during this time was thought to have little significance. However, Rhind et al. (1989) indicated maternal undernutrition impacted the conceptus as early as gestation d 11 in sheep, prior to implantation; the conceptus from ewes fed 50% maintenance requirement was nearly one-third the size of the
conceptus from ewes fed 1.5 times their nutrient requirements. During the early phase of fetal development, critical events for normal conceptus development occur, including differentiation, vascularization, fetal organogenesis, and placental development (Funston et al., 2010a).
Maternal nutrition and placental development
The ability to alter placental development in domesticated livestock through maternal nutrition has been reviewed (Redmer et al., 2004; Reynolds et al., 2006, 2010; Vonnahme and Lemley, 2012). Establishment of functional uteroplacental and fetal circulation is one of the earliest events of embryonic and placental development (Patten, 1964; Ramsey 1982). This allows for transportation of all respiratory gas, nutrient, and waste exchanges between the maternal and fetal systems (Reynolds and Redmer, 1995, 2001). In the ruminant this involves the development of the placentome, the physiological exchange site between the mother and fetus. The placentome is comprised of two
components- cotyledons (fetal portion) and caruncles (maternal portion), which are located on the uterine wall and bind together to allow nutrient exchange. Nutrient transport efficiency through the placentome is related to uteroplacental blood flow (Reynolds and Redmer, 1995). Under normal conditions, placental weights and fetal weights are highly correlated; furthermore, fetal weight is correlated to mortality (Moule, 1956). Reports indicating reduced fetal growth rates also suggest reduced placental blood flow and nutrient uptake (Wootton et al., 1977; Reynolds et al., 1990). Placental growth occurs throughout gestation, though the greatest amount of growth occurs during the first two-thirds of gestation (Reynolds et al., 1990). Although placental growth slows during late gestation (Figure 4), blood flow to the placenta increases 4.5-fold during the last half of gestation to support the exponential rate of fetal growth occurring at the same time (Reynolds et al., 1986; Reynolds and Redmer, 2001; Reynolds et al., 2006).
Figure 4. Sheep conceptus growth and development during gestation and periods of specific organ development that can be influenced by maternal nutrition. Placental growth occurs rapidly during the first half of gestation while fetal growth is minimal through the first half of gestation, and rapid during the final 2 months of gestation. CV = cardiovascular system (adapted from Symonds et al., 2007).
Restricting beef cow nutrient intake for 90 d during early to mid-gestation results in altered placental vascularity as well as function (Vonnahme et al., 2004a, 2004b). Zhu et al. (2007) reported nutrient restriction (NR) of beef cows from d 30–125 of gestation resulted in reduced (P < 0.05) caruncular and cotyledonary weights compared with control cows. Fetal weights from NR cows also tended to be reduced (P = 0.12) compared with control cows. Following realimentation during d 125–250 of gestation, caruncular and cotyledonary weights in NR cows were still reduced; however, fetal weight was not different. Vonnahme et al. (2007), using the same cows, reported increased placental angiogenesis as well as angiogenic factor mRNA abundance in the caruncular and cotyledonary tissues at the end of the NR period. Capillary vascularity from d 30 to d 125 of gestation was not different; however, from d 125–250, significant
differences existed when comparing control (CON) and NR cows, which suggests capillary areas, numbers, and surface densities had been hindered upon realimentation (Vonnahme et al, 2007).
In a recent review, Vonnahme & Lemley (2012) reported providing protein supplementation to cows beginning on d 190 of gestation resulted in a doubling of uterine blood flow when compared with non-supplemented cows. It is hypothesized that
increased uterine blood flow may increase progeny performance, discussed later in this review, owing to increased nutrient transfer to the fetus. Sullivan et al. (2009a) fed
composite beef heifers in a 2×2 factorial design in which heifers were assigned a high– or low–protein and dietary energy diet during the first trimester of gestation. During the second trimester of gestation, half of each treatment group was offered the opposite diet, leading to four treatment groups: high/high (HH), high/low (HL), low/high (LowH), and low/low (LL). Cotyledonary weight was dependent upon both first- and second-trimester diets; pregnant heifers fed the HH diet had the most cotyledons present, and heifers fed the LL diet had the fewest cotyledons in the expelled placenta.Caruncles are present in the bovine uterus as early as month 4 of gestation, and thus the number of caruncles may be determined prior to birth (Atkinson et al., 1984). Interestingly, altering maternal dietary protein level during the first or second trimester did not influence the number of caruncles present in non-pregnant adult progeny uterus (Sullivan et al., 2009a). This would suggest maternal NR impacts the number of cotyledons developed on the placenta and available to bind to the maternal caruncle.
Maternal nutrition and fetal organ development
Fetal organ formation occurs simultaneously with placental development, and onset of limb development occurs as early as d 25 of gestation. Following limb development is the sequential development of organs, including the pancreas, liver, adrenal glands, lungs, thyroid, spleen, brain, thymus, and kidneys (Hubbert et al., 1972). Testicle development begins by d 45 in male calves, and by d 50–60, ovarian
development begins in female calves. Maternal nutrient status can impact fetal organ development. Long et al. (2009) reported enlarged hearts and brains in fetuses from NR cows from d 30–125 of gestation compared with fetuses from control cows. However, after realimentation of NR cows to achieve similar weight and body condition score (BCS) to those of control cows by d 220 of gestation, brain or heart weights did not differ among groups by d 245 of gestation. Meyer et al. (2010) reported no differences in fetal visceral organ weights at d 125 of gestation, using the same fetuses reported by Long et al. (2009). However, at d 245 of gestation, fetuses from NR cows had greater reticular mass and total intestinal vascularity compared with fetuses from control cows (Meyer et al., 2010). Other organs impacted by maternal nutrition include liver (Da Silva et al., 2002), lung (Gnanalingham et al., 2005), pancreas (Limesand et al., 2006), kidney (Gilbert et al., 2007), perirenal fat (McMillin et al., 2004; Matsuaki et al., 2006), and small intestine (Greenwood and Bell, 2003).
Primordial follicle assembly
Cow longevity is related to the ability to annually produce a live calf.
Subsequently, reproductive failure (inability to maintain pregnancy) is one of the main reasons cows leave the production herd (Renquist et al., 2006; Cushman et al., 2009). Furthermore, fertility is closely related to ovarian characteristics (Sullivan et al., 2009b).
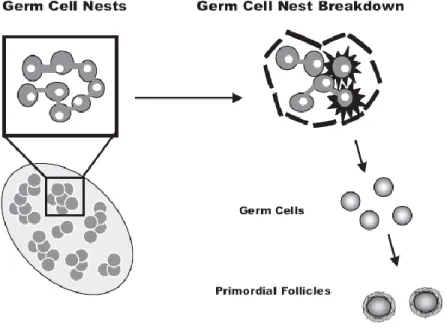
Follicle assembly is the developmental process by which individual oocytes develop from oocyte nests and assemble into primordial follicles (Figure 5). Although this process has been a topic of interest to scientists for more than a century, much of the complex
processes involved are poorly understood (Juengel et al., 2002). Follicle assembly results from groups or ‘nests’ of oocytes, after completing mitotic proliferation and entering into meiosis, separating to form individual primordial follicles (Pepling, 2006; Nilsson and Skinner, 2009). Each species undergoes the transition from oocyte nest to assembled primordial follicle at different stages with rodents undergoing the transition shortly after birth whereas other mammals such as cattle (Sakai, 1955; Tanaka et al., 2001), sheep (Mauleon, 1974; Sawyer et al., 2002), and humans (Hirshfield, 1991) undergo this transition during fetal development. Primordial follicle assembly is initiated in cattle around gestational d 80 and most primordial follicles are formed by d 143 (Nilsson and Skinner, 2009).
Primordial follicle numbers are highly variable at birth in cattle (Erikson, 1966a) ranging from an estimated 14,000 to 250,000 (Erikson, 1966a; Erickson, 1966b).
Interestingly, over the course of the cow’s lifetime, nearly 99% of all follicles within the ovarian reserve will become atretic (Ireland, 1987). While the majority of the ovarian reserve is made up of primary follicles, the number of different follicle types varies greatly among individuals. It is unclear by what mechanisms high ovarian reserve
impacts ovarian function, oocyte quality, and fertility (Ireland et al., 2009). Furthermore, ovarian reserve can be correlated to birth BW and altered by maternal nutritional status (Da Silva et al., 2002).
Figure 5. Breakdown of germ cell nests and primordial follicle assembly. Prior to d 80 of gestation cow germ cells are found in cell nests. Activation of primordial follicle
assembly results in increased oocyte nest breakdown and primordial follicle development (adapted from Barnett et al., 2006).
Primordial follicles remain arrested at the diplotene stage of the first meiotic division until hormonal regulation stimulates the primordial to primary follicle transition (Nilsson and Skinner, 2009). Transition of follicles to the primary stage is an important process allowing follicle growth and ovulation; however, it is also irreversible. Follicles stimulated to the primary stage will either proliferate and ovulate, or undergo atresia (Kezele and Skinner, 2003).
In studying the regulation of primordial follicle assembly in rats, Kezele and Skinner (2003) reported little breakdown of oocyte nests to follicles at birth, as expected. However, after 6 d in vivo numbers of primordial follicles rose 75% and the number of primary follicles increased to 25% of all follicles within 3 d of postnatal development. In vitro and in vivo results were similar with regard to primordial follicle assembly;
follicle stage while only 25% remained as primordial follicles. Increased levels of primordial to primary follicle transition were attributed to the absence of estrogen and progesterone in the in vitro culture, inhibiting follicle development.
When neonatal rat pup ovaries were cultured in the presence of estrogen only, progesterone only, or both estrogen and progesterone, there was a 20% increase in the number of unassembled oocytes in both the progesterone only, and estrogen and
progesterone treated ovaries, indicating an inhibitory effect of progesterone on primordial follicle assembly. However, all three treatments decreased primordial to primary follicle transition (Kezele and Skinner, 2003) and oocyte apoptosis decreased during follicle assembly when progesterone is present (Chen et al. 2009, Kezele and Skinner 2003).
Due to the inhibition of female sex steroids on follicle assembly in rats and mice, follicle assembly does not occur until after birth. These results suggest an endocrine model of follicle assembly (Kezele and Skinner, 2003). The proponents of this model are that exposure to high maternal progesterone during late gestation inhibits embryo follicle assembly until right after birth at which time progesterone concentration is dramatically reduced and follicle assembly commences.
Follicle stimulating hormone (FSH) is important for folliculogenesis, allowing for growth and differentiation of antral follicles during follicular waves (Ireland et al., 2009). However, concentration of FSH has a negative relationship with the number of healthy follicles and oocytes reported during follicular waves (Singh et al., 2004). Ovaries are the primary source of androgen production in the female. High variability in the number of growing follicles within individuals is hypothesized to be related to androgen production by individual follicles, and total follicle pool, which is highly variable (Jimenez-Krassel
et al., 2009). Conversely, anti-Müllerian hormone (AMH) concentrations have a positive relationship with the number of healthy follicles (Ireland et al., 2008; Ireland et al., 2009).
Antral follicle counts
One method of predicting ovarian reserve is to measure antral follicle counts (AFC) on the ovary via ultrasonography. Classifications are made based on number of antral follicles identified by ultrasonography with animals having ≤ 15 being classified as low, 16-24 moderate, and ≥ 25 classified as high follicle count groups (Ireland et al., 2008). These follicles, ≥ 3 mm in size, represent a sub-population of total ovarian reserve. Typically AFC are conducted in heifers prior to their first breeding season (13-15 mo old) and ~15 to 20% of the herd will be classified as low or high AFC while the remaining 80-85% will be classified as moderate AFC (reviewed in Ireland et al., 2012). Research indicates that, although follicle number variation is present among individuals, the peak number of antral follicles growing during a follicular wave is highly repeatable within individuals when ovarian ultrasonography is utilized (Burns et al., 2005; Ireland et al., 2007). Low AFC heifers had lower pregnancy rates and reduced numbers of
morphologically healthy oocytes and follicles (Ireland et al., 2008; Cushman et al., 2009; Mossa et al., 2012) when compared with high AFC heifers. Furthermore, Mossa et al. (2012) reported high AFC dairy cows had a 3.34 times greater (P < 0.05) odds ratio of being pregnant at the end of the breeding season when compared with low AFC animals. Mossa et al. (2012) also reported a tendency for high AFC animals to return to estrous 21 d after calving compared with low AFC cows and a reduced duration from calving to conception. The decreased timing from calving to conception could be due to an increase
in the number of estrous cycles experienced by high AFC cows earlier in the breeding season. Byerley et al. (1983), observed increased pregnancy rates for heifers bred on third estrus compared with those bred on pubertal estrus, and perhaps similar improvements in fertility can be associated with first estrous after calving and later estrous cycles.
Cow reproductive longevity has been associated with AFC. Cows remaining in the herd ≥ 6 years have numerically higher AFC compared with cows that leave the herd at ≤ 2 years having never produced a calf (Cupp et al., 2011). Mossa et al. (2012)
reported dairy cows with high AFC had an average of 2.6 lactations compared to 1.9 lactations for low AFC, also suggesting increased longevity of cows with greater AFC. Furthermore, Mossa et al. (2012) reported a trend (P = 0.09) for decreased median calving to conception period for High (100 d) compared with low AFC cows (114 d). High AFC heifers also have larger (P ≤ 0.07) ovaries (Burns et al., 2005; Ireland et al., 2008; Cushman et al., 2009; Mossa et al., 2012), likely due to the greater density and number of follicles present in the ovary, and high AFC heifers are 3 kg heavier (P = 0.003) at birth compared with low AFC heifers (Cushman et al., 2009).
Reports of differences in hormone profiles between high and low AFC heifers can also be found in the literature. Ireland et al. (2009) reported a 2-fold increase (P = 0.02) in follicular fluid estrogen concentration, as well as increased FSH concentration, when comparing low AFC to high AFC animals. Furthermore, heifers classified as low AFC have increased gonadotropin secretion, and reduced P4 levels compared with high AFC heifers (Ireland et al., 2012). Decreased progesterone levels have been reported to increase embryonic mortality in cattle (Inskeep, 2004; Ireland et al., 2011) and could
possibly play a role in the decreased pregnancy rates reported in low AFC heifers (Ireland et al., 2008; Cushman et al., 2009; Mossa et al., 2012).
Impact of maternal nutrition on progeny follicle development
Rae et al. (2001) reported maternal undernutrition in sheep during the first 110 d of gestation results in reduced ovulation rates, most likely through a direct effect on folliculogenesis. Furthermore, limiting the duration of undernutrition to 1–2 mo during the first 110 d of gestation also reduces the number of follicles that develop beyond the primordial stage (Rae et al., 2001). Maternal nutrient restriction (NR) can also have long-term influences on plasma P4 levels in progeny (Long et al., 2010a; Nurmanat et al., 2011). In a small group of heifers, NR and NR with protein supplementation resulted in reduced (P ≤ 0.10) wet ovarian weight and decreased (P ≤ 0.05) luteal tissue mass compared with heifers born to control-fed cows (Long et al., 2012).
Mossa et al. (2009) reported a 60% reduction in AFC for heifers born to dams fed 60% of their energy requirements compared with heifers from control-fed dams.
However, Da Silva (2002) reported reduced ovarian follicles from progeny of ewe lambs fed to achieve rapid maternal growth rates throughout pregnancy compared with progeny from ewe lambs fed to gain 50–75 g/d through the first 100 d of gestation. Sullivan et al. (2009b) also reported a negative influence of high protein and dietary energy fed to heifers during the second trimester on primordial and primary follicle density (n per 100 mm2). Progeny born to heifers fed the HH or LowH diets had lower (P = 0.07) primordial and primary follicle densities compared with progeny from heifers fed the LL or HL diets; however, total AFC density was not different (Sullivan et al., 2009b). Reduced follicle densities in the LowH and HH groups coincided with high maternal plasma urea
nitrogen (PUN) concentration (Sullivan et al., 2009b). The effect of PUN on fetal ovarian follicle development is unknown; however, it has been well established that high PUN impacts reproductive characteristics and fertility with reports indicating increased interval from calving to first ovulation, altering uterine pH, and decreasing pregnancy rates (Jordan and Swanson, 1979; Canfield et al., 1990; Elrod et al., 1993; Sinclair et al., 2000; Moellam et al., 2001).
Maternal nutrition and muscle development
Heritability for carcass weight, marbling, and ribeye area are all high(> 0.39; Bertrand et al., 2004). Therefore, improving maternal skeletal muscle traits may be beneficial for subsequent male progeny. Muscle fiber numbers do not increase after birth, which makes the fetal stage crucial to skeletal muscle development (Stickland, 1978; Zhu et al., 2004). Skeletal muscle is particularly vulnerable to deficiencies because it is a lower priority in nutrient partitioning compared with the brain, heart, or other organ systems (Bauman et al, 1982; Close and Pettigrew, 1990). Thus, decreasing nutrient availability to the dam during gestation can result in fewer muscle fibers, which reduces muscle mass and impacts animal performance. Both muscle fiber number and
intramuscular adipocytes, which provide the sites for intramuscular fat accumulation or marbling formation, are influenced during fetal development (Tong et al., 2008; Du et al., 2010).
Maternal nutrition impacts fetal skeletal muscle formation at several important control points (Figure 6; Du et al., 2010). During the second to eighth month of gestation, the majority of muscle fibers form; therefore, reduction of muscle fiber formation during this stage through any source of stimuli (e.g., maternal nutrition) has long-lasting, irreversible consequences to the offspring (Du et al., 2010). The prospect of nutritional
management’s altering marbling may be greatest for the fetal stage, due to its importance in adipocyte formation, followed by the neonatal stage, early weaning stage (i.e., 150– 250 d of age), and finally, weaning and older stages (Du et al., 2010).
Larson et al. (2009) reported increased progeny birth BW from protein-supplemented dams, which suggests a potential alteration in fetal muscle growth.
Greenwood et al. (89) reported steers from cows nutritionally restricted during gestation had reduced body BW and HCW at 30 months of age compared with steers from
adequately fed cows. Both Larson et al. (2009) and Greenwood et al. (2004) reported that retail yield on a carcass-weight basis was greater in steers from NR cows, which indicates an increased propensity for carcass fatness is not a consequence of NR in utero.
Although fetal adipocyte development begins early in gestation, the majority of fetal adipose tissue is not deposited until the final few weeks of gestation (Symonds et al., 2007). Adipose tissue growth occurs through preadipocyte proliferation, impacting
formation of new mature adipocytes (hyperplasia) and increasing size and lipid storage capacity of mature adipocytes (hypertrophy). Beef cattle were fed one of three diets from d 60–180 of gestation: 100% of nutrient requirements, 70% of requirements, or 70% of requirements plus a rumen bypass protein supplement. Steer progeny from dams fed 70% of nutrient requirements plus supplement had numerical decreases in marbling scores when compared with steers from dams fed 100% of requirements (Long et al., 2012). Underwood et al. (2010) also reported increased tenderness in steers from dams grazed on improved pasture compared with steers from dams grazed on native range during mid-gestation.
Figure 6. Effects of maternal nutrition on bovine fetal skeletal muscle development. Dates are estimated mainly based on data from studies in sheep, rodents, and humans and represent progression through the various developmental stages. Nutrient restriction during midgestation reduces muscle fiber numbers, whereas restriction during late gestation reduces both muscle fiber sizes and the formation of intramuscular adipocytes (adapted from Du et al., 2010).
IMPACT OF LATE GESTATION NUTRITION ON PROGENY PERFORMANCE
Studies of maternal nutrition’s influence on progeny performance in domesticated livestock typically involve maternal undernutrition, overnutrition, or supplementation. The majority of these studies investigate maternal nutrition effects on male progeny growth and carcass characteristics. These studies have reported increased weaning BW, improved carcass characteristics, and improved health (Greenwood et al., 2004; Stalker et al., 2007; Larson et al., 2009; Underwood et al., 2010; Endecott et al., 2011) in steer progeny from improved dam nutrition. Although evidence for the influence of maternal
nutrition on female progeny growth, efficiency, and reproductive performance is limited, literature addressing this topic is increasing.
Impact of maternal nutrition on male progeny performance
As previously mentioned, studies have reported improved muscle development in steers from adequately fed dams when compared with progeny from nutrient restricted dams. Underwood et al. (2010) reported increased BW gains, final BW, and HCW in steers from cows grazing improved pasture from d 120 to 180 of gestation when
compared with progeny from cows grazing native range during that same time (Table 1). Steers from cows grazing improved pasture had increased back fat and tended to have improved marbling scores compared with steers from cows grazing native range.
Table 1. Effect of maternal nutrition on steer progeny performance Dietary treatment
Underwood et al. (2010)1 Radunz (2009)2
Item NR IP Hay Corn DDGS
Birth BW, kg 38.5 36.7 39a 43b 41b Weaning BW, kg 242a 256b 263a 275b 268a,b ADG, kg/d 1.49a 1.66b 1.53 1.57 1.55 HCW, kg 329a 348b 312 312 306 12-th rib fat, cm 1.24a 1.65b 1.22 1.27 1.30 Marbling score3 420 455 549a 506b 536ab a,b
Means within a study with different superscripts differ (P ≤ 0.05). 1
NR = dams grazed native range from day 120 to 180 of gestation; IP = dams grazed improved pasture from day 120 to 180 of gestation.
2
Hay= dams offered a diet of grass hay beginning on day 209 of gestation; Corn = dams offered limit fed diet of corn beginning on day 209 of gestation; DDGS = cows offered a limit-fed diet of distillers grains with solubles beginning on day 209 of gestation.
3
To determine the effect dietary energy source had on progeny calf performance, Radunz (2009) offered cows 1 of 3 diets during gestation beginning on approximately d 209: hay (fiber), corn (starch), or distillers grains with solubles (fiber plus fat). Corn and distillers grains diets were limit fed to ensure isocaloric intake among treatments. Results indicated reduced birth BW for calves from dams fed grass hay when compared with calves from the other two groups (Table 1), with an increase (P ≤ 0.05) in calf BW
reported through weaning when comparing calves from corn fed dams to hay fed dams. Feedlot performance among treatments was not different; however, calves from hay fed dams required 8 and 10 more d on feed to reach a similar fat thickness when compared with calves from distillers and corn fed dams, respectively.
Table 2. Effect of maternal protein supplementation on steer progeny performance Dietary treatment
Stalker et al. (2007)1 Stalker et al. (2006)1 Larson et al. (2009)2
Item NS SUP NS SUP NS SUP
Weaning BW, kg 210a 222b 210a 216b 233a 240b DMI, kg/d 11.15a 12.05b 8.48 8.53 8.98x 9.19y ADG, kg/d 1.60x 1.68y 1.57 1.56 1.66 1.70 Feed:gain 6.97 7.19 5.41 5.46 5.37 5.38 HCW, kg 347a 365b 363 369 365a 373b Choice, % - - 85 96 71 85 Marbling score3 449 461 467 479 445a 492b a,b
Means within a study with different superscripts differ (P ≤ 0.05). x,y
Means within a study with different superscripts differ (P ≤ 0.10). 1
NS= dams did not receive protein supplement while grazing dormant Sandhills range during the last third of gestation; SUP = dams were supplement 3 times per week with the equivalent of 0.45 kg/d of 42% CP cube (DM basis) while grazing dormant Sandhills range during the last third of gestation.
2
NS = dams did not receive protein supplement while grazing dormant Sandhills range or corn residue during the last third of gestation; SUP = dams were supplemented 3 times per week with the equivalent of 0.45 lb/d of a 28% CP cube (DM basis) while grazing dormant Sandhills range or corn residue during the last third of gestation.
3
Radunz (2009) reported calves born to cows limit fed distillers grains had reduced net return ($80.29/calf) compared with hay ($106.83/calf) and corn ($110.67/calf) fed cows at the end of the feedlot phase. The increase return per calf for the hay and corn diets can be attributed to the increased HCW for calves from those treatments, resulting in increased total carcass value of $37.66/calf for hay fed cows and $31.07/calf for corn fed cows. Calf purchase cost and feed cost for the cow during the treatment period were similar among groups. Furthermore, other costs, which included yardage, calf feed costs, and treatment costs were similar among treatments. However, the carcass value for calves from hay fed cows was greater compared with calves for corn and distillers fed cows (Radunz, 2009).
Stalker et al. (2006, 2007) reported steer progeny from dams supplemented the equivalent of 0.45 kg/d (42% CP, DM basis) cube during late gestation had no difference in calf birth weight when compared with steers from non-supplemented dams.
Conversely, Larson et al. (2009) using the same cow herd, reported an increase in calf birth weight when comparing calves born to dams supplemented the equivalent of 0.45 kg/d (28% CP, DM basis) cube during late gestation to calves from non-supplemented dams. In the study reported by Stalker et al. (2006) cows were utilized in a switchback design whereas cows utilized by Larson et al. (2009) remained on the same treatment over the 3 year study.
Protein supplementation during late gestation increased weaning BW, ADG to weaning, and proportion of calves weaned when comparing calves from supplemented to non-supplemented dams grazing dormant winter range (Stalker et al., 2006, 2007; Larson et al., 2009; Table 2). Stalker et al. (2006) reported no differences in steer progeny
feedlot performance and carcass characteristics when comparing progeny from supplemented and non-supplemented dams. However Larson et al. (2009) reported increased ADG, HCW, and marbling scores in steers from supplemented dams. Furthermore, a greater proportion of steers from supplemented dams graded USDA Choice and USDA Choice or greater when compared with steers from non-supplemented dams. Non-supplemented cows in Larson et al. (2009) may have been under greater nutritional stress than Stalker et al. (2006) as average weaning date was approximately one month later and possibly had greater impact on fetal development.
Table 3. Effect of maternal weaning date and winter grazing treatment on progeny performancea.
Wean date Winter grazing treatmentb
Item October December WR0 WR1 WR2 CR
Birth weightc, kg 35 34 33 34 36 35 October weight, kg 213e 206f 195g 210h 216h 218h Steer progeny Initial BW, kg 237 232 227 235 234 243 DMI, kg/d 10.4 11.0 10.5 10.5 10.8 10.9 ADG, kg 1.61 1.66 1.55 1.62 1.69 1.68 G:F4 0.154 0.152 0.147 0.153 0.157 0.154 Heifer progeny December weight, kg 228e 209f 201g 218h 228h 227h Prebreeding weight, kg 297e 270f 267g 286h 290h 293h Cycling rated, % 45.6 33.2 40.6 27.6 47.1 42.8 Pregnancy rate, % 69.0 71.3 60.8 73.8 71.4 73.6 a
Adapted from Rolfe et al. (2011). b
Winter grazing treatments: WR0 = dams grazed winter range without supplement; WR1 = dams grazed winter range and received 0.45 kg/day 32% CP (DM Basis) supplement; WR2 = dams grazed winter range and received 0.91 kg/day 32% CP (dry matter basis) supplement; CR = dams grazed corn residue without supplement.
c
Wean date × Winter grazing treatment interaction (P < 0.05). d
Considered cycling if blood serum progesterone concentrations were > 1 ng/mL. e,f
Means with different superscripts differ within wean date (P < 0.05). g,h
Rolfe et al. (2011) evaluated the effects of weaning date and pre-partum plane of nutrition on cow-calf productivity utilizing a 2×4 factorial design. Beef cows were assigned to graze either (CR) or dormant winter range (WR) during the last trimester of gestation. Cows grazing WR were assigned one of three supplement (28% CP, DM Basis) levels: no supplement (WR0), 0.45 kg/d (WR1), or 0.91 kg/d (WR2). Cows from each of the treatments were also assigned to either early (OCT) or late (DEC) weaning treatments. Rolfe et al. (2011) reported no difference in BW and performance of steer calves while in the feedlot among treatments (Table 3). There was no difference in carcass characteristics for steers based on maternal supplement level (Rolfe et al., 2011). However, Summers et al. (2011) reported increasing maternal nutrition during late gestation improves steer calf feedlot performance and carcass characteristics. Cows were offered either 0.95 kg/d or 0.37 kg/d (31.6% CP, DM Basis) distillers based supplement from December through February for high and low nutrition grouped cows, respectively. During calving (March through April) high nutrition cows received 5.2 kg/d (DM Basis) meadow hay and low nutrition cows received 4.99 kg/d (DM Basis) meadow hay. Supplement and hay were offered based on manager discretion each of the 2 yr. There was a yr × treatment interaction, with steers from high nutrition cows in yr 1 having greater BW at reimplant and slaughter compared with steers from low nutrition cows in yr 1 or 2, and high nutrition cows in yr 2 (Summers et al., 2011). There was also an improvement in carcass characteristics for steers from high nutrition cows compared with low nutrition cows. Steers from high nutrition cows had increased marbling scores
compared with steers from low nutrition cows. Furthermore, there was a greater proportion of steer calves from high nutrition yr 2 grading USDA modest or greater
compared with steers from low nutrition cows in yr 1 (Summers et al., 2011). This study utilized only a small subset of the steer calves available, along with the differences in yr 1 and 2 treatment levels due to manager discretion likely caused the yr to yr variation. It is possible protein supplementation at 0.45 kg/d may not be capturing all the potential gains for steer progeny from supplemented cows. However, Rolfe et al. (2011) did not see any increase in calf performance by increasing maternal supplementation level in the first year of their study. Thus research is still needed to determine the adequate amount of maternal protein supplementation to maximize cow and calf production but not hinder profitability.
Economic impact of maternal protein supplementation
Stalker et al. (2007) reported a $7.72/cow increase in net revenue for non-supplemented compared with non-supplemented cows at weaning. This increase in net revenue is due to the increased feed costs of supplement cows owning to supplement and delivery of the supplement. These results differ from data reported by Stalker et al. (2006) reporting a $25.38/calf increase in calf value if dams were supplemented protein. This increase was due to an increase in the number of calves weaned for supplemented compared with non-supplemented dams, as well as a 6 kg increase in weaning BW for calves from supplemented cows. Larson et al. (2009) also reported increased net returns at weaning if calves were born from supplemented dams. Net returns at slaughter were reported to be $25.60- 45.76/calf greater, for calves from protein supplemented calves compared with steers born to non-supplemented dams (Stalker et al., 2006, 2007; Larson et al., 2009). Furthermore, Summers et al. (2011) reported an $11.88 increase in net profit for steer calves from high nutrition cows compared with low nutrition cows. The
improvement in net returns in these four studies can be attributed to increased HCW, improved USDA quality grade resulting in greater premiums for the carcass, or due to increased number of carcasses resulting from increased number of calves weaned from protein supplemented dams.
Impact of maternal undernutrition on female progeny performance
The majority of studies evaluating the effect of maternal nutrition on heifer progeny performance are limited to first-calf-heifer data. However, Roberts et al. (2009a) conducted a study over a seven-year period monitoring the production of composite (1/2 Red Angus, 1/4 Charolais, 1/4 Tarentaise) cows from dams fed either marginal or adequate levels of harvested feeds from December to March (Table 4). Groups of cows were placed in separate pastures, and a supplement of alfalfa cake or hay, depending on yr, was provided either daily or every other d at an average of 1.8 kg/d for adequate cows or 1 kg/d for marginal cows. During the winter supplementation period, pasture forage was generally accessible for grazing. On d when snow limited pasture availability, cows were fed at a rate of 10.9 and 9.1 kg/d for adequate and marginal cows, respectively. Each year at weaning, heifer calves were assigned to a pen for a 140-d feeding period and offered either a control diet, fed to appetite, or a restricted diet, offered at 80% of the amount consumed by heifers on the control diet adjusted to a common BW. Heifers were managed similarly after the feeding period through the breeding season and fall. Control heifers were then provided the adequate level of feed during each subsequent winter, and restricted heifers were provided marginal levels. Heifers born to marginal dams had greater BW later in life compared with heifers of adequate dams (Roberts et al., 2011). This difference may be caused in part by the increased BCS of the cows from marginal
dams. Furthermore, calves born to restricted dams and marginal granddams were lighter (P < 0.01) at both birth and weaning compared with calves born to control dams and adequate granddams; however, pregnancy rates for bred heifers did not differ (Roberts et al., 2009a).
Table 4. Effects of level of feed input provided to dam and to progeny on progeny performancea.
Level of winter supplement to damb
Marginal Adequate
Heifer development and treatmentc Restricted Control Restricted Control
Five year weightd, kg 515 530 490 505
BCS at 5 yre 4.9 5.1 4.7f 5.0
Retention at 5 yr, % 48 46 39 49
Calf birth weight, kg 33.6f 35 35 35
Calf weaning weighte, kg 196f 201 202 204
a
Data from Roberts et al. (2009, 2011). b
Level of supplementation provided to cows from December to March. Marginal= equivalent of 1.1 kg/d; Adequate= equivalent of 1.8 kg/d.
c
Dietary level offered to heifers during 140-day postweaning development period. Restricted= 80% of feed provided to control and 1.1 kg/d supplement each subsequent winter. Control= fed ad libitum during postweaning and 1.8 kg/d supplement each winter. d
P < 0.01 for effect of dam treatment and heifer development treatment. e
P < 0.001 for interaction of dam treatment and heifer development treatment. f
Differs from others in same row.
Effect of late gestation protein supplementation on heifer progeny performance
Rolfe et al. (2011) reported birth BW was affected by previous maternal weaning date and grazing treatment. Progeny of OCT-weaned dams receiving 0.91 kg/d protein supplement while grazing WR (WR2) had greater (P < 0.01) birth BW than calves from non-supplemented dams grazing WR (WR0) (Table 3). Calves from DEC-weaned WR0 dams had reduced (P < 0.01) birth BW compared with all other groups except DEC-weaned calves from dams grazing WR and receiving 0.45 kg/d protein supplement
(WR1). October body BW was reduced 15-23 (±3 kg) (P < 0.01) in calves born to WR0 dams compared with all other groups. Dam winter treatment also affected December and prebreeding BW; WR0-born calves had reduced (P < 0.03) BW compared with other winter treatment groups (Rolfe et al., 2011).
Martin et al. (2007a) conducted a study with cows grazing WR during late gestation. One group received a 42% CP (DM Basis) cube offered three times weekly at the equivalent of 0.45 kg/d, and another group received no supplement. After calving, pairs were offered cool-season grass hay or placed on sub-irrigated meadows during early lactation. Calf birth BW was not different between heifer progeny from supplemented and non-supplemented dams; however, heifer progeny from supplemented cows had increased adjusted 205-d weaning BW (226 vs. 218 ± 7 kg), prebreeding BW (276 vs. 266 ± 9 kg), BW at pregnancy diagnosis (400 vs. 386 ± 31 kg), and improved pregnancy rates (93 vs. 80%) compared with heifers from non-supplemented dams (Table 5). Martin et al. (2007a) also reported after a subset of these heifers were placed in a Calan gate individual feeding system, DMI, ADG, and residual feed intake (RFI) did not differ between heifer progeny from supplemented and non-supplemented dams.
Using the same cow herd (Table 5), Funston et al. (2010b) offered a distillers-based supplement (28% CP; DM Basis) three times weekly at the equivalent of 0.45 kg/d or no supplement during late gestation to cows grazing either WR or CR. Calf weaning BW was greater (P = 0.04) for heifers from protein-supplemented dams (232 vs. 225 ± 6 kg; Funston et al., 2009b). Martin et al. (2007a) also reported, although not significant (P
= 0.12), increased weaning BW for heifers from protein-supplemented dams. Funston et al. (2010b) also reported heifers from protein-supplemented cows attained puberty 14 d
earlier than heifers from non-supplemented dams (P = 0.09). Furthermore, there was a trend (P = 0.13) for higher pregnancy rates when comparing heifers from protein-supplemented dams with heifers from non-protein-supplemented dams, possibly related to
decreased age at puberty. Both studies conducted by Martin et al. (2007a) and Funston et al. (2009b) utilized 2×2 factorial designed experiments. The slight differences reported between these authors may be explained by differences in study design and animal allotment to treatment. Both treatment factors studied by Funston et al. (2009b) were applied to the cow prepartum, and cows in this study remained on the same treatment all 3 yr. In contrast, Martin et al. (2007a) studied the effect of protein supplementation or no supplementation during late gestation, but also the effect of grazing cow/calf pairs on sub-irrigated meadow or provided meadow hay during early lactation. The researchers in this experiment utilized a cross over design in the first two yr of the study and randomly assigned cows to a treatment group during the third yr of the experiment. Also Martin et al. (2007a) utilized a 42% crude protein supplement consisting of 50% sunflower meal and 47% cottonseed meal, whereas Funston et al (2010b) provided a 28% crude protein supplement consisting of mostly dried distillers grains with solubles. Utilizing NRC (2000) feed values, the supplement fed by Martin et al. (2007a) contained approximately 33% rumen undegradable protein (RUP), whereas the supplement provide by Funston et al. (2010b) provided approximately 48% of the protein as RUP. Increased levels of RUP would provide increased levels of diet supplied amino acids to the intestine for utilization by the animal, compared with protein degraded in the rumen and utilized by rumen microbes.
Table 5. Effect of maternal protein supplementation on heifer progeny performance. Dietary treatment
Martin et al. (2007)a Funston et al. (2010b)b
Item NS SUP NS SUP
Birth weight, kg 35 36 35 35
Weaning weight, kg 207 212 225d 232e
Adj. 205-day weight, kg 218d 226e 213 217
Dry matter intake, kg/d 6.50 6.75 9.48 9.30
Average daily gain, kg/d 0.41 0.40 0.85 0.79
Residual feed intake -0.12 0.07 0.08 -0.04
Final BWc, kg 290x 304y — — Age at puberty, d 334 339 366x 352y Prebreeding weight, kg 266d 276e 317 323 Pregnancy diagnosis weight, kg 386d 400e 364x 368y Pregnant, % 80d 93e 80 90 Calved in first 21 d, % 49d 77e 85 77 a
NS = dams did not receive protein supplement while grazing dormant Sandhills range during the last third of gestation; SUP = dams were supplemented three times per week with the equivalent of 0.45 kg/d of 42% CP cube (dry matter basis) while grazing dormant Sandhills range during the last third of gestation.
b
NS = dams did not receive protein supplement while grazing dormant Sandhills range or corn residue during the last third of gestation; SUP = dams were supplemented three times per week with the equivalent of 0.45 kg/d of a 28% CP cube (dry matter basis) while grazing dormant Sandhills range or corn residue during the last third of gestation. c
Final weight of heifers after 84-day individual feeding period. d,e
Means within a study with different superscripts differ (P ≤ 0.05). x,y
Means within a study with different superscripts differ (P ≤ 0.10).
Warner et al. (2011) reported no differences in pregnancy rates for heifers from dams grazing CR and receiving protein supplement compared with dams grazing CR and receiving no supplement during late gestation. These results coincide with data presented by Funston et al. (2010b) in which pregnancy rates for heifers from protein-supplemented cows were impacted by dam winter grazing treatment, with pregnancy rates being similar for heifers born to cows grazing CR regardless of protein-supplementation treatment (Funston et al., 2010b). Corah et al. (1975) reported heifers born to primiparous heifers fed 100% of their dietary energy requirement during the last 90 d of gestation were