Key market indicators at a glance
SERIES
TWO
Cell Culture
Dashboard
Sample Data
© 2005-2008 Percepta Associates, Inc. 760 597 9236 www.perceptaassociates.com
1
The Life Science Dashboards™ from Percepta Associates, Inc.
Copyright 2008 by Percepta Associates, Inc., 7040 Avenida Encinas, Suite 104-365, Carlsbad CA 92011. All rights reserved. This report may not be reproduced by any means in whole or in part without written permission from Percepta Associates, Inc. Reproduction and redistribution is strictly forbidden by United States and international law.
Copies of this report may be ordered from Percepta Associates. To place an order, call 760-597-9236 or visit the publications section of our webpage athttp://www.perceptaassociates.com/publications/.
Notice: The information, data and estimates in this report have been obtained from sources believed to be reliable. Every reasonable effort has been made to verify their accuracy. Information contained in this report is very time-sensitive. Please note the publication date. While all reasonable steps have been taken to ensure the accuracy of the information presented, Percepta Associates cannot accept responsibility for inadvertent errors or omissions. Percepta Associates also takes no responsibility for any incorrect information supplied to us by survey participants. The market information contained herein is based on survey responses and information obtained from the public domain and therefore is subject to interpretation.
Key indicators shown in each segment specific dashboard include: Market size
Market share
Market growth and sample/reaction throughput rates Customer satisfaction
Propensity to switch Competitive intensity Perceived pricing Top suppliers
Technique usage frequency Fastest growing techniques Primary downstream applications
Quantitative results are graphically represented for each question and when applicable verbatim quotations are included for qualitative support and clarification. An overview “key market indicator dashboard” is provided for quick reference.
Recognizing that professionals in research supply companies need timely, relevant and practical life science market intelligence to form a fact-based foundation for decision making, Percepta Associates developed The Life Science Dashboard™ series of market intelligence reports.
The Life Science Dashboard™ is the most accessible source for current, segment specific, life science market intelligence in the industry. Designed and implemented by industry experts, The Life Science Dashboard™ provides key market indicators compiled from the survey responses of thousands of qualified researchers actively engaged in the relevant segment applications.
Unlike other reports, The Life Science Dashboard™ features an at-a-glance format that provides rapid access to actionable key market indicators in an easy to understand framework.
© 2005-2008 Percepta Associates, Inc. 760 597 9236 www.perceptaassociates.com
3
Percepta launched Series One of the Life Science Dashboards™ inearly 2007, designed to establish a benchmark of the existing market landscape. The release of Series Two of each Dashboard furthers our primary objective of regularly sampling the research landscape to give Dashboard readers a comprehensive, relevant and dynamic view of how important life science markets are adapting to new products, new competitors, and new sales and marketing strategies.
Note that throughout this report, you will see the following icons:
These icons and their associated values represent the changes observed in the 2008 Cell Culture Dashboard data set in comparison to the corresponding data from the 2007 Cell Culture Dashboard.
For example, in Figure 15 of this report, the percentage of respondents using growth and attachment factors on a weekly basis is 33.1%, an increase of 6.2 percentage points over the 2007 Cell Culture Dashboard value of 26.9%.
There are instances where comparisons to the 2007 Cell Culture Dashboard are not possible, due to rewording of questions for the purposes of clarity that were necessary to improve the overall quality of the data and the final Dashboard report in general.
The Life Science Dashboards™ from Percepta Associates, Inc.
Life Science Dashboards™ Available.
Gene Expression Profiling Dashboard
April 2008 Series Two Cat. # 0804GEP
February 2007 Series One Cat. # 0702GEP
Gene Silencing Dashboard
September 2008 Series Two Cat. # 0809GSL
February 2007 Series One Cat. # 0702GSL
Nucleic Acid Separation Dashboard
November 2008 Series One Cat. #0811SEP
Nucleic Acid Amplification Dashboard
Coming Soon Series Two Coming Soon
January 2007 Series One Cat. # 0701NAA
Transfection Dashboard
Coming Soon Series Two Coming Soon
January 2007 Series One Cat. # 0701TFN
Cell Culture Dashboard
December 2008 Series Two Cat. # 0812CCT
January 2007 Series One Cat. # 0702CCT
Nucleic Acid Purification Dashboard
Coming Soon Series Two Coming Soon
January 2007 Series One Cat. # 0701NAP
For more information on these Life Science Dashboards™ and upcoming Dashboards please visitwww.lifesciencedashboard.com.
% Increase from 2007 Life Science Dashboard % Decrease from 2007 Life Science Dashboard
The Life Science Dashboard™ is produced by Percepta Associates, Inc. Percepta is a strategic consultancy firm focused on helping life science tools companies. Since our founding in 2005 we have provided a broad range of specialized market research, strategic and tactical planning services to life science tool providers. Our team is comprised of industry experts with first hand practical experience and a proven track record of successful leadership in life science companies. It is precisely our in-depth knowledge and practical experience in this segment that makes Percepta unique.
Percepta offers custom primary market research services, in addition to periodically publishing a number of segment specific Life Science Dashboards™. Our primary research services utilize the following research methodologies – online surveys, focus groups and telephone or face-to-face in-depth interviews to capture the voice of the customer. Percepta maintains a profiled panel of over 33,000 life scientists worldwide. This panel provides a rich and qualified source of timely input for the Life Science Dashboard™ surveys. Our panel was built, and is continually supplemented, with researcher contacts from scientific societies, journals, scientific meeting participants and other qualified sources.
For more information about Percepta’s market research and consulting services please visit our www.perceptaassociates.com or call 760 597 9236.
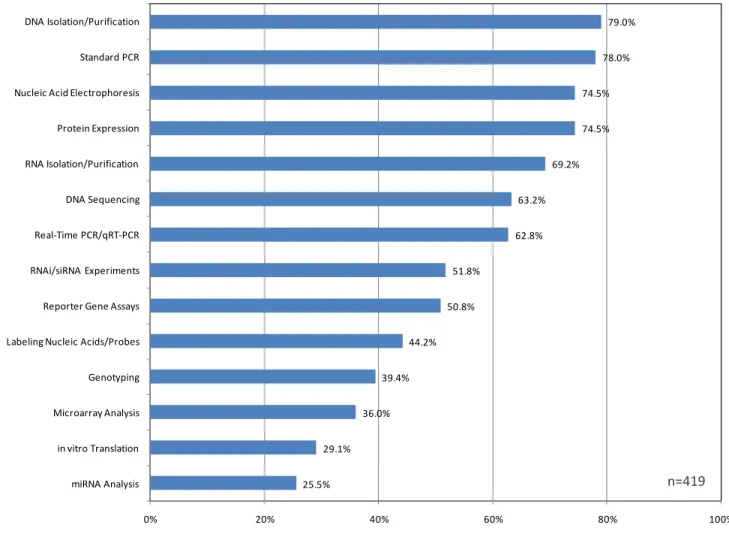
© 2005-2008 Percepta Associates, Inc. 25.5% 29.1% 36.0% 39.4% 44.2% 50.8% 51.8% 62.8% 63.2% 69.2% 74.5% 74.5% 78.0% 79.0% 0% 20% 40% 60% 80% 100% miRNA Analysis in vitro Translation Microarray Analysis Genotyping Labeling Nucleic Acids/Probes Reporter Gene Assays RNAi/siRNA Experiments Real-Time PCR/qRT-PCR DNA Sequencing RNA Isolation/Purification Protein Expression Nucleic Acid Electrophoresis Standard PCR DNA Isolation/Purification
760 597 9236 www.perceptaassociates.com
5
Figure 6: Percentage of Respondents Performing Various Life Science Techniques
at Least a Few Times per Year
Q7. How often do you perform each of the following techniques? Please make one selection for each technique (required). Four techniques performed by more than 70% of respondents at least a few times per year
Weekly 83.3% A few times per month
7.0%
A few times per year 3.2%
Do not currently use, but plan on using in the next 12 months
4.0%
Do not currently use, and no plans to use in the next 12
months 2.5%
Frequency of Performance ∆2007 LS Dashboard
Weekly -4.0%
A few times per month 0.0% A few times per year -0.6% Do not use – but plan to in
the next 12 months 4.0% Do not use – no future plans
to use 0.6% 90.3% of respondents use basal media on at least a monthly basis
Q9. How often do you use the following types of mammalian cell culture reagents? Please make one selection per row (required).
© 2005-2008 Percepta Associates, Inc. Invitrogen/Gibco 55.1% Sigma-Aldrich 10.3% Homemade Reagents 9.3% CellGro by Mediatech 9.0% Hyclone/Thermo Fisher (includes Pierce) 6.3% Cambrex 1.7% Other 8.3% 760 597 9236 www.lifesciencedashboard.com
7
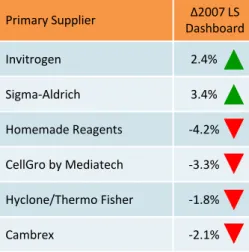
Figure 19: Respondent’s Primary Supplier for Balanced Salt Solutions
Over half of respondents named Invitrogen as their primary supplier
n=301
Q10. If you use the following cell culture medias or
supplements, please select your primary supplier. Primary Supplier ∆2007 LS Dashboard Invitrogen 2.4% Sigma-Aldrich 3.4% Homemade Reagents -4.2% CellGro by Mediatech -3.3% Hyclone/Thermo Fisher -1.8% Cambrex -2.1%