EFFECT OF OBESITY ON MOTOR VEHICLE CRASH INJURIES THROUGH COMPUTATIONAL MODELING AND SIMULATION
by IL HWAN KIM
JONG-EUN KIM, COMMITTEE CHAIR DAVID L. LITTLEFIELD
ALAN M. SHIH
A THESIS
Submitted to the graduate faculty of The University of Alabama at Birmingham, in partial fulfillment of the requirements for the degree of
Master of Science BIRMINGHAM, ALABAMA
Copyright by IL HWAN KIM
iii
EFFECT OF OBESITY ON MOTOR VEHICLE CRASH INJURIES THROUGH COMPUTATIONAL MODELING AND SIMULATION
IL HWAN KIM
MECHANICAL ENGINEERING ABSTRACT
The growing number of obese individuals in most industrialized countries has be-come an important social issue. Motor vehicle crashes (MVCs) are the leading cause of injury, yet the role of obesity (either cushion or momentum effect) on MVC injuries is still unknown. The objective of this study is to elucidate the effect of obesity on body in-juries in MVCs through computational modeling and simulation. MADYMO, a mathe-matical dynamic simulation code, is used for model simulation of a vehicle frontal impact with airbag systems, seatbelts and simplified vehicle interior components. Male and fe-male obese dummy models (body mass index greater than 30) are developed based on the MADYMO Hybrid III 50th percentile male and 5th percentile female model, respectively. To represent subcutaneous fat geometry and properties, finite element models were created based on the geometry data reconstructed from MRI datasets of obese subjects. The fat model with Mooney-Rivlin hyperelastic properties is integrated into the standard dummy models. Four injury criteria on head, neck, thorax and lower extremity are as-sessed against various settings of deceleration pulses and occupant restraint systems. From the simulation results, obese males have a much higher risk of injury (especially head and thorax) than standard males, while obese females have slightly increased risk of head and thorax injury. The results are consistent with the findings from real world crash data in literature.
iv
ACKNOWLEDGEMENT
This project was supported by a grant from the National Institute of Biomedical Imaging and Bioengineering of the National Institutes of Health (grant R01EB006552-01A1, Obesity-Related Variables and Motor Vehicle Injury).
I appreciate my research committee chairman, Dr. Jong-Eun Kim, for his support, inspiration, and encouragement throughout my studies and with assistance with writing and presenting results. I also extend my gratitude to committee members Dr. David L. Littlefield, for his continual support and guidance, and Dr. Alan M. Shih, for invaluable information, help, and guidance.
v
TABLE OF CONTENTS
Page
ABSTRACT ... iii
ACKNOWLEDGEMENTS... iv
LIST OF FIGURES ... vii
LIST OF TABLES ... ix
LIST OF ABBREVIATIONS ... x
CHAPTER 1 INTRODUCTION ... 1
Obesity and Motor Vehicle Crash Injuries ... 1
Vehicle Design and Crash Analysis ... 4
Objective ... 5
2 SIMULATION TOOL AND INJURY CRITERIA ... 6
Simulation Tool ... 6
MADYMO ... 6
System of Units ... 9
Injury Criteria ... 10
Head Injury Criterion ... 10
Biomechanical Neck Injury Predictor ... 10
Combined Thoracic Index ... 11
The Femur Force Criterion ... 12
3. MATERIALS AND METHODS ... 13
Development of Obese Models ... 13
MRI Data and Imaging process... 13
Obese Models ... 15
Height Models ... 23
Vehicle Design ... 25
vi
Seatbelts ... 26
Airbag system ... 28
Deceleration Pulses ... 29
Simulation Studies ... 30
Case study 1: Pulse Variables ... 31
Case study 2: Mass flow rates of Airbag Variables ... 31
Case study 3: Restraint systems ... 31
Case study 4: Other cases ... 32
4 RESULTS ... 33
MADYMO Simulation ... 33
Baseline Cases ... 34
Case Study 1 ... 35
Case Study 1-1. The baseline pulse times 1.2 cases ... 35
Case Study 1-2. The baseline pulse times 1.4 cases ... 37
Case Study 2 ... 40
Case Study 2-1. 10% Depowered Airbag Cases ... 40
Case Study 2-2. 20% Depowered Airbag Cases ... 41
Case Study 3 ... 44
Case Study 3-1. Without airbag system... 44
Case Study 3-2. Acceleration pulse 1.2 times and; without the airbag system ... 45
Case Study 3-3. Without seatbelts ... 47
Case Study 3-4. Without pretensioner and load limiter... 48
Case Study 3-5. The maximum force of load limiter set to 2kN ... 50
Case Study 4 ... 54
Case Study 4-1. Increased height cases ... 54
Case Study 4-2. Steering wheel of 10 degree tilted downward ... 55
Case Study 4-3. Friction coefficient between seat and; dummy set to 0.5 ... 56
5 DISCUSSION ... 60
6 CONCLUSIONS AND RECOMMENDATIONS ... 65
LIST OF REFERENCES ... 67
APPENDIX A SERIES OF CAPTURED IMAGE IN MVCs ... 70
B LOAD LIMITER TESTS ... 75
vii
LIST OF FIGURES
Figure Page
1 Joints of MADYMO ... 8
2 Model of Male BMI 30 in Prone position ... 14
3 Male BMI 30 with image processing data ... 15
4 Sample ellipsoid data ... 16
5 The process of surface extraction ... 16
6 The process of a fat-vest modeling ... 17
7 Mesh models of 2D skin and 3D subcutaneous ... 18
8 Hybrid model of obese dummy... 20
9 Fat- vests Comparison ... 21
10 Dummy model comparison by BMI ... 23
11 50th percentile male 178 cm and 184 cm ... 24
12 Simplified Vehicle Model ... 26
13 3 Point Belts with retractor systems, buckle, lap anchor, and D ring ... 27
14 Function of Pretensioner ... 28
15 Function of Load limiter... 28
16 Mass flow function of baseline airbag... 29
17 The baseline deceleration pulse ... 30
18 Images of crash simulation by time step 30 milliseconds (ms) ... 34
viii
20 HIC of male BMI 35 ... 47 21 Injury criteria of normalized mean values with BMI ... 62
ix
LIST OF TABLES
Table .. Page
1 Units in MADYMO ... 9
2 Proposed Critical Intercept Values for Nij ... 11
3 Material Properties of a Fat-vest ... 19
4 Mass distribution of male dummy models ... 22
5 Mass distribution of female dummy models ... 22
6 Joint Re-Distribution, 50th Male Case (6 cm up) ... 24
7 Variables for MADYMO simulation and case studies ... 31
8 Male injuries result table of pulse cases ... 39
9 Female injuries result table of pulse cases ... 39
10 Male injuries result table of airbag cases ... 43
11 Female injuries result table of airbag cases... 43
12 Male injuries result table of restraint cases ... 52
13 Female injuries result table of restraint cases ... 53
14 Male injuries result table of other cases ... 58
15 Female injuries result table of other cases ... 59
16 Head injury summary data ... 61
17 Neck injury summary data ... 61
18 Thorax injury summary data ... 61
x
LIST OF ABBREVIATIONS
BMI body mass index
CTI Combined thoracic index
DICOM Digital Imaging and Communications in Medicine
FE Finite Element
FEM Finite Element Method
FFC The Femur Force Criterion
FMVSS Federal Motor Vehicle Safety Standards HIC Head injury criterion
MADYMO MAthematical DYnamic MOdels
mAIS maximal Abbreviated Injury Scale
MB multi body
MVCs motor vehicle crashes
NASS CDS National Automotive Sampling System's Crashworthiness Data System
NHTSA National Highway Traffic Safety Administration
1 CHAPTER 1
INTRODUCTION
Obesity and Motor Vehicle Crash Injuries
In 2007, according to the National Highway Traffic Safety Administration (NHTSA), 41,059 people died and 2,491,000 of people were injured in motor vehicle crashes (MVCs) which resulted in an economic cost of $230.6 billion (NHTSA, 2008).
Automotive technology has notably developed in the last few decades. Vehicles have been upgraded by strengthening the chassis and installing anti-lock brake systems, electronic brake force distribution systems, tire pressure monitoring systems, traction control systems, limited slip differential systems, and electronic stability programs. Des-pites these improvements of vehicle technology, more than 40,000 people still died from MVCs and incurring huge medical costs.
Meanwhile, the rate of growth for the overweight and obese population, with a body mass index (BMI, kg/m2) calculated by body weight divided by the square of height, of greater than 30, had gradually increased until 1980; however, from 1980 the obese rates increased rapidly. For example, thirty-two states have an obesity rate equal to or greater than 25%. In six of these states (Alabama, Mississippi, Oklahoma, South Caro-lina, Tennessee, and West Virginia), 30% or more of the residents are considered obese (Center for Disease Control and Prevention, 2008).
2
Due to this rise in the levels of obesity in the population, a debate over the role of obesity on MVC injuries has surfaced. Some researchers have examined the association between obesity and body injuries in MVCs.
Arbabi et al. (2003) reviewed the database of the University of Michigan Program for Injury Research and Education. Three statistical groups were analyzed: lean, over-weight, and obese. They found that the overweight cohort showed a decreased abdominal maximal Abbreviated Injury Scale (mAIS) score compared with the lean cohort, and the obese cohort was almost identical with the lean cohort. Furthermore, the lower extremity mAIS score of overweight and obese cohorts increased compared with the lean cohort. For abdominal injury cases, the overweight cohort was safer than the lean cohort, so they concluded that increasing tissue, subcutaneous fat, plays a protective role from MVCs.
Wang et al. (2003) investigated the data set of the Crash Injury Research Engi-neering Network (CIREN). They noticed great individual variability during medical care of traumatically injured patients. For their study, Wang et al. focused on the differences of a human body, for example, bones, fat, muscle and other hard and soft tissues. Among these, the depths of subcutaneous fat were measured by a computed tomography. Women were also found to have significantly greater subcutaneous fat depth than men and also have notably decreased injury severity to the abdominal region. Similar trends were found from male cases, but with no statistical meaning. It was concluded that increased subcutaneous fat may be protective for the abdominal region against MVCs through cu-shioning.
3
Mock et al. (2002) examined the National Automotive Sampling System's Crash-worthiness Data System (NASS CDS) from 1993 to1996. Two outcome variables, death within 30 days of MVCs and injury severity score of 9 or higher, were analyzed. This study found an association between increased body weight and increased mortality. From a data set with 27,263 cases, the mean mortality was 0.67%. From the weight category, mortality for those less weighing than 60 kg was 0.37, but those weighing greater than 120 kg was 1.65. From the BMI category, mortality for a person with a normal BMI (20~24) was 0.60, but for those who were severely obese (40 +) was 1.44. They found that the odds ratio for death was augmented 1.013 for each kilogram increase in body weight. The study concluded that increased body weight of occupants was related with increased mortality in MVCs.
Neville et al. (2004) examined 242 patients at an academic level I trauma center. They divided the patients to two groups by BMI 30. Two groups, obese and non-obese, were analogous in age, sex, injury severity score, mechanisms of injury, and injury pat-terns. They found that the obese group had a higher incidence of multiple organ failures (13% vs. 3%) and mortality (32% vs. 16%). They concluded that obesity was an inde-pendent predictor of mortality following severe blunt trauma.
Zhu et al. (2006) investigated National Automotive Sampling System's Crashwor-thiness Data System (NASS CDS) with the question of how obesity affected MVCs. They used a data set with 30,667 cases and classified them by a series of criteria: BMI, gender, seatbelt use, velocities, type of collisions, drug or alcohol use, and airbag dep-loyment. They found that the fatality rate for MVCs was 0.87 % and 0.43 % among male and female drivers, respectively. Obese males showed the greatest increase in risk for
4
death due to frontal MVCs. Interestingly, they found that male drivers whose BMI is higher than 35 or less than 22 had a significant increase of fatalities, but female drivers did not shows significant association between BMI and fatalities.
Cormier (2008) examined the NASS CDS database for the years 1993-2005. The variable of age was also added. This study focused on chest injuries and analyzed the as-sociation of BMI, gender, age, and delta V from the database. Obese males showed a higher risk ratio than lean males, but obese females did not show prominent risk. Obese females also had a slightly less risk of chest injury.
Vehicle Design and Crash Analysis
Over the past a few decades, several studies have been conducted regarding MVCs, especially the safety of the occupants. As a result, many safety equipments such as airbag system and seatbelts systems were invented. Today, researchers in many auto-motive companies have designed new vehicles by using computational aided engineering software such as LS-Dyna, PAM-CRASH, and MADYMO. LS-Dyna and PAM-CRASH simulate the safety of vehicle body in frontal and side collisions and rollover tests. MA-DYMO, a specialized software for injury analysis of occupants, simulates the safety of occupants in vehicle accidents. After designing a desired vehicle model, execute real crash tests are executed using prototype cars. During real crash tests, standard dummy models, the 50th percentile Hybrid III Male dummy and the 5th percentile Hybrid III Fe-male dummy, are used. Injuries and contact area of airbag system, knee bolster, and windshield are analyzed afterwards. Problems are found through these crash tests and computer simulations before the manufacturing processing begins. During a new
automo-5
tive project, many factors are considered, but added consideration of having an obese or overweight person was not addressed, even though almost 60% of adults in the United States are categorized as overweight or obese.
Objective
Although many epidemiologic studies have been conducted examining the role of obesity and fat distribution of motor vehicle drivers and its effect on injuries during MVC, (Mock et al., 2002; Arbabi et al., 2003; Wang et al., 2003; Neville et al., 2004; Zhu et al., 2006; Cormier, 2008), this area is still not well understood.
The purpose of this study is to examine the association between obesity and body injuries in frontal MVCs through computational modeling and crash simulations. Among MVCs, frontal crashes are one of the most frequent types of accidents and often result in severe injuries (Conroy et al., 2008). In this study, only frontal crashes are considered.
MADYMO (TNO, The Netherlands), one of the multi body dynamics codes and a specialized software for injury analysis of occupants, is used in this study. The multi body dynamics method has been an attractive technique because of its capability of ana-lyzing complex kinematics of the human body and vehicle structure with easy modeling and rapid analysis. This thesis will address the entire process of creating obese dummy models, developing a vehicle model, conducting crash simulations with a variety of re-straints systems, and analyzing any body regional injury.
6 CHAPTER 2
Simulation Tool and Injury Criteria
Simulation Tool
Crash simulation is used to examine the safety of occupants during the moment of collision. The benefits of this method are that it performs simulations fast and economi-cally when compared with real car crash tests and also optimizes vehicle designs without prototype models.
MADYMO (TNO, 2008)
MADYMO (MAthematical DYnamic MOdelling) software package was used in this study as the simulation tool. MADYMO provides solutions to injury data of dummy models used in crash simulations. The package includes numerical solvers, dummy, hu-man, and example mathematical models. This package is applicable to both the automo-tive and aerospace industries. MADYMO provides simulations of multi body (MB), fi-nite element (FE), or both.
MADYMO is composed of several systems of bodies. A system of bodies is de-fined by the kinematic joints, the initial conditions, and the bodies. Among bodies, a MB is a rigid body and it is defined by mass, location of center of gravity, moment of inertia, and products of inertia. A system of bodies includes rectangular plane, ellipsoids, ellip-tical cylinder, and the FE model. A rectangular plane is defined by the coordinates of
7
three points. Fleming’s right hand rule with 1st, 2nd, and 3rd points decide the outside of a normal of plane. An ellipsoid is given by following equation:
Where a, b and c are the semi-axes of the ellipsoid X, Y, Z, respectively and n is the de-gree. Default degree is 2 and describes an ellipsoid. If the degree n increases, the ellipso-ids will be more rectangular shape. For example, if values of all axes are all 0.1 and the degree is 2 then the ellipsoid will be sphere, but if the degree is 90 then the ellipsoid will be cubic.
The relative motion of connected two bodies is restricted by a kinematic joint. Fig. 1 shows most common of joints, such as revolute joints, translation joints, spherical joints, universal joints, cylindrical joints, and planar joints.
MADYMO considers every ellipsoid is rigid MB. MADYMO models are com-posed several ellipsoids. Each ellipsoid is connected by a joint. Some simple models are composed by a single joint and ellipsoid, but most models are composed by several joints. Each joint is connected each other by parent body and child body. For example, parent body of Hybrid III dummy models is a pelvis body and joint. As a result dummy models were easily relocated by parent and child properties. For example, when a pelvis body moves, all the bodies are also moved. While when an upper arm moves, lower arm and hand are moved, but chest, abdomen, and pelvis do not move.
8 Fig. 1. Joints of MADYMO
Contact is also an important function of MADYMO. MADYMO provides three types of contact such as Contact.MB_MB, Contact.MB_FE, and Contact.FE_FE. Those are divided by types of contact surfaces. MADYMO also provides two contact models the elastic and the kinematic contact models. The Elastic model is available for all con-tacts and it allows penetration of contacting surfaces with a penetrate function. The Ki-nematic model is usually used for contact of MB and FE and it does not allow penetration of each contacting surface. It is used for airbag and dummy contact or seatbelts and dummy contacts.
9
Contact is defined by master surface and slave surface. Master surfaces are usual-ly MB surfaces except contact of FE_FE. In elastic model, deformable surface also define by MASTER, USER_MASTER, SLAVE, USER_SLAVE, USER_MID_POINT, AND COMBINED.
System of Units
The system of units used in MADYMO is the International System (SI). The four basic units in MADYMO are kilogram (kg) for mass, meter (m) for length, second (s) for time, and Kelvin (K) for temperature. Table 1 summarizes these units as well as some derived units. Angles are expressed in radians.
Table 1. Units in MADYMO Parameter Unit Time s Length m Mass kg Temperature K Velocity m/s Acceleration m/s2 Force N Torque Nm Moment of inertia kgm2
10 Injury Criteria
Head Injury Criterion (Eppinger, 1999)
Head injury is a leading cause of fatalities in MVCs. As a result, Federal Motor Vehicle Safety Standards (FMVSS) regulated the value of head injury criteria (HIC) to 700. HIC is calculated by the following equation:
The equation was defined by U.S government. Time t1 and t2 are arbitrary, but those time interval should be less than equal 15 milliseconds. Acceleration function, a(t), is the resultant head acceleration in g’s which is measured at the gravity center of head.
Biomechanical Neck Injury Predictor (Eppinger, 1999)
The biomechanical neck injury predictor, Nij, is a measure of the injury due to the load transferred through the occipital condyles. This injury parameter combines the neck axial force Fz and the flexion/extension moment about the occipital condyles Mz . Nij is calculated by following equation
11 Table 2.
Proposed Critical Intercept Values for Nij
Dummy Tension (N) Compression (N) Flexion (Nm) Extension (Nm) 50th Percentile Male 4500 4500 310 125 5th Percentile Female 3370 3370 155 62
Nij is the collective name of four injury predictors corresponding to different combinations of axial force and bending moment, NTE: extension, NTF: tension-flexion, NCE: compression-extension, and NCF: compression-flexion. Maximum value of those four is Nij and it is limited 1.0 by FMVSS.
Combined Thoracic Index (Eppinger, 1999)
The Combined Thoracic Index (CTI) is a measure of the injuries of the thorax. It is a combination of the maximum chest deflection Dmax and the 3ms clip maximum value of the resultant upper spine acceleration Amax. The equation for the calculation of the CTI is given by
where Aint and Dint are constants that Aint of both 50th percentile male and 5th percentile female are 90 g, and Dint of 50th percentile male is 103 mm and 5th percentile female is 84 mm. FMVSS restricts that Amax is less than 60g and Dmax is less than 63 mm and Amax is less than 60g and Dmax is less than 52 mm for male and female respectively.
12 The Femur Force Criterion (Eppinger, 1999)
The Femur Force Criterion (FFC) is a measure of injury to the femur. It is the compression force transmitted axially on each femur of the dummy as it is measured by the femur load cell. The FFC injury calculation is applied to the joint constraint force in the bracket joint located at a femur load cell. It is assumed that the coordinate systems of this joint are oriented in agreement with SAE J221/1 because as axial force, the compo-nent of the constraint force in the joint ζ-direction is used. A duration curve of this time history signal is made. The resulting femur axial force duration curve must not exceed 10 kN in 50th percentile male and 6.8 kN in 5th percentile female.
13 CHAPTER 3
MATERIALS AND MEHODS
Development of Obese Models
This research aimed at finding association between obese dummy models and body injuries in MVCs. A method, attaching a subcutaneous fat layer to a standard dum-my for representing an obese dumdum-my model, was used. The subcutaneous fat layer was modeled by finite element (FE) to assign biomechanical properties to the fat layer. The FE analysis is invented for solving complex elastic problems and it is applied to variety of fields such as bio mechanics, structure analysis, sheet metal forming, and crash analy-sis.
MRI Data and Imaging process
To represent a subcutaneous fat layer of obese dummy models in to computational models, segmented tag files acquired from grey-scale MRI datasets were utilized in this study (Shen et al., 2004; Shen and Chen, 2008). Each dataset was contained less than 43 segmented DICOM (Digital Imaging and Communications in Medicine) images, and their resolution is a 256 by 256 pixel. DICOM was produced to support the distribution and viewing of medical images, such as CT and MRI. The 3-dimensional volume render-ing technique was applied to connect those segments and converted subcutaneous fat into watertight, no holes or gaps, geometry by triangulated surface in stereo lithography (STL)
14
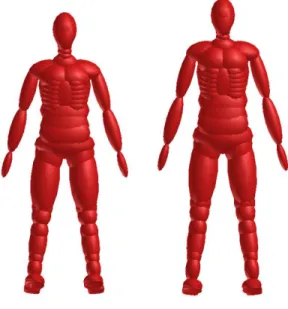
file format. Other organs, muscles, and bones were neglected in this study. Four data sets of male BMI 30 and 35, and female BMI 30 and 35 were obtained and those data were selected by almost identical heights of standard MADYMO dummy models.
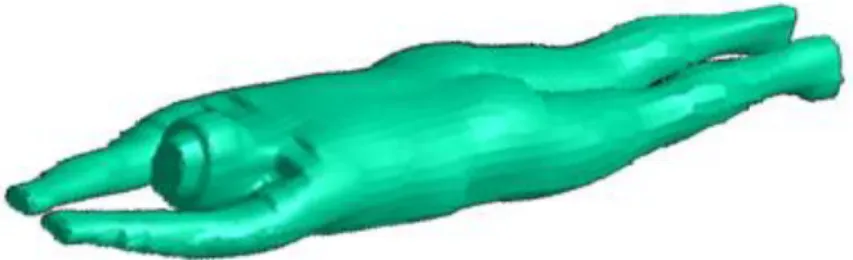
Fig. 2. Model of Male BMI 30 in Prone position
As shown in Fig. 2, however, the image processing data in model were supine or prone position. As a result, the data was not suitable for sitting position dummy models. Fig. 3 shows a dummy model with a subcutaneous fat layer extracted from MRI images. The yellow ellipses illustrate overlapped region of dummy model with the subcutaneous fat regions. Those overlapped or detached regions yielded numerical errors due to contact interface problems. An alternate approach was used in this study. An artificial subcutane-ous fat layer based on those image processing data was generated. The details will be ex-plained the following sections.
15 Fig. 3.Male BMI 30 with image processing data
Obese Models
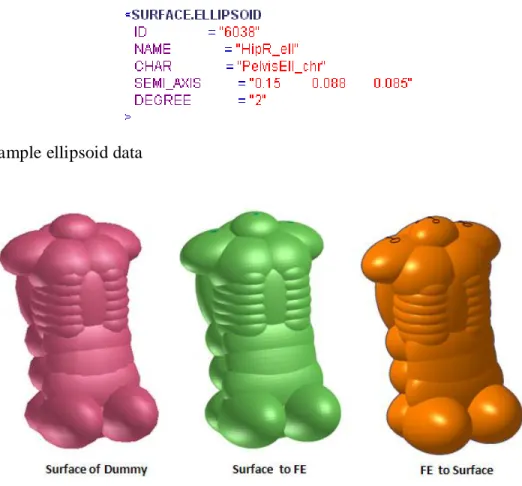
Obese dummy models were based on MADYMO standard hybrid III male (BMI 25, height 1.78 m) and female (BMI 22, height 1.52 m) dummy models. Subcutaneous fat models were generated, named fat-vests. The first step was to extract the surface data from standard dummy models, because visual surfaces displayed on Visual Safe MAD (VSM) were not geometric models. They just owned the information of ellipsoids, as shown in Fig.4. Upper body components, for example the chests, shoulders, abdomen, pelvis, hips, and the lumbar spine, were selected and converted to a FE model by VSM. The converted FE data were changed to geometric data by HyperMesh 9.0, and exported as an IGES (Initial Graphics Exchange Specification) file format. Fig. 5 shows the sa m-ple images of the surface converting process for the Hybrid III 50th percentile male dum-my model. The modified surface data, called base surface in this study, were offset by
16
1mm for maintaining the tolerance from the dummy model to the fat-vest to avoid initial penetration.
Fig. 4. Sample ellipsoid data
Fig. 5. The process of surface extraction
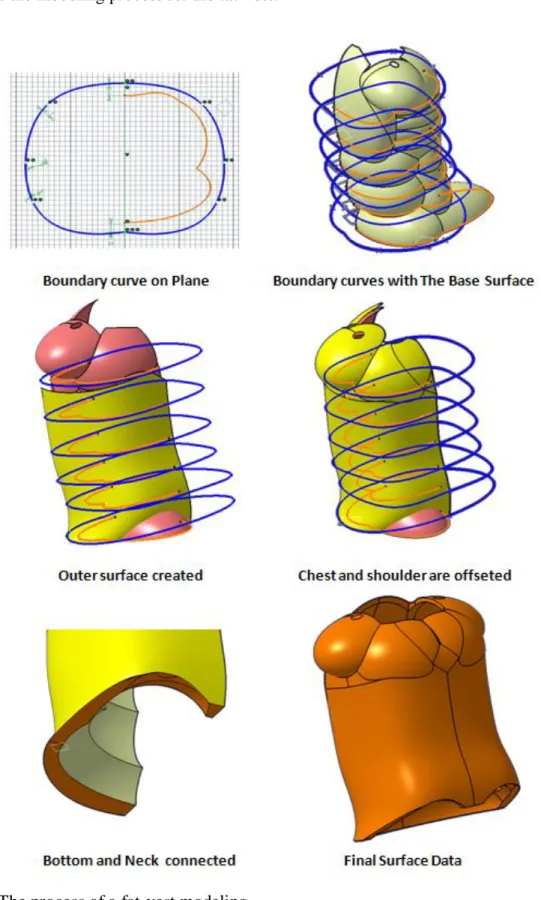
Each image processing the data for a male with a BMI of 30 and 35, and a female with a BMI of 30 and 35 was divided by 5 layers from pelvis to chest and the thickness of subcutaneous fat were measured. The base surface was also divided into 5 layers at the same location with the image processing data. Based on the thickness data, an outer spline curve was sketched with marked points on each layer and those curves were con-nected by interpolation method to generate outer surface data. The surfaces of the shoul-ders and chests were offset by 6 to 10 mm and connected to the outer surface data. The neck and bottom surfaces were also generated and connected to the base surface, so that
17
the outer surface with shoulders and chests could enclose all surfaces of the fat-vest. Fig. 6 shows the modeling process for the fat-vest.
18
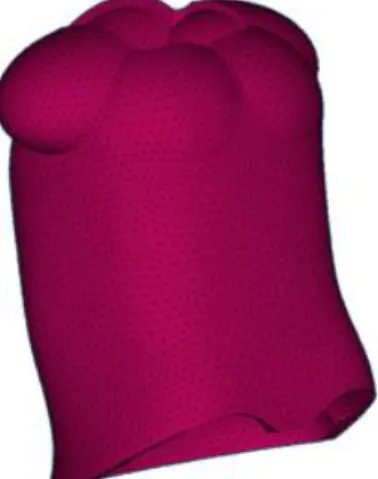
HyperMesh 9.0 (Altair Engineering) was used to generate the FE mesh data. The surface data were imported to HyperMesh 9.0 and modified by connecting and dividing surfaces to enhance mesh quality during mesh generation. Two-dimensional surface mesh was generated, and then three-dimensional volume mesh was generated by tetrahedra. Fig. 7 shows 2D and 3D mesh models and cross-section views, respectively.
19
Material properties for subcutaneous fat and skin were applied in 3D volume mesh and in 2D surface mesh, respectively. Mooney-Rivlin hyperelastic material model was used for the 3D volume mesh of fat-vests. Vannah and Childress (1996) found the ratio of Mooney-Rivlin coefficients A and B as A = 4B. Todd and Thacker (1994) re-ported Young’s modulus by subcutaneous fat as 64.8 kPa for male and 47.5 kPa for fe-male. The Poisson’s ratio was set to 0.49. Gent (2001) found the relation between Young’s modulus and Mooney-Rivlin coefficients to be E=6(C1+C2).
The density of human fat is measured as 900 kg/m3 (Fidanza et al., 1953). For the skin, the material properties of linear elastic of Young’s modulus of 0.635 MPa (Agache et al., 1980), a density of 1000 kg/m3 (Alekseev et al., 2008), and a Poisson’s ratio of 0.45 (Zheng et al., 1999), were used. The thickness of the skin was set to 2 mm ( Seidena-ri et al., 2000). Table 3 shows the summary of mateSeidena-rial properties used in this study.
Table 3
Material Properties of a Fat-vest
Attribute Unit Male Female
3D Subcutaneous Fat Density kg/m3 900 900 Poisson's ratio - 0.49 0.49 A N/m2 8640 6330 B N/m2 2160 1583 2D Skin
Young’s Modulus MPa 0.635 0.635
Density kg/m3 1000 1000
Poisson's ratio - 0.45 0.45
The fat-vest was integrated into the standard dummy as show in Fig. 8. A contact interface between the fat-vest the standard dummy model was assigned by
20
BMI increased by referring to a report for anthropometry and mass distribution of differ-ent-sized males (Armstrong, 1998). Tables 4 and 5 list the mass distribution of body components for males and females, respectively
Fig. 8. Hybrid model of obese dummy
Fig. 9 shows a comparison of the fat-vests using image processing data. However, the fat distributions could not be matched because the image processing data were either in supine or prone position.
21 Fig. 9. Fat- vests Comparison
22 Table 4.
Mass distribution of male dummy models
BMI25 BMI30 BMI35
NAME Mass % Mass % Mass %
Head & Neck 5.45 6.95% 5.45 5.88% 5.45 4.95% Thorax & Spine 19.66 25.07% 19.66 21.21% 22.89 20.81% Pelvis &
Abdo-men 17.25 22.00% 17.25 18.61% 19.06 17.32% Lower Extremity 27.33 34.84% 30.97 33.41% 37.13 33.75% Upper Extremity 8.74 11.14% 9.99 10.78% 12.01 10.92% Fat-Layer - - 9.38 10.12% 13.48 12.25% Total 78.4 100% 92.7 100% 110.0 100% Table 5.
Mass distribution of female dummy models
BMI22 BMI30 BMI35
NAME Mass % Mass % Mass %
Head & Neck 4.41 8.95% 4.41 6.36% 4.41 5.46% Thorax & Spine 13.33 27.06% 13.33 19.21% 13.52 16.73% Pelvis &
Abdo-men 10.31 20.93% 10.31 14.86% 10.45 12.94%
Lower Extremity 16.42 33.33% 21.22 30.59% 27.20 33.67% Upper Extremity 4.80 9.74% 5.86 8.44% 8.04 9.95%
Fat-Layer - - 14.26 20.55% 17.17 21.25%
23 Fig. 10. Dummy model comparison by BMI
Height Models
The heights of standard dummy models could not represent all drivers. Therefore, two height variations were considered: 184 cm for males and 164 cm for females. The standard dummy models were modified by increasing the distances of joints. A Hybrid III dummy has 26 joints. Each distance of consecutive joints was measured and the ratio of each joint from the shoe joints was calculated; Table 6 shows the initial distance and ra-tio. To increase height, a ratio of 0.06 from the shoe joint was used for each joint of the
24
male cases and a ratio of 0.1 from shoe joint was used for each joint of the female cases. Fig. 11 shows the standard male dummy model and height-modified model.
Table 6.
Joint Re-Distribution, 50th Male Case (6 cm up)
Original Ratio 6 cm up Neck 1.374 100.00% 1.434 Clavicle 1.328 96.66% 1.386 Shoulder 1.309 95.27% 1.366 RibsJ 1.17 85.12% 1.221 LumbarspineU 1.168 84.97% 1.219 Elbow 1.056 76.84% 1.102 LumbarspineJ 1.035 75.33% 1.08 Abdomen 0.97 70.59% 1.012 LumbarspineL 0.963 70.06% 1.005 Hip, pelvis 0.885 64.43% 0.924 Wrist 0.815 59.34% 0.851 Femur 0.593 43.18% 0.619 Knee 0.49 35.69% 0.512 TibiaUp 0.39 28.37% 0.407 TibiaLow 0.156 11.39% 0.163 Ankle 0.079 5.78% 0.083 Shoe 0 0.00% 0
25
Mass information was updated in the same method for the obese dummy model, which maintained a BMI of 30 and of 35.
Vehicle Design
Simplified Vehicle Model
A simplified vehicle model was generated for crash analysis. It has essential parts such as a seat, a steering wheel, an instrument panel, a knee bolster, the floor, seatbelts, and airbag system. Except for the airbag system and the seatbelts, all of the components were modeled by MB (ellipsoid and plane). The seat model was made by 4 ellipsoids for the bottom, lower back, upper back, and head-rest. The knee bolster was designed for knee and tibia contact; it also was defined through contact information with the dummy models. Windshield, roof, and floor were modeled on a plane, and all components were also given contact with the dummy models. The normal direction of a plane was set to the inside of the vehicle for correct contact with dummy models. If the normal direction was outward, then MADYMO recognized that the dummy model and planes were already contacted and penetrated; as a result, the dummy model rebound or moved to outer direc-tion of the plane. The steering wheel was designed with the following informadirec-tion: di-ameter, rim didi-ameter, hub didi-ameter, number of ellipsoids, number of spokes, and spoke angles. The contact information was given to the steering wheel with a dummy model and airbag system. The instrument panel was modeled by a simple ellipsoid, and the con-tact information was provided with the hands of the dummy models. Each component was fixed by a lock of an initial joint, because the dummy model on the vehicle was moved only by a deceleration pulse.
26 Fig. 12. Simplified Vehicle Model
Seatbelts
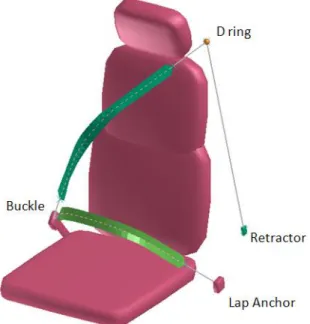
A seatbelt is the most important component among the safety equipments for all motor vehicles. Seatbelts have saved more lives since 1960 than the total of any other crashworthiness design feature (NHTSA, 2005). Seatbelts were composited with 3-point belts, a D-ring, a buckle, a lap anchor, and a retractor system. The D-ring and the lap anchor were modeled by a single ellipsoid and a fixed joint. These play a role for fixing seatbelts during crash simulations; the D-ring is attached on a B-Pillar so it is possible to modify the Z-position, but not the X and the Y. The lap anchor was attached to the seat model, as a result it could be moved by the change of seat position.
27
Fig. 13. 3 Point Belts with retractor systems, buckle, lap anchor, and D-ring
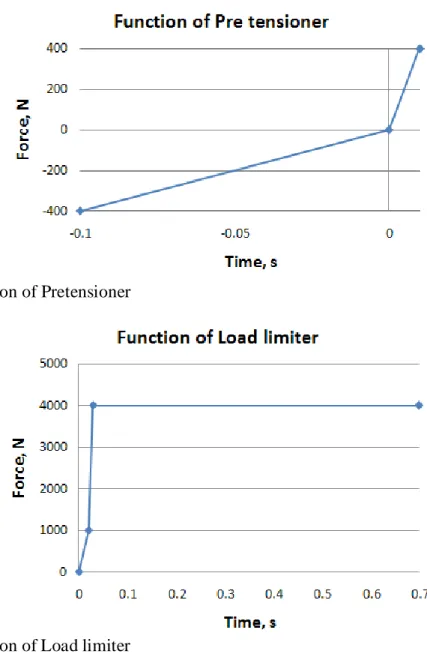
Retractor systems include the pretensioner and load limiter, both of which are an advanced technology of seatbelts. If the crash sensor detected a collision or a strong acce-leration, the pretensioner retracts the seatbelts and fastens it to the dummy model. This prevents slack, since sometimes the driver does not tightly tie up the seatbelt or wear a thick outer jacket, which can also make the seatbelt loose. Fig. 14 shows the function of a pretensioner. One of advantages of seatbelts is that it can restrain the dummy models to prevent them from colliding against the steering wheel or windshield. Seatbelts, however, also contributed to thoracic injuries due to its high magnitude holding force. The load li-miter was intended to reduce belt related injuries such as rib fractures by allowing for-ward excursion of occupants’ torsos when loads on the belt exceed some threshold (Brumbelow et al., 2007). It plays a role in releasing the belt webbing when a great force is applied to the belts, thereby preventing injuries from seatbelts.
28 Fig. 14. Function of Pretensioner
Fig. 15. Function of Load limiter
Airbag system
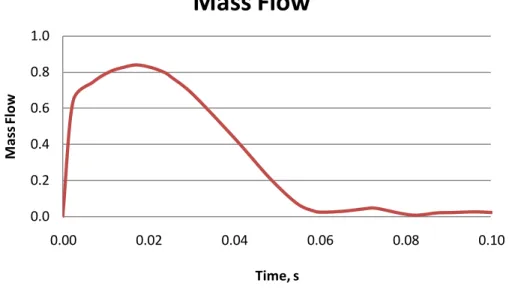
The airbag system was invented as a substitute for seatbelts, and became manda-tory since 1998. When a crash occurs at 12 mph or more, an airbag sensor triggers the airbag by the combustion of sodium azide, and the 50 liter volume of airbag is filled with nitrogen gases within 0.05 seconds (Anderson et al., 2002). NHTSA estimates that more than 6,018 people are saved by airbags, but also 169 people were killed in MVCs by
air-29
bags in 2000 (NHTSA, 2001). As a result, advanced airbag system was introduced for children and light females. To find advantages of the de-powered mass flow rate of air-bag system, case studies with variables of mass flow rates were simulated. Three types of mass flow rates of airbags were used for this simulation. One was a baseline airbag (Kiuchi, 1998), another was a 10% powered airbag, and the last was a 20% de-powered airbag. Kiuchi (1998) simulated the 20% de-de-powered mass flow rate and the original mass flow rate and found that advanced airbags (20% de-powered) with preten-sioner and load limiter showed lower injury criteria on HIC, chest acceleration, and chest deflection. Fig. 16 illustrates the mass flow rate of the baseline airbag.
Fig. 16. Mass flow function of baseline airbag
Deceleration Pulses
Two types of methods were used for the crash simulations. One was a direct im-pact against a barrier simulation and the other was a deceleration pulse method. A decele-ration pulse was acquired from an accelerometer of crash simulation. Three kinds of
de-0.0 0.2 0.4 0.6 0.8 1.0 0.00 0.02 0.04 0.06 0.08 0.10 M as s Fl ow Time, s
Mass Flow
30
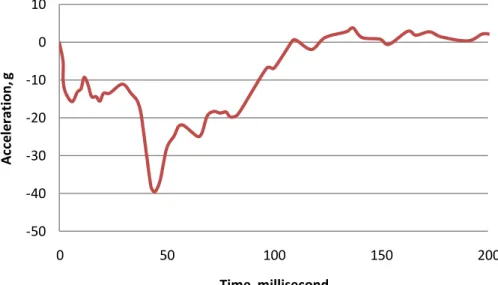
celeration pulses, baseline (delta 56km/h) (Rouhana, 2003), 1.2 times the baseline pulse, and 1.4 times the baseline pulse were used for the MVC simulations. The baseline decele-ration pulse was measured by an analog to digital converter. Gravity acceledecele-ration (Z-direction) and those pulses (X-(Z-direction) were applied to the dummy model, as a result the dummy model moved to X and Z directions. From frontal collisions, acceleration of the Y-direction was also measured, but because it was smaller than the others, it was ig-nored.
Fig. 17. The baseline deceleration pulse
Simulation Studies
A total of 78 MADYMO simulations were created to examine the association be-tween obesity and body injuries in MVCs. Baseline cases were defined by airbag system, seatbelts with retractor systems, and applied baseline pulse. As shown in Table 7, four categories of simulations for 12 case studies were generated. For example, pulse cases,
-50 -40 -30 -20 -10 0 10 0 50 100 150 200 Ac ce le ra ti on , g Time, millisecond
31
mass flow rates of airbag system, the combination of restraint systems, tilted steering wheel, height variables, and friction of seat and femurs were considered.
Table 7.
Variables for MADYMO simulation and case studies
Gender BMI Pulse Airbag Restraint Extra
Male Female BMI 25 BMI 30 BMI 35 Case 1-1 Case 1-2 Case 2-1 Case 2-2 Case 3-1 Case 3-2 Case 3-3 Case 3-4 Case 3-5 Case 4-1 Case 4-2 Case 4-3
Baseline Cases. Baseline cases were composed with the baseline pulse, the baseline
air-bag and seatbelts with pretensioner and load limiter.
Case study 1: Pulse Variables
Case study 1 – 1. The baseline pulse times 1.2 cases
Case study 1 – 2. The baseline pulse times 1.4 cases
Case study 2: Mass flow rates of Airbag Variables
Case study 2 – 1. 10% Depowered Airbag Cases
Case study 2 – 2. 20% Depowered Airbag Cases
Case study 3: Restraint systems
Case study 3 – 1. Without airbag system
Case study 3 – 2. Acceleration pulse 1.2 times and without the airbag system
32
Case study 3 – 4. Without pretensioner and load limiter
Case study 3 – 5. The maximum force of load limiter set to 2kN
Case study 4: Other cases
Case study 4 – 1. Increased height cases
Case study 4 – 2. Steering wheel of 10 degree tilted downward
33 CHAPTER 4
RESULTS
MADYMO Simulation
A series of images captured from the baseline simulation, for the standard Hybrid III 50th percentile male dummy model with the baseline pulse, is shown below. Images were captured every 30 milliseconds. The first image was ready to crash simulation at 0 milliseconds. The dummy was located on a driver seat by regulations of FMVSS 208. In the 2nd image captured at 30 milliseconds, the airbag system began to deploy, the preten-sioner retracted seatbelts began to tighten across the dummy model to prevent slippage, and the dummy model moved forward due to the application of the baseline pulse. In the 3rd image captured at 60 milliseconds, the dummy is shown right before contact with the airbag system, and the load limiter has released the seatbelts. In the 4th image captured at 90 milliseconds, the dummy is shown at full contact with the airbag system, with the load limiter having released the seatbelt at its maximum. The final image captured at 120 mil-liseconds showed that the dummy model has rebounded from airbag system. In almost all of the simulated cases, the same events occurred, but the time at which they occurred va-ried according to mass, pulses, and restraint conditions.
34
Fig. 18. Images of crash simulation by time step 30 milliseconds (ms)
For convenient comparison of each injury criteria, normalized values were used. The HIC value was divided by 700, and FFC was divided by 10,000 for males and 6,800 for females. Nij and CTI were already normalized values. If the normalized value is near 0, then it indicates a low risk for injuries, but if it is near to 1 or exceeds it, then it shows a high risk for injuries.
Baseline Cases
Baseline cases include the airbag system, retractor system, and the baseline pulse. This case study was simulated with six dummy models, male and female, with a BMI of 25(22), 30, and 35, with the above conditions.
For cases involving male dummy models, the HIC value for a BMI of 25 was 0.469, for a BMI of 30 was 0.522, for a BMI of 35 was 0.677. These were lower than the recommended normalized value of 1 provided by FMVSS. Nij, the neck injury criteria, for a BMI of 25 was 0.268, for a BMI of 30 was 0.309, and for a BMI of 35 was 0.329. These were also lower than the value of 1 recommended by FMVSS. CTI, the injury cri-teria for the thorax, for a BMI of 25 was 0.636, for a BMI of 30 was 0.706, and for a BMI of 35 was 0.77. These were within the value of 1 recommended by FMVSS. FFC, the i
n-35
jury criteria for the femur, for a BMI of 25 was 0.139, for a BMI of 30 was 0.154, and for a BMI of 35 was 0.215. These were lower than the recommended normalized value.
For cases involving the female dummy models, the HIC value for a BMI of 22 was 0.615, for a BMI of 30 was 0.626, and for a BMI of 35 was 0.583, and these were lower than the recommended normalized value of 1 provided by FMVSS. Nij, the neck injury criteria, for a BMI of 22 was 0.452, for a BMI of 30 was 0.348, and for a BMI of 35 was 0.379. These were also lower than the value of 1 recommended by FMVSS. CTI, the injury criteria for the thorax, for a BMI 22 was 0.739, for a BMI of 30 was 0.777, and for a BMI of 35 was 0.738. These were within the value of 1 recommended by FMVSS. FFC, the injury criteria for the femur, for a BMI of 22 was 0.219, for a BMI of 30 was 0.241, and for a BMI of 35 was 0.414. These were lower than recommended normalized value.
Based on the calculated injury criteria for head, neck, and thorax, the rate of in-crease with BMI were higher for male cases than female cases. For the cases regarding the femur, however, it was different.
Case Study 1
Case Study 1-1. The baseline pulse times 1.2 cases
Case Study 1-1 included the airbag system, retractor system, and 1.2 times the baseline pulse. This case study was simulated with six dummy models, male and female, with a BMI of 25, 30, and 35, with the above conditions.
36
For cases involving male dummy models, the HIC value for a BMI of 25 was 0.964, for a BMI of 30 was 0.983, and for a BMI of 35 was 1.213. HIC for a BMI of 35 was higher than the recommended value, and others were near the limit value. Nij, the neck injury criteria, for a BMI of 25 was 0.339, for a BMI of 30 was 0.365, and for a BMI of 35 was 0.421. These were also lower than the value of 1 recommended by FMVSS. CTI, the injury criteria for the thorax, for a BMI of 25 was 0.763, for a BMI of 30 was 0.822, and for a BMI of 35 was 0.945. These were within the value of 1 recom-mended by FMVSS. FFC, the injury criteria for the femur, for a BMI of 25 was 0.173, for a BMI of 30 was 0.187, and for a BMI of 35 was 0.234. These were lower than recom-mended normalized value.
For cases involving female dummy models, the HIC value for a BMI of 22 was 0.924, for a BMI of 30 was 0.988, and for a BMI of 35 was 1.089. HIC for a BMI of 35 was higher than recommended value, and others were near the limit value. Nij, the neck injury criteria, for a BMI of 22 was 0.462, for a BMI of 30 was 0.332, and for a BMI of 35 was 0.344. These were also lower than the value of 1 recommended by FMVSS. CTI, the injury criteria for the thorax, for a BMI of 22 was 0.823, for a BMI of 30 was 0.802, and for a BMI of 35 was 0.851. These were within the value of 1 recommended by FMVSS. FFC, the injury criteria for the femur, for a BMI of 22 was 0.245, for a BMI of 30 was 0.295, and for a BMI of 35 was 0.502. These were lower than recommended nor-malized value.
Compared with the baseline cases, all of injury criteria of Case Study 1 -1 showed higher values except for the neck injury of females with a BMI of 30. Among the criteria, an increase of HIC values for the male was more dominant than the other cases.
37 Case Study 1-2. The baseline pulse times 1.4 cases
Case Study 1-2 included the airbag system, retractor system, and 1.4 times the baseline pulse. This case study was simulated with six dummy models, male and female, with a BMI of 25, 30, and 35, with the above conditions.
For cases involving the male dummy models, the HIC value of a BMI of 25 was 1.536, for a BMI of 30 was 1.551, and for a BMI of 35 was 1.7763. These were higher than the value of 1 recommended by FMVSS. Nij, the neck injury criteria, for a BMI 25 was 0.445, for a BMI of 30 was 0.47, and for a BMI of 35 was 0.514. These were lower than the value of 1 recommended by FMVSS. CTI, the injury criteria for the thorax, for a BMI of 25 was 0.965, for a BMI of 30 was 0.995, and for a BMI of 35 was 1.096. The value for the BMI of 35 was higher than the recommended value, and others were near the limit value. FFC, the injury criteria for the femur, for a BMI of 25 was 0.197, for a BMI of 30 was 0.217, and for a BMI of 35 was 0.277. These were lower than recom-mended normalized value.
For cases involving female dummy models, the HIC value for a BMI 22 was 1.37, for a BMI of 30 was 1.544, and for a BMI of 35 was 1.624. These were higher than the value of 1 recommended by FMVSS. Nij, the neck injury criteria, for a BMI of 22 was 0.521, for a BMI of 30 was 0.358, and for a BMI of 35 was 0.408. These were lower than the value of 1 recommended by FMVSS. CTI, the injury criteria for the thorax, for a BMI of 22 was 0.920, for a BMI of 30 was 0.945, and for a BMI of 35 was 1.09. The value for the BMI of 35 was higher than the recommended value, and others were near the limit value. FFC, the injury criteria for the femur, for a BMI of 22 was 0.278, for a BMI 30 of
38
was 0.35, and for a BMI of 35 was 0.592. These were lower than recommended norma-lized value.
Compared with baseline cases, all of injury criteria for Case Study 1 -2 showed higher values. Among them, the increase of HIC values for the male was also more do-minant than the other cases, similar to Case Study 1-1. HIC for both male and female cases showed higher increase rates than Case Study 1-1. Fig, 19 shows the magnitude of the spool out of the load limiter, comparing the baseline, the 1.2 times pulse, and the 1.4 times pulse.
39 Table 8.
Male injuries result table of pulse cases
Male (1.78 m)
BMI 25 BMI 30 BMI 35
Baseline HIC 0.469 0.522 11.29% 0.677 44.35% Neck 0.268 0.309 -0.97% 0.329 -4.26% CTI 0.636 0.706 11.01% 0.770 21.07% LE 0.139 0.154 10.81% 0.215 55.23% Case 1-1 HIC 0.964 0.983 1.96% 1.213 25.81% Neck 0.339 0.365 1.64% 0.421 22.00% CTI 0.763 0.822 7.73% 0.945 23.85% LE 0.173 0.187 8.20% 0.234 35.33% Case 1-2 HIC 1.536 1.551 1.02% 1.776 15.63% Neck 0.445 0.470 7.03% 0.514 12.66% CTI 0.965 0.995 3.11% 1.096 13.58% LE 0.197 0.217 10.14% 0.277 40.14% Table 9.
Female injuries result table of pulse cases
Female (1.54 m)
BMI 22 BMI 30 BMI 35
Baseline HIC 0.615 0.626 1.81% 0.583 -5.28% Neck 0.452 0.348 -26.49% 0.379 -27.68% CTI 0.739 0.777 5.14% 0.738 -0.14% LE 0.219 0.241 9.94% 0.414 89.05% Case 1-1 HIC 0.924 0.988 6.92% 1.089 17.91% Neck 0.462 0.332 -21.44% 0.344 -15.43% CTI 0.823 0.802 -2.55% 0.851 3.40% LE 0.245 0.295 20.44% 0.502 105.29% Case 1-2 HIC 1.370 1.544 12.72% 1.624 18.56% Neck 0.521 0.358 -23.00% 0.408 -16.52% CTI 0.920 0.945 2.72% 1.097 19.24% LE 0.278 0.350 26.13% 0.592 113.30%
40 Case Study 2
Case Study 2-1. 10% Depowered Airbag Cases
Case Study 2-1 included the baseline pulse, retractor system, and 10% depowered airbag system. This case study was simulated with six dummy models, male and female, with a BMI of 25, 30, and 35, with the above conditions.
For cases involving the male dummy models, the HIC value for a BMI of 25 was 0.439, for a BMI of 30 was 0.486, and for a BMI of 35 was 0.663, and these were lower than the recommended normalized value of 1 provided by FMVSS. Nij, the neck injury criteria, for a BMI of 25 was 0.283, for a BMI of 30 was 0.294, and for a BMI of 35 was 0.312. These were also lower than the value of 1 recommended by FMVSS. CTI, the in-jury criteria for the thorax, for a BMI of 25 was 0.646, for a BMI of 30 was 0.632, and for a BMI of 35 was 0.771. These were within the value of 1 recommended by FMVSS. FFC, the injury criteria for the femur, for a BMI of 25 was 0.139, for a BMI of 30 was 0.151, and for a BMI of 35 was 0.194. These were lower than the recommended norma-lized value.
For cases involving the female dummy models, the HIC value for a BMI of 22 was 0.476, for a BMI of 30 was 0.532, and for a BMI of 35 was 0.504, and these were lower than recommended normalized value of 1 provided by FMVSS. Nij, the neck in-jury criteria, for a BMI a 22 was 0.411, for a BMI of 30 was 0.316, and for a BMI of 35 was 0.348. These were also lower than the value of 1 recommended by FMVSS. CTI, the injury criteria for the thorax, for a BMI of 22 was 0.727, for a BMI of 30 was 0.692, and for a BMI of 35 was 0.673. These were within the value of 1 recommended by FMVSS.
41
FFC, the injury criteria for the femur, for a BMI of 22 was 0.217, for a BMI of 30 was 0.235, and for a BMI of 35 was 0.411. These were lower than the recommended norma-lized value.
Compared with the baseline cases, the overall injury criteria for Case Study 2-1 showed a decrease in values. All of the injury criteria for female dummies show lower decrease rates than male cases. The advanced airbag, or depowered airbag, was invented for a small dummy representing the 5th percentile female and children, to reduce fatalities related to airbag deployment for this group. This case study demonstrated that a depo-wered airbag is beneficial for female dummies.
Case Study 2-2. 20% Depowered Airbag Cases
Case Study 2-2 included the baseline pulse, retractor system, and 20% depowered airbag system. This case study was simulated with six dummy models, male and female, with a BMI of 25, 30, and 35, with the above conditions.
For cases involving the male dummy models, the HIC value for a BMI of 25 was 0.418, for a BMI of 30 was 0.431, and for a BMI of 35 was 0.604, and these were lower than the recommended normalized value of 1 provided by FMVSS. Nij, the neck injury criteria, for a BMI of 25 was 0.268, for a BMI of 30 was 0.292, and for a BMI of 35 was 0.318. These were also lower than the value of 1 recommended by FMVSS. CTI, the in-jury criteria for the thorax, for a BMI of 25 was 0.629, for a BMI of 30 was 0.634, and for a BMI of 35 was 0.782. These were within the value of 1 recommended by FMVSS. FFC, the injury criteria for the femur, for a BMI of 25 was 0.139, for a BMI of 30 was
42
0.154, and for a BMI of 35 was 0.185. These were lower than the recommended norma-lized value.
For cases involving the female dummy models, the HIC value for a BMI of 22 was 0.375, for a BMI of 30 was 0.474, and for a BMI of 35 was 0.411, and these were lower than recommended normalized value of 1 provided by FMVSS. Nij, the neck in-jury criteria, for a BMI of 22 was 0.411, for a BMI of 30 was 0.316, and for a BMI of 35 was 0.336. These were also lower than the value of 1 recommended by FMVSS. CTI, the injury criteria for the thorax, for a BMI of 22 was 0.720, for a BMI of 30 was 0.701, and for a BMI of 35 was 0.686. These were within the value of 1 recommended by FMVSS. FFC, the injury criteria for the femur, for a BMI of 22 was 0.217, for a BMI of 30 was 0.236, and for a BMI of 35 was 0.410. These were lower than the recommended norma-lized value.
Compared with baseline cases, overall injury criteria of Case Study 2-2 showed decreased values. All of the injury criteria for the female dummies showed lower de-crease rates than male cases. Among them, HIC shows higher dede-crease rates than Case Study 2-1. It shows that a 20% depowered airbag is better than a 10% depowered airbag when considering head injury for the female dummy models.
43 Table 10.
Male injuries result table of airbag cases
Male (1.78 m)
BMI 25 BMI 30 BMI 35
Baseline HIC 0.469 0.522 11.29% 0.677 44.35% Neck 0.268 0.309 -0.97% 0.329 -4.26% CTI 0.636 0.706 11.01% 0.770 21.07% LE 0.139 0.154 10.81% 0.215 55.23% Case 2-1 HIC 0.439 0.486 10.67% 0.663 50.93% Neck 0.283 0.294 -1.35% 0.312 -4.42% CTI 0.646 0.632 -2.17% 0.771 19.35% LE 0.139 0.151 8.72% 0.194 39.87% Case 2-2 HIC 0.418 0.431 3.04% 0.604 44.43% Neck 0.268 0.292 12.88% 0.318 2.88% CTI 0.629 0.634 0.79% 0.782 24.32% LE 0.139 0.153 10.08% 0.185 33.33% Table 11.
Female injuries result table of airbag cases
Female (1.54 m)
BMI 22 BMI 30 BMI 35
Baseline HIC 0.615 0.626 1.81% 0.583 -5.28% Neck 0.452 0.348 -26.49% 0.379 -27.68% CTI 0.739 0.777 5.14% 0.738 -0.14% LE 0.219 0.241 9.94% 0.414 89.05% Case 2-1 HIC 0.476 0.532 11.90% 0.504 5.89% Neck 0.411 0.316 -31.10% 0.348 -31.10% CTI 0.727 0.692 -4.81% 0.673 -7.43% LE 0.217 0.235 8.20% 0.411 89.49% Case 2-2 HIC 0.375 0.474 26.55% 0.411 9.70% Neck 0.411 0.316 -30.46% 0.336 -32.28% CTI 0.720 0.701 -2.64% 0.686 -4.72% LE 0.217 0.236 8.80% 0.410 88.69%
44 Case Study 3
Case Study 3 is a set of simulations related to the restraint variables, for example no airbag cases, 1.2 times pulse with no airbag cases, no seatbelt cases, no retractor cases, and 2 kN load limiter cases.
Case Study 3-1. Without airbag system
Case Study 3-1 included the baseline pulse and retractor system, but no airbag system. This case study was simulated with six dummy models, male and female, with a BMI of 25, 30, and 35, with the above conditions.
For cases involving the male dummy models, the HIC value for a BMI of 25 was 0.221, for a BMI of 30 was 0.226, and for a BMI of 35 was 0.537, and these were lower than the recommended normalized value of 1 provided by FMVSS. Nij, the neck injury criteria, for a BMI of 25 was 0.328, for a BMI of 30 was 0.339, and for a BMI of 35 was 0.299. These were also lower than the value of 1 recommended by FMVSS. CTI, the in-jury criteria for the thorax, for a BMI of 25 was 0.606, for a BMI of 30 was 0.604, and for a BMI of 35 was 0.795. These were within the value of 1 recommended by FMVSS. FFC, the injury criteria for the femur, for a BMI of 25 was 0.139, for a BMI of 30 was 0.149, and for a BMI of 35 was 0.192. These were lower than the recommended norma-lized value.
For cases involving the female dummy models, the HIC value for a BMI of 22 was 0.332, for a BMI of 30 was 0.241, and for a BMI of 35 was 0.287, and these were lower than the recommended normalized value of 1 provided by FMVSS. Nij, the neck injury criteria, for a BMI of 22 was 0.454, for a BMI of 30 was 0.521, and for BMI of 35
45
was 0.57. These were also lower than the value of 1 recommended by FMVSS. CTI, the injury criteria for the thorax, for a BMI of 22 was 0.694, for a BMI of 30 was 0.698, and for a BMI of 35 was 0.683. These were within the value of 1 recommended by FMVSS. FFC, the injury criteria for the femur, for a BMI of 22 was 0.215, for a BMI of 30 was 0.236, and for a BMI of 35 was 0.416. These were lower than the recommended norma-lized value.
Compared with the baseline cases, overall injury criteria for Case Study 3-1 showed decreased values except for neck injury. Head and thorax did not come in contact with other equipment; as a result, those injury criteria were lower than the baseline. Neck injury, however, was highly increased in female dummies with a BMI of 30 and 35 be-cause of its severe bend.
Case Study 3-2. Acceleration pulse 1.2 times and without the airbag system
For cases involving male dummy models, the HIC value for a BMI of 25 was 0.851, for a BMI of 30 was 0.768, and for a BMI of 35 was 1.497. HIC for a BMI of 35 was higher than the recommended normalized value. Nij, the neck injury criteria, for a BMI of 25 was 0.327, for a BMI of 30 was 0.428, and for a BMI of 35 was 1.088. Nij for the BMI of 35 was higher than the recommended normalized value. CTI, the injury crite-ria for the thorax, for a BMI of 25 was 0.767, for a BMI of 30 was 0.876, and for a BMI of 35 was 1.084. The value for the BMI of 35 was higher than the recommended norma-lized value by FMVSS. FFC, the injury criteria for the femur, for a BMI of 25 was 0.172, for a BMI of 30 was 0.187, and for a BMI of 35 was 0.265. These were lower than the recommended normalized value.
46
For cases involving the female dummy models, the HIC value for a BMI of 22 was 0.515, for a BMI of 30 was 0.382, for a BMI of 35 was 0.491, and these were lower than the recommended normalized value of 1 provided by FMVSS. Nij, the neck injury criteria, for a BMI of 22 was 0.469, for a BMI of 30 was 0.562, and for a BMI of 35 was 0.691. CTI, the injury criteria for the thorax, for a BMI of 22 was 0.760, for a BMI of 30 was 0.787, and for a BMI of 35 was 0.911. Both Nij and CTI values were within the val-ue of 1 recommended by FMVSS. FFC, the injury criteria for the femur, for a BMI 22 of was 0.237, for a BMI of 30 was 0.294, and for a BMI of 35 was 0.484. These were lower than the recommended normalized value.
Compared with the baseline cases, overall injury criteria for Case Study 3-2 showed higher values except for the values for the head of the female cases. The male cases showed higher increase rates for the injury criteria than the female cases. Especial-ly, male BMI of 35 showed extremely high injury values for HIC and Nij because of the contact with the steering wheel. Fig. 20 shows the head acceleration data for the male dummy with a BMI of 35. Contact time with the steering wheel shows a drastic increase in acceleration. Even though the HIC value for females was decreased, Nij for females with a BMI of 35 was increased highly due to a severe bend. This case shows the impor-tance of combining the airbag system, the load limiter, and the pretensioner.
47 Fig. 20. HIC of male BMI 35
Case Study 3-3. Without seatbelts
Case Study 3-3 included the airbag system and the baseline pulse, but no sea t-belts. This case study was simulated with six dummy models, male and female, with a BMI of 25, 30, and 35, with the above conditions.
For cases involving male dummy models, the HIC value for a BMI of 25 was 3.227, for a BMI of 30 was 3.531, and for a BMI of 35 was 3.389. These were higher than the value of 1 recommended by FMVSS. Nij, the neck injury criteria, of BMI 25 was 1.515, for a BMI of 30 was 1.728, and for a BMI of 35 was 1.677. These were also higher than the value of 1 recommended by FMVSS. CTI, the injury criteria for the tho-rax, for a BMI of 25 was 1.049, for a BMI of 30 was1.051, and for a BMI of 35 was 1.249. These were higher than the recommended value. FFC, the injury criteria for the femur, for a BMI of 25 was 0.715, for a BMI of 30 was 0.798, and for a BMI of 35 was
48
0.979. These were lower than the recommended normalized value, but value for the BMI of 35 was close to the limit value.
For cases involving the female dummy models, the HIC value for a BMI of 22 was 0.782, for a BMI of 30 was 0.900, and for a BMI of 35 was 1.001. The value for the BMI of 35 was almost the value of 1 as recommended by FMVSS. Nij, the neck injury criteria, for a BMI of 22 was 0.793, for a BMI of 30 was 0.853, and for a BMI of 35 was 0.74. These were lower than the value of1 recommended by FMVSS. CTI, the injury cri-teria for the thorax, for a BMI 22 was 1.219, for a BMI of 30 was 1.194, and for a BMI of 35 was 0.994. The values for the BMI of 25 and 30 were higher than the recommended value, but the value for a BMI of 35 was near the limit value. FFC, the injury criteria for the femur, for a BMI of 22 was 0.553, for a BMI for 30 was 0.741, and for a BMI of 35 was 0.769. These were lower than the recommended normalized value.
Compared with the baseline cases, these cases showed the worst injury criteria and also indicated the importance of seatbelts. Male dummy models came in contact with the windshield and vented neck. As a result, head and neck injuries of the male dummies were extremely higher thant he baseline cases. Femur injury criteria were also very high values due to this direct contact with the knee bolster.
Case Study 3-4. Without pretensioner and load limiter
Case Study 3-4 included the baseline pulse and airbag system, but no retractor. The function value for the load limiter was given to 30kN, and the pretensioner was set to zero. This case study was simulated with six dummy models, male and female, with a BMI of 25, 30, and 35, with the above conditions.
49
For cases involving the male dummy models, the HIC value for a BMI of 25 was 0.553, for a BMI of 30 was 0.741, and for a BMI of 35 was 0.815. These all were lower than the recommended normalized value. Nij, the neck injury criteria, for a BMI of 25 was 0.525, for a BMI of 30 was 0.491, and for a BMI of 35 was 0.472. These were also lower than the recommended normalized value. CTI, the injury criteria for the thorax, for a BMI of 25 was 0.912, for a BMI of 30 was 0.837, and for a BMI of 35 was 0.933. These were within the normalized value of 1 recommended by FMVSS. FFC, the injury criteria for the femur, for a BMI of 25 was 0.169, for a BMI of 30 was 0.148, and for a BMI of 35 was 0.213. These were lower than the recommended normalized value.
For cases involving female dummy models, the HIC value for a BMI of 22 was 0.792, for a BMI of 30 was 0.993, for a BMI of 35 was 0.932, and these were lower than the recommended normalized value, but the value for the BMI 30 was near the limit val-ue. Nij, the neck injury criteria, for a BMI of 22 was 0.462, for a BMI of 30 was 0.623, and for a BMI of 35 was 0.791.These were within the recommended value. CTI, the in-jury criteria for the thorax, for a BMI of 22 was 0.896, for a BMI of 30 was 0.977, and for a BMI of 35 was1.074. The value for the BMI of 35 was higher than the recommend-ed normalizrecommend-ed value, and the value for the BMI of 30 was near the limit value. FFC, the injury criteria for the femur, for a BMI of 22 was 0.197, for a BMI of 30 was 0.294, and for a BMI of 35 was 0.561. These were lower than the recommended normalized value.
Overall injury criteria for Case Study 3-5 showed higher values when compared with baseline cases. The load limiter did not release the seatbelt; as a result, the neck was bent severely, and the chest was more highly compressed by the shoulder belt. The head also could not come in full contact with the airbag system.
50
Case Study 3-5. The maximum force of load limiter set to 2kN
Case Study 3-5 included the baseline pulse and airbag system, and the retractor systems, with the maximum function value of load limiter set to 2 kN. This case study was simulated with six dummy models, male and female, with a BMI of 25, 30, and 35, with the above conditions.
For cases involving male dummy models, the HIC value for a BMI of 25 was 0.774, for a BMI of 30 was 0.758, and for a BMI of 35 was 0.931. These all were lower than the recommended normalized value. Nij, the neck injury criteria, for a BMI of 25 was 0.392, for a BMI of 30 was 0.439, and for a BMI of 35 was 0.506.These were also lower than the recommended normalized value. CTI, the injury criteria for the thorax, for a BMI of 25 was 0.718, for a BMI of 30 was 0.765, and for a BMI of 35 was 0.933. These were within the normalized value of 1 recommended by FMVSS. FFC, the injury criteria for the femur, for a BMI of 25 was 0.131, for a BMI of 30 was 0.153, and for a BMI of 35 was 0.287. These were lower than the recommended normalized value.
For cases involving the female dummy models, the HIC value for a BMI of 22 was 0.780, for a BMI of 30 was 0.807, for a BMI of 35 was 0.862, and these were lower than the recommended normalized value, but the value for the BMI of 30 was near the limit value. Nij, the neck injury criteria, for a BMI of 22 was 0.476, for a BMI of 30 was 0.316, and for a BMI of 35 was 0.318. These were also lower than the recommended normalized value. CTI, the injury criteria for the thorax, for a BMI of 22 was 0.701, for a BMI of 30 was 0.752, and for a BMI of 35 was 0.765. These were all within the recom-mended normalized value. FFC, the injury criteria for the femur, for a BMI of 22 was
51
0.221, for a BMI of 30 was 0.263, and for a BMI of 35 was 0.449. These were lower than the recommended normalized value.
Overall injury criteria for Case Study 3-5 showed higher values when compared with the baseline cases. A problem with Case Study 3-4 was the limited spool out, but in this case the spool out was not limited. The head came into contact with the airbag strongly, and as a result injury to the head, neck, and thorax of the male dummies in-creased greatly. Head injury for female cases also inin-creased, but neck and thorax were decreased or slightly increased. The results of Case Study 3-4 and 3-5 show the impor-tance of properly setting the values of the load limiter. Currently, the optimal setting va l-ue for the 50th percentile male dummy model is 4 kN, but that may not be applied for all of the dummy models.
52 Table 12.
Male injuries result table of restraint cases
Male (1.78 m)
BMI 25 BMI 30 BMI 35
Baseline HIC 0.469 0.522 11.29% 0.677 44.35% Neck 0.268 0.309 -0.97% 0.329 -4.26% CTI 0.636 0.706 11.01% 0.770 21.07% LE 0.139 0.154 10.81% 0.215 55.23% Case 3-1 HIC 0.221 0.226 2.40% 0.537 143.37% Neck 0.328 0.339 -5.92% 0.299 -2.72% CTI 0.606 0.604 -0.33% 0.795 31.19% LE 0.139 0.149 7.29% 0.192 38.31% Case 3-2 HIC 0.851 0.768 -9.81% 1.497 75.83% Neck 0.327 0.428 12.00% 1.088 103.59% CTI 0.767 0.876 14.21% 1.084 41.33% LE 0.172 0.187 8.42% 0.265 53.92% Case 3-3 HIC 3.277 3.531 7.76% 3.489 6.45% Neck 1.515 1.728 4.97% 1.677 3.30% CTI 1.049 1.051 0.19% 1.249 19.07% LE 0.715 0.798 11.66% 0.979 36.94% Case 3-4 HIC 0.553 0.741 33.96% 0.815 47.34% Neck 0.525 0.491 -3.36% 0.472 -6.72% CTI 0.912 0.837 -8.22% 0.933 2.30% LE 0.169 0.148 -11.93% 0.213 26.29% Case 3-5 HIC 0.774 0.758 -2.05% 0.931 20.23% Neck 0.392 0.439 13.83% 0.506 29.34% CTI 0.718 0.765 6.55% 0.933 29.94% LE 0.131 0.153 16.76% 0.287 118.58%
53 Table 13.
Female injuries result table of restraint cases
Female (1.54 m)
BMI 22 BMI 30 BMI 35
Baseline HIC 0.615 0.626 1.81% 0.583 -5.28% Neck 0.452 0.348 -26.49% 0.379 -27.68% CTI 0.739 0.777 5.14% 0.738 -0.14% LE 0.219 0.241 9.94% 0.414 89.05% Case 3-1 HIC 0.332 0.241 -27.20% 0.287 -13.38% Neck 0.454 0.521 -23.34% 0.570 -19.22% CTI 0.694 0.698 0.58% 0.683 -1.59% LE 0.215 0.236 9.71% 0.416 93.37% Case 3-2 HIC 0.515 0.382 -25.86% 0.491 -4.58% Neck 0.469 0.562 -20.27% 0.691 -13.03% CTI 0.760 0.787 3.55% 0.911 19.87% LE 0.237 0.294 23.98% 0.484 103.97% Case 3-3 HIC 0.782 0.900 15.12% 1.001 27.98% Neck 0.793 0.853 27.01% 0.740 9.67% CTI 1.219 1.194 -2.05% 0.994 -18.46% LE 0.553 0.741 34.01% 0.769 39.12% Case 3-4 HIC 0.792 0.993 25.34% 0.932 17.64% Neck 0.462 0.623 13.19% 0.791 31.72% CTI 0.896 0.977 9.04% 1.074 19.87% LE 0.197 0.294 49.37% 0.561 184.76% Case 3-5 HIC 0.780 0.807 3.49% 0.862 10.53% Neck 0.476 0.316 -29.60% 0.318 -25.12% CTI 0.701 0.752 7.28% 0.765 9.13% LE 0.221 0.263 19.16% 0.449 102.93%