POVERTY & AGING IN AMERICA
POVERTY & AGING IN AMERICA
AARP Foundation
601 E Street NW
at social and economic risk.
AARP Foundation
AARP Foundation
POVERTY & AGING IN AMERICA:
POVERTY & AGING IN AMERICA:
Profiles of the Low
Profiles of the Low
-
-
Income Older Population
Income Older Population
2008 Chart Book
2008 Chart Book
Prepared in
partnership with:
AARP Public Policy Institute
David Baer Carlos Figueiredo George Gaberlavage Ann McLarty Jackson Leigh Purvis Sara Rix Alison Shelton Neal Walters Ke Bin Wu
Today’s crisis in the financial sector, skyrocketing gas prices and rising food costs challenge the welfare of the average American households and further sideline individuals 50+ who are living in or at the brink of poverty -- millions of people who silently sit on the knife’s edge of economic distress.
In July 2008, the AARP Foundation convened a symposium on poverty and aging in America. This marked our new initiative to open a dialogue about the hardships that affect older people living in poverty. It was also an opportunity to bring together a range of individuals and institutions - including government and the media, academics, grassroots and national organizations, the public and private philanthropic sector - to discuss poverty indicators and interdisciplinary strategies to combat economic distress in our communities across generational lines.
To coincide with the symposium, we released the Foundation’s first annual chart book:Poverty and Aging in America: Profiles of the Low-Income Older Population. This chart book presents key economic and social indicators through an “aging lens” to examine the special challenges around financial security for older Americans. The chart book documents the precarious situation of older persons with insufficient retirement income and/or employment opportunities; inadequate assets and financial management tools; limited health insurance coverage and access to key public benefits; and, high levels of disability and poor health.
We know that poverty is not a statistic – it is personal. It affects real people who live, hope and dream just as we do. Until we understand the true scope of poverty and near poverty, we cannot create the strategies to combat what seems like an intractable problem.
While AARP and the AARP Foundation strive to address many risk factors for poverty, we cannot do it alone. Our series,
Poverty and Aging in America,seeks to ensure a robust dialogue on the issues that place millions of older people at risk of falling into a cycle of poverty. By convening and joining together experts in poverty and financial security with aging advocates, we hope to pool our resources and stimulate informed discussions leading to durable public and private initiatives that make a real difference in the lives of poor older persons, children and families.
The AARP Foundation looks ahead to working closely with committed organizations to ensure that we have included the key indicators and benchmarks of economic wellbeing that need to be considered as part of our dialogue. With your help, we hope to build strategies—around asset development, financial protections and access to benefits -- that leverage support and resources for low income individuals and communities of all ages.
We look forward to input and insight from our colleagues and partners that will positively transform the financial security of our
Foreword
N. Joyce Payne, Chair George Rowan, Vice-Chair Bruce Corson Joanne Handy Madeline Moore-Burrell David Nelson Tom Nelson Joan Ruff Fernando Torres-Gil Art Ulene
AARP Foundation
Board of Directors
Introduction & Purpose
1
Principal Findings
2
Conclusions
7
Section 1: Demographic Characteristics of Persons Age 50+
9
Section 2: Findings from the Current Population Survey
13
Section 3: Findings from the Survey of Consumer Finances
43
Section 4: Selected National and State Housing Characteristics
67
Section 5: Selected Health Indicators
83
Section 6: Data from Consumer Expenditures Survey
91
Introduction & Purpose
Introduction
The United States has made enormous strides in reducing poverty at older ages over the past several decades. In 1959, 35.2 percent of persons age 65+ had incomes below the poverty threshold. By 2006, the poverty rate for this age group had fallen to 9.4 percent. The most dramatic improvement occurred in the 1960s and 1970s when Congressional enhancements to Social Security—the dominant source of income for older Americans—increased benefits and introduced automatic cost-of-living adjustments.
Yet the poverty rate for older persons in the United States has remained relatively stable at around 9 percent to 11 percent for the past decade. Moreover, the total poverty rate obscures wide variation by sex, race and ethnicity, and living arrangement. Women age 65+ had a poverty rate of 11.5 percent in 2006; that for men in the same age group was 6.6 percent. The poverty rate for older non-Hispanic Whites was 7 percent, but for Hispanics it was 19.4 percent and for African-Americans, 22.7 percent. Rates were even higher for minority women, and older women living alone were among America’s poorest residents. A focus on poverty rates alone overlooks the large number of near-poor older persons at risk of falling into poverty for any number of reasons—the death of a spouse, unexpected health care expenditures, or rising utility bills, for example. One of the more restrictive definitions sets “near poor” or “at risk” at 125 percent of poverty. Using that cutoff, 3.4 million persons age 65+ in the United States were poor in 2006; another 2.2 million were near poor.
It is not only the oldest of America’s 50+ population who are poor. More than 4.4 million men and women ages 50 to 64 have incomes below the poverty line, and many others are only a catastrophe away from poverty. Not only do poor and vulnerable middle-aged families and individuals struggle to make ends meet today, they face a very bleak future in retirement unless something is done to help them now.
Purpose
To begin the process of developing a more detailed strategy for improving the poverty situation among the older population, the AARP Foundation
commissioned this chart book to provide a clearer portrait of older persons living in poverty and those at risk of falling into poverty. This chart book will also compare those below poverty to one another and their more affluent counterparts in the older population.
This profile is intended to provide key data on the social and financial status of these segments of the older population and to assist the initial discussions with the philanthropic community and others about their needs.
Important additional purposes of the project are to:
Women Are Most At Risk of Falling into Poverty:
More than 6 in 10 of older persons in poverty or at risk of falling into poverty are women.
Almost one-fifth (19 percent) of older African-Americans are living in poverty compared to 6.5 percent of older Whites. In addition, almost one-quarter (24 percent) of African-Americans and 27 percent of Hispanics age 50+ are at risk of falling into poverty.
43 percent of persons age 50+ living in poverty live alone.
Continuing to Work Increases Income and Helps Keep People Out of Poverty:
Among persons age 50 to 64 living in poverty, only one-quarter are in the workforce. More than three-quarters of people in this age group with incomes at or above twice the poverty level are in the workforce.
Women age 50 to 64 are less likely to be in the workforce than men the same age.
At age 65+, African-Americans and Hispanics are more likely than Whites to be in the workforce. This may be due to the fact that
Whites are more likely than other racial and ethnic groups to have retirement income from pension plans.
Unemployment and Disability Are Serious Problems for Persons Age 50 to 64 in Poverty:
About 16 percent of persons age 50 to 64 who are living in poverty report that they are unemployed but looking for work.
More than one-quarter of African-Americans age 50 to 64 living in poverty report being unemployed but looking for work.
Social Security Disability Insurance (SSDI) assists only about 1 in 10 persons age 50+ who report that a disability has affected their efforts to work.
Social Security Is Critical to Keeping People Out of Poverty:
The poverty rate for persons age 65+ would have increased from 9.4 percent to 44.9 percent in 2006 without Social Security.
Social Security is important to all racial and ethnic groups, although Hispanics are less likely to receive Social Security benefits than others.
Older Persons Living in Poverty or At Risk are Unlikely to Receive Retirement Income from a Traditional Pension, 401(k) or Similar
Plan:
For older persons living in poverty the rates of receiving income from a traditional pension, 40l (k) or similar plan are very low.
Older Whites are significantly more likely than older African-Americans and Hispanics to receive retirement income from a traditional pension, 401(k), or similar plan.
Health Insurance Coverage is Limited for Persons Age 50 to 64 Living in Poverty:
Only 64.7 percent of persons age 50 to 64 who are living in poverty have any public (Medicaid) or private health insurance coverage.
Coverage rates for the unemployed age 50 to 64 are significantly lower than for all persons in this age range. Of persons in this age group living in poverty who report that they are unemployed, only 46.8 percent have any public or private health insurance coverage.
Whites are generally the most likely and Hispanics are the least likely to have public or private health insurance coverage. Only one-half of Hispanics age 50 to 64 with income up to twice the poverty line have health insurance.
Medicaid is very important for persons age 50 to 64 living in poverty. African-Americans and Hispanics rely on Medicaid at twice or more the rate of Whites.
Older Persons Living Below the Poverty Line Rely Heavily on Public Benefits:
Older persons living in poverty rely heavily on public benefits such as Medicaid, Supplemental Security Income, public housing, and food stamps, particularly among the group age 50 to 64.
Women are generally, although not always, more likely than men to receive public benefits.
A Majority of Older Households Own Homes but Many Have Problems Meeting Ownership-Related Expenses:
Half of households age 50-64 living in poverty and nearly two-thirds of households age 50-64 at risk of poverty own their homes. Two-thirds of both groups own their homes free and clear. Equity levels are relatively modest, however, and the expenses of ownership (principal, interest, taxes, insurance, and utilities) compared to income levels are high, especially for those with mortgages.
Spending for shelter and utilities make up more than one-third of the average annual expenditures for families age 50+ living in poverty. In comparison, families age 50+ with incomes at or above twice the poverty level spent just 25 percent of their average annual expenses for these categories. The percentage share of average annual expenditures for utilities by families living in poverty and at-risk of poverty is almost twice that of families with incomes at or above 200 percent of poverty.
At all income levels, persons age 65+ are more likely to own their homes than persons age 50-64.
Only one-third of African-Americans age 50 to 64 living in poverty own their homes compared to 60 percent of Whites in that same age and income group.
The Low Net Worth of Older Families Living in Poverty Indicates a Lack of Financial Security:
Older Families Living in Poverty and At Risk of Poverty Lack the Financial Cushion that Assets Provide:
Families age 50+ living in poverty and those at risk of poverty have insignificant liquid assets.
Total median financial assets of older families living in poverty are less than $1,000.
African-American and Hispanic families age 50+ living in poverty have less than half the total median financial assets of Whites living in poverty.
Total median financial assets of women age 50+ in all income groups is approximately half that of men.
Older Families Living in Poverty or At Risk of Poverty are Much Less Likely to Own Accounts and Use Other Financial Services than
Older Families with Higher Incomes:
More than one-third of families age 50+ living in poverty do not have a checking account. Nearly half of African-American and
Hispanic families age 50+ living in poverty lack checking accounts.
8 out of 10 families age 50+ living in poverty and six out of 10 families age 50+ at risk of poverty lack a savings or money
market account.
Whites age 50+ are twice as likely as Hispanics age 50+ and 1.5 times as likely as African-Americans in the same age group to
own a savings or money market account.
Nearly 6 out of 10 older families headed by women lack a savings or money market account.
Ownership of retirement accounts or mutual funds (independent of retirement accounts) is negligible among families age 50+
living in poverty or at risk of poverty.
Only about one-third of families age 50+ living in poverty and one-half of those at risk of poverty have life insurance.
A Significant Percentage of Older Families Living in Poverty have Heavy Debt Burdens:
Almost 1 in 5 families age 50+ living in poverty have debt payments in excess of 40 percent of their total income.
The median credit card balance as a percentage of income is highest for older families living in poverty and those at risk of poverty.
Nearly 10 percent of families age 50-64 living in poverty have filed bankruptcy in the last 7 years. This is about twice the rate of families age 50-64 with incomes at or above 200 percent of poverty.
Persons Living in Poverty are More Likely to Experience Poor Health and have Problems Paying for Care:
Persons age 50+ living in poverty are almost four times as likely as those living at twice the poverty level to categorize their health as poor rather than excellent. 41 percent indicated they experienced poor health more than a week in the past 30 days.
Almost one-quarter of persons age 50+ living in poverty said they could not see a doctor within the last 12 months because of cost. 15 percent of persons age 50+ in the at-risk category could not see a doctor because of cost.
The presence of risk factors such as obesity, diabetes, and hypertension are significantly higher among persons age 50+ living in poverty or at risk of poverty than for persons age 50+ with incomes at or above 200 percent of poverty. Those living in poverty and at risk of poverty also exercise less and undergo less frequent screenings (mammograms and colonoscopies) for early detection of diseases than those with higher incomes.
Consumers living in poverty or at risk of poverty spend a higher percentage of their average annual expenditures on health care (10 and 12 percent respectively) than consumers age 50+ with incomes at or above 200 percent of poverty (8 percent).
Conclusions
The overall portrait of persons age 50+ living in or at risk of poverty that emerges from this analysis is a population on the knife’s edge of economic distress. The precarious situation of these older persons is due to a lack of retirement income and/or employment opportunities, inadequate assets and financial
management tools, limited health insurance coverage and access to key public benefits, and high levels of disability and poor health. Furthermore, these harsh circumstances disproportionately impact women, minorities, and persons living alone.
Yet even within this disturbing overall portrait, potential sources of strength, hope, and financial improvement can be discerned. For example, the fact that a significant percentage of people age 50 to 64 living in poverty report that they are unemployed also means that they are looking for work. They would thus likely be receptive to increased opportunities for employment. Indeed, as noted in this chart book, more than three-quarters of people with incomes at or above 200 percent of poverty are employed. There is no reason to believe that older persons living in poverty or at risk of poverty and who are able to work would be any less motivated to work than those with higher incomes, particularly if employment services included training for jobs offering better pay and benefits such as health insurance and retirement savings plans. For older workers with a disability that prevents them from working, a public benefits strategyto assist in overcoming barriers to claiming Social Security Disability Insurance would be especially helpful in preventing long-term income losses. Low-income workers often lack the resources necessary to obtain assistance in getting their government claims considered under the long application and appeals process. Similarly, the high homeownership rate among older households living in poverty and at risk of poverty and the fact that many of these homes are owned free and clear provide a basis to develop and implement an asset preservationand enhancementstrategy. For example, strengthening protections against predatory mortgage lending practices can prevent the loss of home equity. This is especially important in low-income and minority communities where there has been heavy marketing of subprime loan products. At the same time, strategies to link older homeowners with programs for property tax abatement, home repair, and energy efficiency modifications could help reduce the ownership cost burdens identified in this chart book, while increasing home values and providing important health and safety benefits. Access to high quality counselingand the development of new product innovations in the area of reverse mortgages could also help many older homeowners living in poverty or at risk of poverty to improve their financial status and pay for needed services such as health care and home improvements. In addition, the benefit of targeted strategies linking counseling, financial education, and potential wealth-building activities with key instances of homeowner decision making such as applying for credit (especially home equity loans) and public benefits (especially property tax abatement, energy assistance, and weatherization), tax filing, and refinancing should not be overlooked.
The findings reported in this chart book also highlight the critical role of Social Security and other public programs in preventing poverty among older persons and mitigating the effects of poverty. These findings validate and reinforce the Foundation’s goal of enhancing and protecting effective publicsupport
programs. However, as emphasized in a recent AARP Public Policy Institute report on changes in the poverty status of women, maximizing earnings potential in retirement and increasing asset accumulationare also essential in reducing the economic vulnerabilities in old age. This report identifies heavy debt burdens as an obstacle to progress in increasing asset accumulation among the poorest older families. The fact that almost 20 percent of families age 50+ living in poverty have debt payments in excess of 40 percent of total income, and that the percentage of families in such circumstances has been increasing, suggests that the recent “democratization” of credit has a dark side for many of the most financially vulnerable older families. A strategy incorporating financial education and counseling, increased protections against financial abuse, and the development of public/private partnerships to increaseaccess to lower- cost financial
Section 1: Demographic Characteristics
of Persons Age 50+
Ana T., Des Plaines, IL
“I am a single woman of 58 and am running scared. I have worked all my life since the age of 13. I have nothing to show for it. I have always lived from paycheck to paycheck. I am at the point where I have dropped my health insurance and am in great debt. Hopefully a good job will be coming my way soon. What will happen to me if I get sick for a month or two? I will be finished. We need better health care for the baby boomers like me who just struggle from week to week to make ends meet. I have nothing for my old age as I am sure millions more people are in the same boat as I am.”
Poverty Levels1 Below 100% 100%-199% 200%+ Gender Male 37.5% 39.0% 48.9% Female 62.5% 61.0% 51.1% Educational Attainment Grade 6 or less 10.5% 8.8% 2.1%
Less than High
School 27.1% 23.6% 8.6% High School Diploma 32.7% 39.2% 32.5% Some College or Associate Degree 18.2% 18.7% 25.7% Bachelor's Degree 8.3% 6.8% 18.3% Post-Graduate Degree 3.2% 2.9% 13.0%
Table 2: Percentage of Persons Age 50 and Older Who Are Living
Alone
(a), by Poverty Level and Gender
Poverty Levels1 Below 100% 100%-199% 200%+ Living Alone Male 33.3% 25.4% 12.7% Female 48.8% 44.9% 17.8% All Persons 43.0% 37.3% 15.3% Poverty Levels1 Below 100% 100%-199% 200%+ Race/Ethnicity White 6.5% 16.0% 77.5% African-American 19.0% 24.0% 57.1% Hispanic 16.5% 27.0% 56.6% Marital Status Married 32.9% 44.7% 72.1% Widowed 24.9% 29.5% 9.9% Divorced/Separated 27.8% 18.0% 12.8% Never Married 14.5% 7.8% 5.2%
Demographic Characteristics
By Age Group Age 0-49 Age 50-64 Age 65-74 Age 75+ All Ages
Gender Male 50.3% 48.4% 46.0% 39.3% 49.1% Female 49.7% 51.6% 54.0% 60.7% 50.9% Household Income Less than $15,000 8.3% 8.3% 13.3% 22.1% 9.4% $15,000-$24,900 8.1% 7.6% 16.0% 23.1% 9.4% $25,000-$49,900 23.9% 21.2% 33.3% 30.6% 24.4% $50,000-$74,700 20.7% 19.7% 15.7% 11.0% 19.7% $75,000+ 39.0% 43.1% 21.8% 13.3% 37.1% Race White 61.3% 75.2% 78.3% 82.9% 66.1% African-American 13.2% 10.3% 9.4% 7.1% 12.1% Hispanic 18.1% 8.9% 7.6% 5.8% 15.1% Other 7.3% 5.6% 4.8% 4.2% 6.6% Education Grade 6 or Less 30.9% 2.9% 4.9% 6.3% 22.8%
Less than High School 13.7% 9.1% 15.8% 21.2% 13.4%
High School Diploma 19.4% 31.1% 36.8% 38.1% 23.7%
Some College or Associate
Degree 19.0% 26.7% 21.1% 17.8% 20.4% Bachelor's Degree 12.2% 18.3% 12.3% 9.8% 13.1% Post-Graduate Degree 4.9% 11.9% 9.2% 6.9% 6.5%
Marital Status
Married
32.7%
68.8%
65.3%
47.0%
42.1%
Widowed
0.4%
4.5%
17.7%
43.2%
4.7%
Divorced/Separated
7.0%
18.6%
12.9%
6.3%
9.4%
Never Married
59.9%
8.2%
4.1%
3.5%
43.8%
Living Arrangements
Section 2: Findings from the Current Population
Survey Concerning Labor Force Participation,
Disability, Retirement Income and Public Benefits
Sara C., VA
“…Chronic illness robbed me of the active lifestyle I loved. I lost my teaching position, a 16 year-long successful career in the public school system that I loved. Suddenly, I was a single mother with no source of income. At the age of 40 my savings are depleted, I rely on food stamps for groceries, have declared bankruptcy, and may lose our small home. Worst of all, we lost our insurance. No more doctor visits, eye or dental care, or prescription drugs. My health quickly declined, especially without my medication. While I finally found some drug assistance, it was a long, stressful process due to my illness. The only way we can get health insurance is to pay a monthly premium of $650, not possible without an income. …This has to stop, and it needs to stop now!”
Continuing to work helps keep older
people out of poverty. Higher income
levels are associated with higher rates of
labor force participation: nearly
one-quarter of persons age
65+ who have
incomes that are at least twice the
poverty level are still in the labor force.
Figure 1: Below Poverty and At-Risk Persons
Have Lower Labor Force Participation Rates
48.7 70.5 16.5 25.6 4.4 22.2 47.4 5.7 58.9 78.6 22.8 0% 25% 50% 75% 100% 50+ 50-64 65+
Age
Labor Forc e Participat ion Rate All Below 100% 100-199% 200%+Source: U.S. Census Bureau, 2007 Current Population Survey, March Supplement. 16.4
At all income levels, women age 50 to 64
are less likely to be in the workforce than
men. Some of the explanation may lie in
the fact that women are more likely than
men to work as
unpaidcaregivers.
Figure 2: Women Age 50 to 64 Have Lower Labor Force Participation
Rates Than Men at All Income Levels for Age 50 to 64
29.5 22.7 49.6 84.1 73.2 0% 25% 50% 75% 100%
Men Women Men Women Men Women Below 100% 100-199% 200%+ Poverty Level Labor Forc e Participat ion Rate
Source: U.S. Census Bureau, 2007 Current Population Survey, March Supplement 45.6
African-Americans and Hispanics are
more likely than Whites to be in the
labor force at age 65+. Hispanics age
65+ have the highest rate of labor
force participation and
African-Americans age 65+ have the next
highest rate. The lower participation
rate for Whites is likely due to the fact
that Whites age 65+ are the most
likely to have retirement income from
pensions and 401(k)s (see Figure 12),
and health insurance from private
sources or
Medicare(see Figure 18).
Hispanics are also slightly less likely to
have Social Security retirement
benefits (see Figure 28).
The same pattern is not characteristic
of persons age 50 to 64.
Figure 3: African-Americans and Hispanics Are More Likely
Than Whites to Be in the Labor Force at Age 65+
43.8 47.9 58.2 78.8 78.2 76.5 5.0 32.0 21.7 25.4 22.6 23.2 9.1 7.4 5.0 6.9 3.8 0% 30% 60% 90% Wh ite Afri can-Ameri can H ispanic Wh ite Afri can-Ameri can H ispanic Wh ite Afri can-Ameri can H ispanic Below 100% 100-199% 200%+ Poverty Level Labor Forc e Participat ion Rate 50-64 65+
Source: U.S. Census Bureau, 2007 Current Population Survey, March Supplement
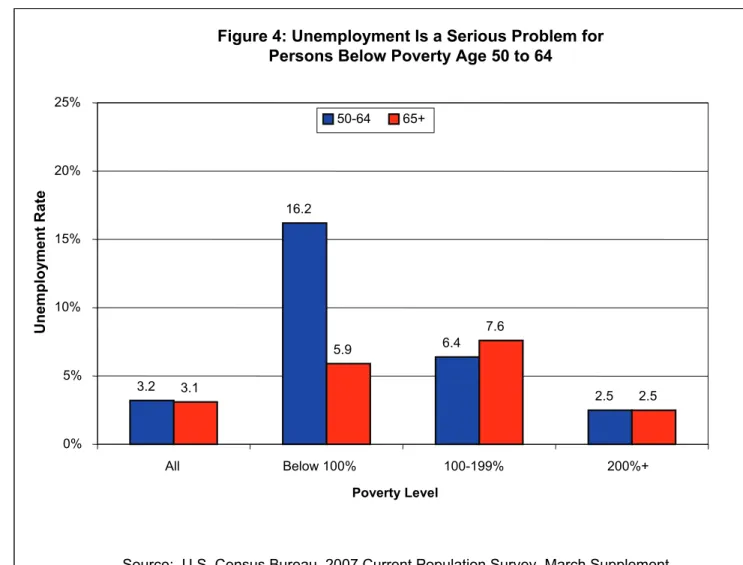
Unemployment is a significant problem
for persons age 50 to 64 in the
workforce who live in poverty; it likely
contributes to their poverty status.
Unemployment is also detrimental to
retirement security because the
unemployed
are unable to increase their
savings and assets.
Figure 4: Unemployment Is a Serious Problem for
Persons Below Poverty Age 50 to 64
3.2 16.2 6.4 2.5 3.1 5.9 7.6 2.5 0% 5% 10% 15% 20% 25% All Below 100% 100-199% 200%+ Poverty Level Unemploy ment Rate 50-64 65+
Among persons in the workforce age 50
to 64, over one-quarter of
African-Americans living in
povertyreport being
unemployed. At the lower income levels,
African-Americans are substantially more
likely to be unemployed than other racial
groups.
Figure 5: African-Americans Aged 50 to 64 Below Poverty and in the At-Risk
Group Are Much More Likely Than Other Racial Groups to Experience Unemployment
15.5 6.2 2.3 27.1 9.0 3.5 5.0 4.6 8.1 0% 10% 20% 30% 40% Below 100% 100-199% 200%+ Poverty Level Unemploy ment Rate White African-American Hispanic
Almost 60 percent of men with incomes
up to twice the poverty level, and over
half of women below poverty, have left
the workforce because of an illness or
disability. Men are more likely than
women to leave the workforce because of
illness or disability. Retirement rates rise
with income level, from one quarter of
men and women below poverty to over
half of men with income twice the poverty
level or more; this is likely because
persons at these higher income levels
are more likely to have pensions, 401(k)s
and other retirement income. Women
are many times more likely
thanmen to
have left the workforce to care for home
or a family member, at all income levels.
Figure 6: Illness, Disability and Retirement Are Major Reasons
for Not Working Among Persons Aged 50 to 64
59.2 59.8 32.0 3.6 37.6 55.9 2.4 8.1 9.6 5.5 25.8 4.1 19.3 7.0 22.1 51.6 35.1 22.0 4.6 22.8 43.2 2.7 31.1 40.2
0%
25%
50%
75%
100%
Ill or di sabled Retired Tak ing care of home or fami ly Oth er Ill or di sabled Retired Tak ing care of home or fami ly Oth er Ill or di sabled Retired Tak ing care of home or fami ly Oth er Below 100% 100-199% 200%+Poverty Level
P
er
cent
Male
Female
Nearly one-half of African-Americans
below poverty and almost as many
Whites below poverty report that a
disability affects their ability to work.
Persons with income below poverty
report significantly higher rates of
disability than those with incomes twice
the poverty level or more. Of those who
report that a disability affects their ability
to work, many may still be working
reduced hours or at different
jobs,
potentially reducing their incomes.
Figure 7: Disability Is a Significant Problem for African-Americans
and Whites Aged 50 to 64 Below Poverty
44.6 48.0 32.2 33.1 9.0 11.6 8.5 18.7 34.8
0%
10%
20%
30%
40%
50%
60%
Whit
e
African-
American
Hi
span
ic
Whit
e
African-
American
Hi
span
ic
Whit
e
African-
American
Hi
span
ic
Below 100%
100%-199%
200%+
Poverty Level Percent Re p o rting That a Disabil ity Affects Their Ability to WorkA minority of persons age 50 to 64 who
report that a disability
hasaffected their
ability to work actually receives Social
Security disability insurance (SSDI)
payments. The long application and
appeals process may present more of a
barrier to low-income workers who are
unable to afford legal help.
Figure 8: Social Security Disability Insurance Assists a Small Percentage of Those
Aged 50 to 64 Who Report a Disability That Affects Their Ability to Work
9.7
10.9
8.4
0% 3% 6% 9% 12% 15% Below 100% 100-199% 200%+Poverty Level
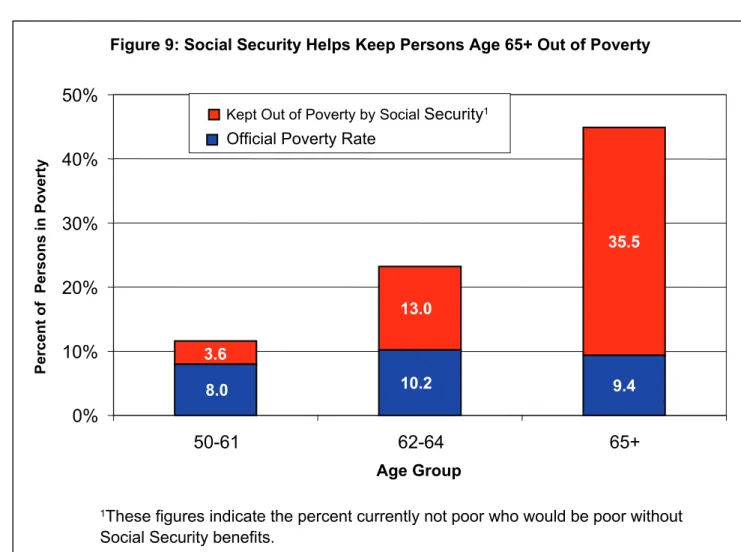
Percent Recei ving SSDIWithout Social Security benefits, and in
the absence of offsetting increases in
work or savings, the
povertyrate for
persons age 65+ would increase from 9.4
percent to 44.9 percent.
Figure 9: Social Security Helps Keep Persons Age 65+ Out of Poverty
8.0
10.2
9.4
13.0
35.5
3.6
0%
10%
20%
30%
40%
50%
50-61
62-64
65+
Age Group
Percent of P ersons in Po ve rt yKept Out of Poverty by Social
Security
1Official Poverty Rate
1
These figures indicate the percent currently not poor who would be poor without
Social Security benefits.
With age Social Security assumes
increasing importance, regardless of
race. Hispanics have the lowest rates of
Social Security receipt at all income
levels and ages. At age 65+, Whites
above the poverty line have the highest
rates of receipt.
Figure 10: Social Security Is Important to All Racial and Ethnic Groups
6.7 41.0 71.2 43.6 4.9 59.7 16.7 22.9 92.9 89.4 39.2 69.4 15.7 45.5 71.4 20.8 89.3 79.8 41.6 4.5 8.4 61.2 38.6 10.9 77.8 73.2 37.1 0% 25% 50% 75% 100% 50-61 62-64 65+ 50-61 62-64 65+ 50-61 62-64 65+ Below 100% 100-199% 200%+ Poverty Level Percent Re ce iv ing Social Security
White African - American Hispanic
At the higher income levels, men age 65+
are more likely than women in the same
age group to have pensions, 401(k)s or
other non-Social Security income. Below
poverty, however, the rates
forboth
sexes are about equal, though far lower.
Figure 11: Men Are Generally More Likely Than Women to Have a Pension,
401(k) or Other Retirement Income at Age 65+
2.7 7.4 9.4 23.2 16.5 61.0 19.2 47.2 15.5 8.7 7.9 3.6 0% 10% 20% 30% 40% 50% 60% 70% 50-64 65+ 50-64 65+ 50-64 65+ Below 100% 100-199% 200%+ Poverty Level
P
er
cent with
P
en
sion or
Other
Retirem
ent Incom
e
Men
Women
At all income levels, Whites are the most
likely and Hispanics the least likely to
have a pension, 401(k), or other
non-Social Security source of retirement
income. Hispanics are less likely to have
worked in jobs covered by pensions and
more likely to have immigrated to the
United States mid-way through their
working life.
Figure 12: For Households Aged 65+, Whites Are Most Likely and Hispanics Are Least
Likely to Have Pension 401(k) or Other Non-Social Security Retirement Income
21.8 56.1 9.5 53.6 19.1 5.4 36.2 11.9 3.6
0%
15%
30%
45%
60%
75%
Below 100%
100-199%
200%+
Poverty Level
Pe
rcent w
ith Pension or Other
Retiremen
t I
n
c
o
me
White
African-American
Hispanic
At incomes below poverty and at twice the poverty level and above, married women age 65+ are more likely than other women in this age group to have retirement income from pensions or 401(k)s. Divorced women below poverty are the least likely to have income from these sources. Widows generally have lower rates of receipt of retirement income than other women.
Figure 13: Married Women Aged 65+ Living in Poverty Are
More Likely Than Other Impoverished Women to Have Pensions,
401(k)s or Other Non-Social Security Retirement Income
9.3 62.4 3.3 35.4 6.2 18.0 48.5 4.2 35.5 59.2 19.5 5.3 36.8 15.6 40.3 0% 10% 20% 30% 40% 50% 60% 70% Below 100% 100-200% 200%+
Poverty Level
Ha ve Pension, 40 1(k) orOther Retirement Income
Married Widowed Divorced Separated Never Married
Persons age 65+ who are living alone are generally less likely than persons living with others to have income from earnings or retirement income from pensions or 401(k)s. Persons living alone, in contrast, tend to be more likely to receive income from Social Security than do persons living with others.
Figure 14: Persons Aged 65+ Who Are Living Alone Are Less Likely to Have
Earnings or Retirement Income But More Likely to Receive Social Security Benefits
2.7 80.4 66.9 96.0 91.6 52.8 30.3 23.8 6.5 15.4 90.1 92.0 9.2 7.3 23.3 51.1 56.8 19.3 0% 25% 50% 75% 100%
Living alone Living with others
Living alone Living with others
Living alone Living with others Below 100% 100-199% 200%+ Percent P ers ons Liv ing Alone w ith Select ed Be nefits
Earnings Social Security Retirement
Persons with incomes up to twice the poverty line are clearly at greater risk of not having health insurance coverage: only 62.5 percent of persons age 50 to 64 below poverty are covered by Medicaid, employer-sponsored or private health insurance. At age 65+, the availability of Medicare ensures that almost (but not quite) everybody has health coverage (not shown).
Figure 15: Health Insurance Coverage Is Limited for Persons
Aged 50 to 64 at Lower Incomes
32.8 17.2 31.9 52.0 2.4 87.1 0.0% 25.0% 50.0% 75.0% 100.0% Below 100% 100-199% 200%+ Poverty Level Percent w ith Medicaid , E m ploy er-Sponsored, or Pri vate Health In suran ce Other Insurance Medicaid
Source: 2007 Current population Survey March Supplement
64.769.2
Unemployment poses a clear hazard to health insurance coverage, especially at the lowest income level. Only about half of persons age 50 to 64 with incomes up to twice the poverty line who report they are unemployed but looking for a job have any public, employer-sponsored, or private health insurance. Coverage rates for the unemployed age 50 to 64 are significantly lower than for all persons age 50 to 64 (shown on page 32).
Figure 16: Unemployment Jeopardizes Health Insurance Coverage for
Persons Aged 50 to 64
14.2 10.4 32.6 41.1 74.2 2.2 0.0% 30.0% 60.0% 90.0% Below 100% 100-199% 200%+ Poverty Level Percent of Unemploy ed Persons w it h Public, E m pl oy er-Sponsored or Pri vat e Health In sur anceOther Health Insurance Medicaid
Source: U.S. Census Bureau, 2007 Current Population Survey, March Supplement
46.8 51.5
Compared to all persons age 50 to 64 (chart shown on page 32), retired persons age 50 to 64 in poverty and in the at-risk group are somewhat more likely to have public, employer-sponsored or private health insurance coverage.
Figure 17: Retired Persons Age 50 to 64 Below Poverty and in the At-Risk Group
Are Somewhat More Likely to Have Health Insurance
Than the General Population
16.2 9.1 50.0 65.8 87.5 2.2 0.0% 25.0% 50.0% 75.0% 100.0% Below 100% 100-199% 200%+ Poverty Level Percent of Retired Per so n s w ith Publ ic , Employ er-Sponsored or P ri vate Health Insuran ce
Other Health Insurance Medicaid
Source: U.S. Census Bureau, 2007 Current Population Survey, March Supplement
66.2
74.9
Hispanics are the least likely of any ethnic group to have health insurance coverage of any type (Medicaid/Medicare, employer-sponsored or private). For the group age 50 to 64, about half of Hispanics with incomes up to twice the poverty line have health insurance coverage.
Access to Medicare greatly improves health coverage rates for persons age 65+, but coverage rates for Hispanics in this age group are still lower than for other ethnic groups.
Figure 18: Whites Are Most Likely and Hispanics Are Least
Likely to Have Any Type of Health Insurance Coverage
56.0 60.5 50.7 65.2 47.9 86.0 83.4 85.8 98.9 97.4 92.2 98.8 97.3 69.5 67.8 94.3 94.7 94.0 0% 25% 50% 75% 100% White
African- American Hispanic White African- American Hispanic White African- American Hispanic
Below 100% 100-199% 200%+ Poverty Level
P
er
cent Ha
vi
ng He
al
th In
sur
an
ce
50-64
65+
Persons below poverty depend heavily on Medicaid for health insurance. Differences by sex are generally minimal except for the fact that women age 50 to 64 below poverty are more heavily dependent on Medicaid than men. Asset tests reduce the number of persons below poverty who qualify for Medicaid.
Figure 19: Persons Below the Poverty Line Depend on Medicaid
29.1 25.2 16.4 6.0 4.5 2.1 12.8 2.6 17.9 13.5 35.5 27.1 0% 10% 20% 30% 40% 50% 60% 50-64 65+ 50-64 65+ 50-64 65+ Below 100% 100-199% 200%+ Poverty Level Percent P ers ons Rec ei ving Medicai d Male Female
African-Americans and Hispanics depend heavily on Medicaid: usage rates for some age and income levels are up to twice that of Whites. There are no significant differences across race by sex (not shown).
At age 65+, falling Medicaid rates are probably due to the fact that many people have begun collecting Social Security, Medicare and other retirement income (not shown).
Figure 20: African-Americans and Hispanics Rely on Medicaid More than Whites Do
21.5 3.5 38.5 29.4 13.0 8.4 3.5 1.7 17.5 14.8 27.5 9.7 21.4 34.4 34.0 4.6 18.1 34.3 0% 10% 20% 30% 40% 50% 50-64 65+ 50-64 65+ 50-64 65+ Below 100% 100-199% 200%+ Poverty Level Percent Re ce iv ing Medicaid
White African - American Hispanic
Women of every marital status depend on Medicaid. Married women are somewhat less likely than other women of similar ages and incomes to receive Medicaid.
Figure 21: Medicaid is Important to Women Below Poverty or
At-Risk Regardless of Marital Status
11.2 18.6 23.6 23.2 4.0 26.9 14.7 14.6 10.9 2.2 3.0 6.9 23.7 17.1 34.8 7.1 3.3 19.1 37.3 37.6 7.5 4.7 30.6 34.2 0% 5% 10% 15% 20% 25% 30% 35% 40% 50-64 65+ 50-64 65+ 50-64 65+ Below 100% 100-199% 200%+ Poverty Level Percent Re ce iv ing Medicaid
Married
Widowed
Divorced/Separated
Never Married
Persons age 50 to 64 who live in poverty rely heavily on public benefits. Medicaid, Supplemental Security Income (SSI), public housing and food stamps are the forms of benefits most frequently received by persons below the poverty line. Women are more likely than men to receive these benefits.
Table 5: Persons Below the Poverty Line Who Are
Age 50 to 64 Rely Heavily on Public Benefits
Men Women
Below 100%
Medicaid 38.8% 46.4%
Supplemental Security Income
(SSI) 16.3% 22.4%
Public Housing 10.2% 13.2%
Food stamps 25.1% 35.4%
Family income assistance 2.4% 4.0%
Energy assistance 8.6% 11.8%
Rent subsidies 4.4% 5.1%
100-199%
Medicaid 25.8% 28.5%
Supplemental Security Income
(SSI) 7.6% 11.1%
Public housing 4.5% 5.3%
Food stamps 7.5% 10.8%
Family income assistance 0.8% 1.9%
Energy assistance 3.9% 5.5%
Rent subsidies 1.6% 2.7%
200%+
Medicaid 6.2% 7.3%
Supplemental Security Income
(SSI) 1.6% 2.2%
Public housing 0.3% 0.6%
Food stamps 0.4% 0.9%
Family income assistance .1% 0.4%
Energy assistance 0.3% 0.3%
Rent subsidies 0.2% 0.2%
Persons age 65+ who are below the poverty line rely heavily on public benefits, although to a somewhat lesser extent than the group age 50 to 64. This is likely due to the availability of Medicare and Social Security to the older population. It is still generally, although not always, the case that women are more likely than men to receive these public benefits.
Men Women
Medicaid 31.2% 30.2%
Supplemental Security Income (SSI) 11.9% 14.0%
Public Housing 9.8% 13.0%
Food stamps 15.1% 18.5%
Family income assistance 0.6% 1.4%
Energy assistance 6.3% 8.5%
Rent subsidies 4.3% 4.5%
Medicaid 17.2% 16.4%
Supplemental Security Income (SSI) 5.1% 5.6%
Public housing 5.4% 7.8%
Food stamps 4.1% 5.6%
Family income assistance 0.3% 0.5%
Energy assistance 4.4% 5.0%
Rent subsidies 1.9% 2.8%
Medicaid 6.6% 8.4%
Supplemental Security Income (SSI) 1.5% 2.0%
Public housing 0.5% 1.2%
Food stamps 0.4% 0.8%
Family income assistance 0.1% 0.2%
Energy assistance 0.5% 0.8%
Rent subsidies 0.1% 0.4%
Source: U.S. Census Bureau, 2007 Current Population Survey, March Supplement
Table 6: Persons Below the Poverty Line
Who Are Age 65+ Depend on Public Benefits
100-199% Below 100%
Homeownership rises with age and with income. Persons age 65+ are more likely to own their own homes than those age 50 to 64 at all income levels.
Figure 22: Persons Age 65+ Are More Likely
to Own Their Homes Than Persons Age 50 to 64
49.7 60.7 85.0 62.5 72.6 87.8 0% 25% 50% 75% 100% Below 100% 100-199% 200%+ Poverty Level Percent O w n ing Home s 50-64 65+
Only one-third of poor African-Americans age 50 to 64 below the poverty line own their own homes, the lowest rate of any group. Whites are the most likely to own their own homes; at incomes above poverty, Hispanics are generally the least likely to own their homes. For all races, homeownership rises with income and age.
Figure 23: African-Americans and Hispanics Are Less
Likely to Own Their Homes Than Whites
60.0 66.6 88.1 68.4 75.5 89.0 63.3 70.5 32.9 78.5 53.2 56.8 78.7 58.2 51.0 68.9 45.9 36.3 0.0% 25.0% 50.0% 75.0% 100.0% Below 100% 100-199% 200%+ Below 100% 100-199% 200%+ 50-64 65+
Poverty Level and Age
Percent O
w
n
ing Home
s
Public housing assistance is received by over 10 percent of households below the poverty level. Households with incomes up to twice the poverty level also rely on housing assistance.
Figure 24: Households Below Poverty Rely on Public Housing Assistance
11.9 4.9 0.4 12.1 7.0 0.8 0% 2% 4% 6% 8% 10% 12% 14% Below 100% 100-199% 200%+ Poverty Level Percent Re ce iv ing Public Assist ance 50-64 65+
African-Americans age 50+ are more likely than other racial or ethnic groups to receive public housing assistance at all income levels.
Figure 25: African-Americans Age 50+ Are More Likely
Than Other Racial or Ethnic Groups to Receive
Public Housing Assistance
9.8 20.3 8.6 5.4 10.5 7.0 0.4 1.9 0.8 0% 5% 10% 15% 20% 25% White
African - American Hispanic White African - American Hispanic White African - American Hispanic
Below 100% 100%-199% 200%+ Poverty Level Percent Re ce iv ing Public Housing
Divorced/separated and never married persons are the most likely to receive public housing assistance and married persons the least likely at all income levels.
Figure 26: Persons Who Are Divorced, Never Married and Widowed Are
Significantly More Likely than Married Persons to
Receive Public Housing Assistance at Age 50+
5.5 11.6 14.9 15.9 2.5 6.9 8.8 10.1 0.2 0.8 1.3 1.2 0% 5% 10% 15% 20% 25% Married Widowe d Divor ced/S ep arate d Never Married Married Widowe d Divor ced/S ep arate d Never Married Married Widowe d Divor ced/S ep arate d Never Married
Below 100%
100-199%
200%+
Marital Status and Poverty Level
Percent Re ce iv ing Public Housing A ssistan ce
Section 3: Findings on Assets, Debt and the
Use of Financial Services from the Survey of
Consumer Finances
In 2000, Sue was divorced and in 2002 her 12-year old son became terminally ill with leukemia. Not only did she bear the burden of his illness, she bore the burden of the cost of his illness. This left her in debt and without credit. Sue has a 16-year old who lives at home and she is also the primary caregiver for her 2 ½-year old grandchild.
2007 AARP Foundation Women’s Scholarship Recipient
Net worth (total assets minus total debt) is a very important measure of the financial well-being of families in the Survey of Consumer Finances. Older families in the below poverty and at-risk groups have extremely low net worth, pointing to a lack of financial security for many middle-aged and older Americans.
Figure 27: The Median Net Worth of Families in the
Below Poverty and At Risk Groups
5,100 60,500 49,420 308,740 10,000 21,650 302,600 23,200 318,500
$
$100,000 $200,000 $300,000 $400,000 Below 100% 100-199% 200%+ Poverty Level 50+ 50-64 65+The median net worth of older African-American and older Hispanic families is significantly lower than the net worth of older White families. The disparities are greatest for those in the 50 to 64 age group. This situation is particularly worrisome given the fact that this age group should be building assets for retirement.
Figure 28: Median Net Worth of African-American and Hispanic Families Age 50 to 64
239,000 47,200 210,430 277,300 52,501 42,400 49,420 35,600 42,250
$
$100,000 $200,000 $300,000 50+ 50-64 65+ AgeWhite African-American Hispanic
The median net worth of families headed by women age 50+ and living in poverty is only about a tenth of that of similar families headed by men. In the at-risk group, the net worth of these female-headed families is less than half (41 percent) that of male-headed families.
Figure 29: The Median Net Worth of Single Females is Significantly Lower
than the Median Net Worth of Single Males or Couples Age 50+
23,500 59,200 385,140 43,600 84,300 253,800 4,260 34,700 179,250 $ $50,000 $100,000 $150,000 $200,000 $250,000 $300,000 $350,000 $400,000 $450,000 Below 100% 100-199% 200%+ Poverty Level Median N et Worth
Source: 2004 Survey of Consumer Finances; Unit of Analysis: Primary Economic Unit (PEU)
Married living with partner
Male head neither married or living with partner Female head neither married or living with partner
Housing is typically the most important asset in a family’s portfolio and the equity in a home can be an important source of retirement savings and security. Equity levels for older families in the below poverty and at-risk groups are modest. Equity is therefore a less available source of funds for these families in the event of a financial emergency or family crisis.
Figure 30: Families Below the Poverty Line Who Own Their Homes Have
Built Up Modest Equity
130,000 60,000 64,000 140,000 43,500 50,000 150,000 68,000 60,000 $ $40,000 $80,000 $120,000 $160,000 Below 100% 100-199% 200%+ Poverty Level Median Net Equity
50+
50-64
65+
Lower levels of net housing equity for older African-American and Hispanic homeowner families limit the availability of a potential financial resource to meet financial emergencies or health or personal needs.
Figure 31: The Median Net Housing Equity of Older African-American and Hispanic
Homeowner Families is Less Than That of Older White Homeowner Families
75,000 70,000 145,000 40,000 114,000 49,000 100,000 54,000 46,000
$-$40,000 $80,000 $120,000 $160,000 Below 100% 100-199% 200%+ Poverty Level Median Net Housing Eq u ityWhite African-American Hispanic
Families headed by single women and single men age 50 and over living in poverty have lower levels of net housing equity than married couples.
Figure 32: Single Homeowners Living in Poverty Have
Lower Net Housing Equity Than Married Couples
76,000 60,000 150,000 56,000 66,000 120,000 60,000 58,000 115,000 $ $20,000 $40,000 $60,000 $80,000 $100,000 $120,000 $140,000 $160,000 Below 100% 100-199% 200%+ Poverty Level Median Net Equity
Source: 2004 Survey of Consumer Finances; Unit of Analysis: Primary Economic Unit (PEU). Married living with partner
Male head neither married or living with partner Female head neither married or living with partner
Liquid assets (funds in checking, savings, and money market accounts) can provide a readily accessible cushion in the event of unexpected expenses. Median total liquid assets of older families in the below poverty and at-risk groups are very small or
insignificant. Consequently, when unforeseen expenses occur, such families may have to borrow or go without needed goods or services.
Figure 33: Families in the Below and At-Risk Groups
Have Very Low Levels of Liquid Assets
180 1,000 10,000 30 200 8,140 400 1,400 12,500
$
$2,000 $4,000 $6,000 $8,000 $10,000 $12,000 $14,000 Below 100% 100-199% 200%+ Poverty Level Median Liq u id Asset s50+
50-64
65+
Total financial assets include both liquid and quasi-liquid assets such as certificates of deposit, savings bonds, the cash value of life insurance, and stocks and bonds. Older families in the below poverty and at-risk groups have few financial assets.
Figure 34: Total Median Financial Assets of Families in the
Below Poverty and At-Risk Groups Are Extremely Low
800 600 900 3,000 96,600 2,400 1,800 95,350104,000
$
$40,000 $80,000 $120,000Below 100%
100-199%
200%+
Poverty Level50+
50-64
65+
Regardless of race, the median total financial assets of families in the below poverty and at-risk income groups are very low. However, the financial assets of African-American and Hispanic families in these groups are minuscule. For example, older African-American families in the below poverty group have less than half the financial assets ($630) of White families ($1,500). The financial assets of Hispanic families in the below poverty group are a little over a 10th ($200) of those of White families ($1,500).
Figure 35: Median Total Financial Assets of African-American and Hispanic
Families Age 50+ Are Significantly Lower Than Those of White Families Age 50+
1,500 113,660 4,000 630 1,650 25,250 14,900 200 1,000
$
$40,000 $80,000 $120,000Below 100%
100-199%
200%+
Poverty Level
White African-American HispanicThe median total financial assets of families headed by women age 50+ are approximately half those of families headed by men age 50+. The lack of financial resources of families in the below poverty group, regardless of the sex of the head of the family, is especially dire.
Figure 36: Median Total Financial Assets of Families Headed by Women Age
50+ Are Significantly Lower Than Families Headed by Men Age 50+
1,000 700 116,500 4,100 2,000 62,000 $ $40,000 $80,000 $120,000 $160,000 Below 100% 100-199% 200%+ Poverty Level Men Women
Opening a checking account to manage cash flow and make payments is usually a
fundamental step towards building financial assets and developing savings. Yet over a third of families headed by someone age 50+ in the below poverty group do not have a checking account. Many low-income families, as a substitute for formal banking
arrangements, are using check cashers and other alternative financial outlets that charge hefty fees for cashing checks and handling other payment transactions. Over time, use of such high cost services can significantly reduce the funds these families have available to place in savings.
Figure 37: Families in the Below Poverty and At Risk Groups are Less Likely
Than Higher Income Families to Have a Checking Account
34.3 14.3 3.0 19.5 3.1 24.3 2.8 41.9 11.6
0%
15%
30%
45%
60%
Below 100%
100-199%
200%+
Poverty Level
P
er
cent Withou
t An
Account
50+
50-64
65+
African-American and Hispanic families age 50+ in all income groups are much less likely to have checking accounts than White families age 50+. Nearly half of African-American and Hispanic families in the below poverty group do not have checking accounts compared to less than one-quarter of White families. The disparity in the at-risk group is even greater with almost one-third of African-American and Hispanic families lacking a checking account compared to less than 8 percent of White families.
Figure 38: Nearly Half of Older African-American and Hispanic Families
Age 50+ in the Below Poverty Group Lack Checking Accounts
22.4 7.6 1.7 19.5 11.0 32.4 47.2 26.4 49.9 0% 15% 30% 45% 60% Below 100% 100-199% 200%+
Poverty Level
P
er
cent Withou
t an A
ccount
White
African - American
Hispanic
Families age 50+ in the below poverty and at-risk groups have account ownership rates that are 65 percent and 38 percent lower,
respectively, than families age 50+ with incomes at or above 200 percent of poverty. Almost 8 out of 10 families age 50+ in the below poverty group and 6 out of 10 in the at-risk group lack a savings account of any type. Equally worrisome is the low level of
ownership among those of pre-retirement age (50 to 64) who are in the at-risk group and are in a time of their lifecycle where accumulation of savings is critical.
Figure 39: Only One-Fifth of Families Headed by a Person Age 50+
in the Below Poverty Group Have a Savings or Money Market Account
20.7 20.8 61.3 54.6 36.4 58.5 18.3 44.6 24.0 0% 25% 50% 75% Below 100% 100-199% 200%+
Poverty Level
P
er
cent With an
Ac
cou
nt
50+
50-64
65+
White families age 50+ are twice as likely as Hispanic families age 50+ and one and a half times as likely as African-American families age 50+ to own a savings or money market account.
Figure 40: Older Hispanic and African-American Families
Are Less Likely Than Older White Families to Have a
Savings or Money Market Account
55.0 52.3 25.5 24.8 26.5 57.5 36.4 37.8 34.6 0% 25% 50% 75% 100% 50+ 50-64 65+
Age Group
P
er
cent With an
Ac
cou
nt
White
African - American
Hispanic
Nearly 6 out of 10 older families headed by women are without savings or money market accounts.
Figure 41: Older Families Headed by Women Are Less Likely
Than Older Families Headed by Men to Have a Savings or
Money Market Account
52.1 42.5 39.7 57.4 55.2 44.9 0% 25% 50% 75% 100% 50+ 50-64 65+ Age Group Percent W ith an Acc ount
Men
Women
Few families in the below poverty and at-risk income groups, 6.2 percent and 12.9 percent respectively, have retirement accounts. In contrast, almost two-thirds (63.5 percent) of families with incomes at or above 200 percent of poverty have such accounts.
Figure 42: Very Few Families Aged 50+ in the Below Poverty
and At-Risk Groups Have Retirement Accounts
6.2
63.5
12.9
0% 20% 40% 60% 80% Below 100% 100-199% 200%+Poverty Level
Percent W ith an Acc ountPurchasing shares in a mutual fund is the most common method, outside of participating in employer-based retirement plans, of investing in stocks and bonds. While one-quarter of families age 50+ with incomes at or above 200 of poverty own mutual funds independent of retirement accounts, less than five percent of those in the below poverty and at-risk groups have such investments.
Figure 43: Very Few Older Families in the Below Poverty and At-Risk Groups
Own Mutual Funds*
2.1 4.4 1.8 3.9 2.5 4.7 24.6 23.9 23.4 0% 5% 10% 15% 20% 25% 30% Below 100% 100-199% 200%+
Poverty Level
Percent W ith an Acc ount50+
50-64
65+
Life insurance can help sustain income and pay expenses following the death of a spouse or family member. Older families in the below poverty and at-risk groups are significantly less likely to have life insurance than older families with incomes at or above 200 percent of poverty. Further, among families in the below poverty and at-risk groups, those headed by persons of pre-retirement age (50 to 64) are least likely to have insurance. Since these younger heads of families are more likely to be working than the 65+ age group, the loss of the head of a family could entail financial as well as psychological hardships.
Figure 44: Families in the Below Poverty and in the At-Risk Group Are
Less Likely to Have Life Insurance
49.2 76.6 51.0 70.1 32.4 28.7 45.9 81.3 37.3 0% 25% 50% 75% 100% Below 100% 100-199% 200%+
Age Group
Percent w ith Life In suran ce50+
50-64
65+
In 2004, almost 1 in 5 families age 50+ in the below poverty group had debt payments in excess of 40 percent of total income, as measured by the Federal Reserve Board --this is considered a high debt burden. Further, the percentage of below poverty older
households in such circumstances has risen from 11 percent in 2001 to 18 percent in 2004, an increase of 63 percent. Over this time period, the percentage of age 50+ families with incomes at or above 200 percent of poverty and high debt burden declined to a level that was less than a third (5.6 percent) that of families age 50+ in the below poverty group.
Figure 45: The Percentage of Families Age 50+ in the Below Poverty with Debt in
Excess of 40 Percent of Income Has Increased by Two-thirds Since 2001
10.8 11.0 17.9 14.1 10.5 11.3 7.5 5.6 5.6 0% 5% 10% 15% 20% 25% 1998 2001 2004 Percent w ith High Debt B u rdens
Below 100%
100-199%
200%+
Source: Survey of Consumer Finances; Unit of Analysis: Primary Economic Unit (PEU)
Year
For those older families with credit cards, the median credit card balance as a percentage of income (the credit card debt burden) is highest for those in the below poverty and in the at-risk group. Families age 50+ in the below poverty have debt burdens four times that of families age 50+ with incomes at or above 200 percent of poverty. Families age 50+ in the at-risk group have twice the credit card debt burden of families age 50+ with incomes at or above 200 percent of poverty.
Figure 46: The Burden of Credit Card Debt Is Highest for
Families Age 50+ Below Poverty and At-Risk of Poverty
16.7 18.5 6.9 3.8 6.2 4.3 8.1 8.1 7.2 0% 10% 20% 30% Below 100% 100-199% 200%+
Poverty Level
Median Cred it Card Bala n ce a s a P erc entage o f Inc o me50+
50-64
65+
It is often assumed that retirement-age families have little or no housing debt. However, a substantial percentage of families age 65+ below poverty (11 percent) and in the at-risk income groups (16
percent) carry mortgage debt. For the pre-retirement-age group (50 to 64), more than one-fifth of those with incomes below poverty (22 percent) and one-third of those in the at-risk group are carrying mortgage debt.
Figure 47: A Significant Percentage of Families in the
Below Poverty and in the At-Risk Group Have Mortgages
22.0 50.2 42.1 17.3 56.2 21.9 32.6 63.9 16.4 25.3 30.7 11.2 0% 15% 30% 45% 60% 75%
Below 100% 100-199% 200%+ All Incomes
Poverty Level Percent w ith Mortgage D ebt
50+
50-64
65+
Regardless of income, a higher percentage of families headed by persons of pre-retirement age (50 to 64) filed for bankruptcy in the last seven years. This is likely to have a
significant impact on the readiness of these families to retire. In the age 50+ population as a whole, the percentage of families filing for bankruptcy is highest among families with incomes below poverty, indicating their precarious financial situation and lack of financial options.
Figure 48: Families Headed by Persons of Pre-Retirement Age (50 to 64)
Are Most Likely to Have Filed for Bankruptcy in the Last 7 Years
5.7 4.4 4.2 8.6 7.3 4.7 2.9 3.5 1.8 0% 3% 6% 9% 12% 15% Below 100% 100-199% 200%+ Poverty Level Percent F ilin g for Bankru ptcy
50+
50-64
65+
Section 4: Selected National and State
Housing and Utility Characteristics from the
American Community Survey
Joy B., TX
“I am a retired widow living solely on SS. I am in the "gap" with Medicare. My
prescriptions have been averaging $700 a month for the last several months. There are no extras in my life. I can't afford cable so I don't get TV reception. I have no cell phone. I buy my clothes from thrift stores. I drive a 12 yr old car. My only entertainment is books from the library and a few
magazine subscriptions. I may have to cut the magazines. Insurance premiums, gas, groceries, everything, is going up. SS is increasing next year. That's not even a cost of living increase. Something needs to be done about the "gap". …”
Selected National and State Housing and Utility
Characteristics from the American Community Survey
Tables in this chart book displaying selected National and state level housing and utility characteristics for households age 50+ were derived from the U.S. Census Bureau’s 2006 American Community Survey (ACS). Nationally and in 34 states, homeownership rates exceed 50 percent, even for households living below poverty. Lower-than-average homeownership rates are found in the Northeastern states and Washington, DC; in California, Nevada, and Hawaii; in some north central states such as North Dakota and South Dakota; and in northwestern states such as Oregon and Washington. Homeownership rates rise with income to reach a national average of 86 percent for households with incomes at or above 200 percent of poverty.
Continuing to pay a mortgage after age 50 places great stress on lower-income households according to the analysis of the ACS. For many low-income homeowners the combined costs of principal, interest, taxes, and insurance (PITI), and energy and water utilities exceeds annual income. These households are likely surviving by drawing down assets, by going into debt (including taking money out of the home through refinancing), by borrowing from friends or family, and through a variety of government assistance programs including property tax abatements, utility assistance to low-income families, the earned income tax credit, and tax breaks for mortgage interest and property taxes. In addition, some homeowners may have small businesses or investments that result in negative profits and therefore lower the recorded household income or they may not work throughout the year resulting in a negative cash flow. Some state results with regard to the percentage of income spent on PITI and energy and water utilities that are described in the tables may be less reliable than the national results or the results from other states due to small sample sizes. Although there is not a standard reliability threshold for interpreting survey results, the tables highlight for the reader any sample estimates based on 30 or fewer observations.
It is also important to note that homeowners living in poverty who have paid off their mortgages still have significant expense burdens. Energy, water, and tax payments by these households absorb on average across the country 45 percent of their income. In addition, renters living in poverty pay about 66 percent of their income, on average across the country, on rent, energy, and water. This is well above the U.S. Department of Housing and Urban Development’s (HUD) affordability standard of 30 percent of income. Expenditures of more than 50 percent of income for housing are considered “excessive” by HUD. In contrast, the average percentage of income spent on housing and utilities by households with incomes at or above 200 percent of poverty are much lower: 20 percent for those with a mortgage, 9 percent of income when the mortgage has been paid off, and 22 percent of income for higher-income renters.
Finally, households with incomes below poverty are four times less likely to have a telephone (including cell phone service) than households with incomes at or above 200 percent of poverty. Because of safety and security concerns, access to a telephone is considered particularly important to older households
.
State Owner
Own house
free and clear
Median PITI,
1energy and
water utilities of
homeowners with a
mortgage
Median taxes and
insurance, energy
and water utilities of
homeowners without
a mortgage