I n t e r i m R e p o r t
Financial Year
201 5/16
1
sthalf
1 March to 31 August 2015
Mannheim, 8 October 2015 Co py ri gh t 2 01 5 © C ro pE ne rg ie s A GContact
CropEnergies AG Maximilianstr. 10 68165 Mannheim Investor Relations Heike Baumbach Phone: +49 (621) 714190-30 Fax: +49 (621) 714190-03 [email protected]Public Relations / Marketing
Nadine Dejung
Phone: +49 (621) 714190-65 Fax: +49 (621) 714190-05 [email protected] http://www.cropenergies.com Forward-looking statements and forecasts This report contains forward-looking statements. These statements are based on current estimations and forecasts of the executive board and information currently available to it. The forward-looking statements are not guarantees of the future developments and results mentioned therein. Rather, the future developments and results depend on a number of factors, entail various risks and imponderables and are based on assumptions that may not prove to be accurate. The opportunities and risk report on pages 62 to 70 of the 2014/15 Annual Report provides an overview of the risks. We do not accept any obligation to update the forward-looking statements made in this report.
Contents
Highlights 4
Interim management report 5
Operating environment 5
Business development 11
Report on events after the balance sheet date 16
Risk and opportunities report 17
Outlook 18
Interim financial statements 19
Statement of comprehensive income 19
Cash flow statement 20
Balance sheet 21
Development of shareholders‘ equity 22
Notes to the interim financial statements 24
Responsibility statement 34
Financial calendar 35
The figures stated in brackets on the following pages refer to the same period or point in time in the previous year.
CropEnergies AG’s financial year differs from the calendar year. The periods referred to are thus defined as follows:
2nd quarter: 1 June – 31 August
1st half: 1 March – 31 August
The interim report is also available in German. This English translation is provided for convenience only and should not be relied upon exclusively. The German version of the interim report is definitive and takes precedence over this translation.
Interim management report
Operating environmentStatutory framework in the EU
The EU's "Renewable Energies Directive" continues to define the legal framework for the mandatory target of 10% for renewable energies in the transport sector for the year 2020. The main prerequisite for biofuels to access the market in the EU is that they should comply with strict sustainability criteria, which place, for example, minimum requirements on sustainable biomass production and processing. This includes greenhouse gas savings of at least 35 wt.-% (from 2018: at least 50 wt.-%) in comparison with fossil fuels and rigorous documentation of the origin of the processed biomass. Moreover, the "Fuel Quality Directive" stipulates that, by the year 2020, there needs to be a reduction in greenhouse gases of 6 wt.-%, calculated in terms of overall fuel consumption.
Agreement on amending the current legal provisions
After the European Parliament and the Council of the European Union had given their consent to the amendment of the "Re-newable Energies Directive" and the "Fuel Quality Directive", the so-called "iLUC Directive" was published in the Official Journal of the European Union on 15 September 2015. Member states need to implement the Directive until the 9 September 2017. The agreement specifies that 7% of the stipulated 10% of renewable energies in the transport sector are allowed to come from con-ventional biofuels. The remaining 3% are to be achieved by using double counting of biofuels from wastes and residues, which will be additionally promoted, in part, by means of a sub-quota of at least 0.5%, and multiple counting of the electricity used in rail and road transport.
This decision paves the way for further decarbonisation of the transport sector by the year 2020. However, the iLUC factors will not be mandatory, as the extent of greenhouse gas emissions
Highlights 1
sthalf 2015/16
Revenues decline to € 390.4 (404.6) million -4% EBITDA grows to € 56.8 (13.5) million + € 43 million Operating profit rises significantly to
€ 39.7 (-4.4) million € + € 44 million
Net earnings increase to € 18.0 (-9.3) million + € 27 million Bioethanol production down to
422,000 (478,000) m³ -12%
Net financial debt decreases to € 103.5 (as of 28 February 2015: 150.1) million
Outlook for the 2015/16 financial year
increased
Revenues expected to increase to between € 700 and € 750 million
Operating profit (before restructuring costs and special items) expected to reach between € 50 and € 70 million
Source: NYMEX, CBOT, CEPEA/ESALQ 03/ 2012 800 700 600 500 400 300 200 03/ 2013 201403/ 201503/ 06/ 2012 201209/ 201212/ 201306/ 201309/ 201312/ 201406/ 201409/ 201412/ 201506/ 201509/ EU USA Brazil
reduction potential is not, however, producing the planned higher greenhouse gas savings, as the oil industry is instead reducing actual biofuel blending levels and again placing more fossil fuels on the market. This is undermining climate protection in the transport sector. The German biofuel industry is therefore calling for the increase in the greenhouse gas reduction target of 4 wt.-%, planned to take effect only from 2017 onwards, to be brought forward to 2016.
European ethanol prices continue to bounce back
Market observers expect global bioethanol production in 2015 to increase to 113.4 million m3 (+1.0%). This is due to the 1.4%
growth in the production of fuel ethanol to 95.7 million m3.
International bioethanol prices (€/m3)
In the USA, bioethanol production of 56.0 million m3 (+0.4%) and
a significant increase in net exports of bioethanol to 3.4 million m3
(+22.9%) are expected in 2015. In view of the huge production surplus in the USA, the one-month futures contract for ethanol was almost invariably trading below the € 400/m3 mark on the Chicago
Board of Trade (CBOT) from March until August 2015, with prices equivalent to around € 345/m3 prevailing at the end of August 2015.
The continuing low price of oil, which, in August 2015, fell to US$ 40/barrel for the US grade West Texas Intermediate (WTI) for the first time in six years, also contributed to the low price level. from indirect land use changes (iLUC) is controversial and can
currently be derived only in model-theoretic terms. While these conjectured indirect effects are to be reported on in future, the fact that they are not to be directly allocated to individual biofuels is to be welcomed. What is regrettable, however, is that the double counting of biofuels from wastes and residues and the additional multiple counting of electricity in the transport sector significantly lessen the incentive to replace fossil fuels and hence to actually reduce greenhouse gases.
Overall, CropEnergies welcomes the agreement by Parliament and Council, which puts an end to a discussion that has been ongoing since 2012 and the associated uncertainty. Together with the bioethanol associations at national and European level, CropEnergies is now focusing on rapid and appropriate imple-mentation of the new regulations at national level. Furthermore, in discussions regarding a climate and energy package for 2030, CropEnergies will campaign for the continuation of the promotion of sustainably produced biofuels.
Germany: decarbonisation of fuels
In Germany, the biofuel quota that had hitherto been applicable was replaced by a greenhouse gas reduction target with effect from 1 January 2015, the aim being to bring about a 3.5 wt.-% reduction in greenhouse gas emissions in the fuel sector. From 2017 onwards, this reduction target is to rise to 4.0 wt.-% and, from 2020 onwards, to 6.0 wt.-%. Although the German bioetha-nol industry had pronounced itself in favour of the introduction of greenhouse gas reduction targets, it had called for more ambitious target specifications to fulfil the high greenhouse gas reduction potential of biofuels. The first quarterly report of the Federal Office for Agriculture and Food (BLE) supports this view. It found that biodiesel and bioethanol, with average greenhouse gas savings of 59.8% and 62.2%, respectively, far surpassed the legal minimum requirements in the 1st quarter of 2015. This high greenhouse gas
In Germany, fuel ethanol consumption is expected to fall by 4.8% to 1.4 million m3 in 2015. According to provisional consumption data,
fuel ethanol sales in Germany fell by 3.7% to around 710,000 m3
from January to June 2015. Sales of petrol fell by 2% to 8.9 million tonnes in the same period. In view of an 11.0% decrease in sales to 1.2 million tonnes, E10’s share of the petrol market declined to 14.1% (15.5%).
Moderate decline in grain and protein prices
According to its forecast published on 11 September 2015, the US Department of Agriculture (USDA) expects to see world grain production (excluding rice) of 2,006 million tonnes (-0.8%) in 2015/16, which is only slightly below last year’s record harvest. Given anticipated grain consumption of 1,998 million tonnes (+ 0.7%), a further increase in stocks to 451 (444) million tonnes is expected. In the 2015/16 grain year, the European Commission expects the grain harvest in the EU to decline by around 10% com-pared with the previous year. However, an above-average amount of grain, at 297 million tonnes, is still expected to be harvested, and the anticipated consumption, at 283 million tonnes, is set to be significantly exceeded once more. The use as animal feed, with a share of more than 60%, accounts for the majority of grain consumption. With net exports of 26 (36) million tonnes, the EU continues to make a significant contribution to the supply of the world market. Only 11 million tonnes of grain are expected to be Bioethanol production in Brazil is expected to stand at
28.6 mil-lion m3 (-1.3%) in the 2015/16 sugar year. In view of a significant
rise in domestic demand to 28.7 million m3 (+7.0%), a balanced
supply situation is expected. The rise in domestic demand is due, among other things, to the increase in the minimum blending level of bioethanol to 27 vol.-% (E27) from mid-March 2015. Despite the dynamic growth in demand, ethanol prices fell to the equivalent of around € 330/m3 in the reporting period. The good
progress of the sugar cane harvest so far and the devaluation of the Brazilian Real, which has lost around a quarter of its value against the US dollar since the beginning of the year, were also contributory factors here.
Ethanol prices in Europe, on the other hand, were largely able to shield themselves from the negative international indicators and continued their recovery. Having stood at around € 535/m3 at the
beginning of June 2015, prices had risen to € 560/m3 FOB Rotterdam
by the end of August 2015. This development was due, among other things, to a seasonal rise in demand, which coincided with a tight supply situation, particularly on the main European marketplace for bioethanol in Rotterdam. Owing to continuing overcapacities as a result of muted growth in demand in the EU and overall low price levels outside the EU, a sustained recovery of European ethanol prices cannot currently be expected.
In view of a decline in the consumption of petrol and without any momentum from an increase in blending targets, 2015 is expected to bring a further 5.4% reduction in the consumption of fuel ethanol in the EU to 5.0 (5.3) million m3. The production of fuel ethanol is
expected to decline accordingly to 5.1 (5.3) million m3. This means
that, again in 2015, the existing potential for a rapid and cost-effi-cient reduction in greenhouse gas emissions will not be maximised. Prompt introduction of E10 in further EU member states would speed up decarbonisation in the transport sector and therefore
improve the environmental footprint. Source: Euronext, CBOT
03/
2012 201206/ 201209/ 201212/ 201303/ 201306/ 201309/ 201312/ 201403/ 201406/ 201409/ 201412/ 201503/ 201506/ 201509/
EU milling wheat US soybeans
International agricultural prices (€/t)
600 500 400 300 200 100 0
Business development
Decline in the production of bioethanol and food and animal feed products
As expected, CropEnergies’ bioethanol production declined year over year to 422,000 (478,000) m3 in the 1st half of 2015/16.
The decline in production was primarily due to the temporary closure of the plant in Wilton, while the plants in Zeitz, Wanze and Loon-Plage operated at high capacity utilisation rates. Due to the reduction in bioethanol production, the production of food and animal feed products was also lower. However, the production of neutral alcohol was increased, after the plant with an annual production capacity of up to 60,000 m³ of high-quality food-grade neutral alcohol started operating in Zeitz at the beginning of the year. This plant will allow CropEnergies to exploit additional attrac-tive sales opportunities in traditional market segments (e.g. the beverage, cosmetics, pharmaceutical and chemical industries).
Revenues and net earnings
€ thousands 2nd quarter 1st half year
2015/16 2014/15 2015/16 2014/15 Revenues 192,619 196,689 390,391 404,556 EBITDA* 34,559 2 56,777 13,459 EBITDA margin in % 17.9% 0.0% 14.5% 3.3% Depreciation* -8,519 -8,890 -17,086 -17,855 Operating profit 26,040 -8,888 39,691 -4,396 Operating margin in % 13.5% -4.5% 10.2% -1.1%
Restructuring costs and
special items -4,020 0 -8,977 0 Income from companies
consolidated at equity -16 -38 -19 -69 Income from operations 22,004 -8,926 30,695 -4,465 Financial result -1,381 -1,174 -2,625 -2,405 Earnings before income taxes 20,623 -10,100 28,070 -6,870 Taxes on income -7,556 147 -10,089 -2,450
Net earnings (loss)
for the period 13,067 -9,953 17,981 -9,320 Earnings per share,
diluted/undiluted (€) 0.15 -0.11 0.21 -0.10
* Without restructuring costs and special items used for the production of bioethanol, with around a third of this
quantity flowing back into the market as food and animal feed products.
The decline in European wheat prices on Euronext in Paris to € 160/tonne at the end of August 2015, despite the reduced grain harvest in the EU, reflects the good supply situation globally. Prices are around € 25/tonne below the level reached at the beginning of June 2015.
The USDA is again expecting a record soybean harvest of 320 (319) million tonnes for 2015/16 and a further build-up of global stocks to 85 (79) million tonnes. In reaction to this, the one-month soybean futures contract on CBOT fell back below the US$ 9/bushel* mark, equivalent to around € 295/tonne, at the end of August 2015 for the first time since October 2009. Rapeseed meal prices also fell by around € 50/tonne to approx. € 230/tonne from the beginning of June 2015 to the end of August 2015.
.
Business development: 1st half
As expected, CropEnergies’ revenues in the 1st half of 2015/16,
at € 390.4 (404.6) million, were below the previous year’s level. This was mainly due to the production and sales volumes of bioethanol as well as food and animal feed products which are missing because of the temporary closure of the production plant in Wilton. This decline was only partially offset by revenues for bioethanol.
The higher revenues for bioethanol and the lower raw material prices resulted in a significant improvement in margins for CropEnergies. The temporary closure of the plant in Wilton also gives rise to an improvement in the operating cost structure, as the costs incurred there are classified as restructuring costs. This enabled CropEnergies to increase EBITDA significantly to € 56.8 (13.5) million.
After allowing for depreciation, there was also a substantial improvement in operating profit, which rose to € 39.7 (-4.4) million. The operating margin reached 10.2% (-1.1%). Restructuring or special costs of € 9.0 (0.0) million were incurred in the reporting period as a result of the temporary closure of the production plant in Wilton. Income from operations, as the sum of operating profit, earnings from entities consolidated at equity and special items, rose to € 30.7 (-4.5) million.
The financial result was virtually constant at € -2.6 (-2.4) million, as a result of which it was also possible to increase earnings before income taxes significantly to € 28.1 (-6.9) million. After taxes, this produces net earnings of € 18.0 (-9.3) million for the 1st half of
2015/16. That translates into earnings per share of € 0.21 (-0.10). The calculation is based on 87.25 million no-par-value shares.
Business development: 2nd quarter
Revenues fell slightly below the previous year’s level, reaching € 192.6 (196.7) million in the 2nd quarter of the 2015/16 financial
year. This was due not only to lower production and sales volumes of bioethanol caused by the temporary closure of the production plant in Wilton, but also to reduced trade volumes. This decline was fortunately offset by significantly higher revenues for bio ethanol.
The improvement in revenues on the bioethanol market conse-quently also benefited CropEnergies’ earnings situation. In addi-tion, lower raw material prices contributed to the improvement in earnings. Lastly, the costs incurred in Wilton during the closure of the production plant are classified as restructuring costs. Overall, EBITDA increased significantly to € 34.6 (0.0) million as a result of the effects described.
CropEnergies therefore also recorded a distinct improvement in operating profit, which rose to € 26.0 (-8.9) million. The operating margin reached 13.5% (-4.5%). Restructuring or special costs of € 4.0 (0.0) million were incurred in the reporting period as a result of the temporary closure of the plant in Wilton. Income from operations, as the sum of operating profit, earnings from entities consolidated at equity and special items, improved to € 22.0 (-8.9) million.
The financial result was virtually unchanged at € -1.4 (-1.2) million, as a result of which the earnings before income taxes also in-creased significantly to € 20.6 (-10.1) million. After taxes, this pro-duced net earnings of € 13.1 (-10.0) million for the 2nd quarter of
2015/16. That translates into earnings per share of € 0.15 (-0.11). The calculation is based on 87.25 million no-par-value shares.
Balance sheet structure
€ thousands 31 August 2015 31 August 2014 Change 28 Febru-ary 2015
Assets Non-current assets 481,176 499,369 -18,193 493,362 Current assets 126,582 157,755 -31,173 150,552 Total assets 607,758 657,124 -49,366 643,914 Liabilities and shareholders' equity Shareholders' equity 346,133 375,095 -28,962 331,660 Non-current liabilities 120,465 145,592 -25,127 157,863 Current liabilities 141,160 136,437 4,723 154,391
Total liabilities and
shareholders' equity 607,758 657,124 -49,366 643,914
Net financial debt 103,481 144,341 -40,860 150,148 Equity ratio 57.0% 57.1% 51.5%
Non-current assets declined by € 18.2 million to € 481.2 million as of 31 August 2015, with deferred tax assets, in particular, being reduced by € 16.9 million to € 7.4 million. As a result of scheduled depreciation and taking investments into account, fixed assets decreased by € 1.6 million to € 472.0 million. This includes goodwill, which was unchanged at € 5.6 million. Furthermore, the shares in companies consolidated at equity rose by € 0.3 million to € 1.7 million.
Current assets declined by € 31.2 million year over year to € 126.6 million. Inventory stocks, in particular, were reduced by € 22.5 million to € 39.6 million. Furthermore, trade receivables and other assets declined by € 10.1 million to € 75.1 million. This also includes the positive mark-to-market values from derivative hedging instruments of € 0.1 (0.2) million. Tax refund claims increased by € 5.6 million to € 5.9 million and cash and cash equivalents declined by € 4.2 million to € 6.0 million.
Statement of changes in financial position
€ thousands 1st half year
2015/16 2014/15
Gross cash flow 40,941 11,122
Change in net working capital 16,554 -765
Net cash flow from operating activities 57,495 10,357
Investments in property, plant and equipment
and intangible assets -10,865 -11,368 Cash received on disposal of non-current assets 39 44
Cash flow from investing activities -10,826 -11,324 Cash flow from financing activities -50,402 -2,744
Change in cash and cash equivalents due
to exchange rate changes -2 25
Decrease in cash and cash equivalents -3,735 -3,686
As a result of the increase in EBITDA, cash flow rose significantly to € 40.9 (11.1) million. Including the change in net working capital, cash flow from operating activities in the 1st half of 2015/16
amounted to € 57.5 (10.4) million.
The cash outflow from investing activities remained virtually constant at € 10.8 (11.3), being almost entirely accounted for by investments in property, plant and equipment. The investments served, in particular, to diversify the product portfolio and to make improvements in production plants.
The receipt of financial liabilities amounting to € 6.0 million was offset by repayments of € 56.4 million. This resulted in a net cash outflow from financing activities of € 50.4 (2.7) million.
Risk and opportunities report
CropEnergies uses an integrated system for the early detection and monitoring of group-specific risks. The successful treatment of risks is based on achieving an appropriate balance between income and risks. The company's risk culture is characterised by risk-conscious conduct, clearly defined responsibilities, independ-ence during risk controlling and the implementation of internal controls.
There are no risks posing a threat to the company's continued existence and there are none discernible at the present time. For detailed information on the risk management system and the group's risks and opportunities, please refer to the "Risk and Opportunities Report" on pages 62 to 70 of the Annual Report for the 2014/15 financial year. The disclosures provided there are still valid.
Non-current liabilities declined by € 25.1 million to € 120.5 million, with long-term financial liabilities being reduced by € 37.9 million to € 66.0 million through repayments. Other provisions increased, mainly due to the temporary closure of the production plant in Wilton, by € 13.7 million to € 15.8 million. Furthermore, deferred tax liabilities declined by € 2.5 million to € 21.7 million, while provisions for pensions and similar obligations rose by € 1.9 mil-lion to € 16.5 mil€ 1.9 mil-lion. Other liabilities declined by € 0.3 mil€ 1.9 mil-lion to € 0.4 million.
Current liabilities increased by € 4.7 million to € 141.2 million. Current tax liabilities increased by € 7.6 million to € 11.6 million. Other current provisions increased, due to the temporary closure of the production plant in Wilton, by € 9.5 million to € 14.2 mil-lion. On the other hand, short-term financial liabilities declined by € 7.1 million to € 43.4 million. Furthermore, trade payables and other liabilities declined by € 5.3 million to € 72.0 million. This also includes the negative mark-to-market values from derivative hedging instruments of € 7.5 (6.2) million.
On balance, net financial debt was significantly reduced to € 103.5 (144.3) million. Of the financial liabilities, € 66.0 million are long-term and € 43.4 million are due in the short term. Set against this, there are cash and cash equivalents of € 6.0 million.
Shareholders' equity decreased to € 346.1 (375.1) million. That corresponds to an equity ratio of 57.0% (57.1%).
Report on events after the balance sheet date
Since 31 August 2015, there have been no transactions of particu-lar importance which can be expected to have a significant impact on the assets, liabilities, financial position and profit or loss.
Interim financial statements
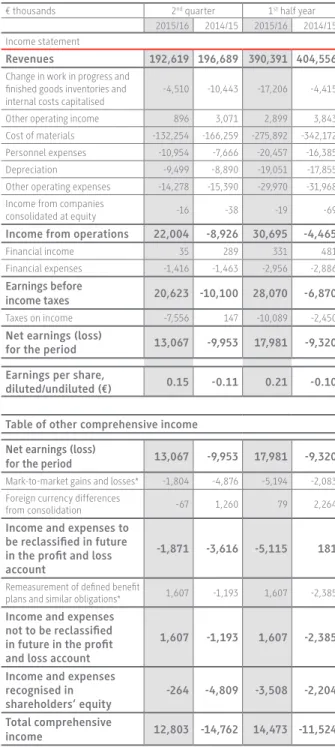
Statement of comprehensive income
€ thousands 2nd quarter 1st half year
2015/16 2014/15 2015/16 2014/15 Income statement
Revenues 192,619 196,689 390,391 404,556
Change in work in progress and finished goods inventories and internal costs capitalised
-4,510 -10,443 -17,206 -4,415 Other operating income 896 3,071 2,899 3,843 Cost of materials -132,254 -166,259 -275,892 -342,172 Personnel expenses -10,954 -7,666 -20,457 -16,385 Depreciation -9,499 -8,890 -19,051 -17,855 Other operating expenses -14,278 -15,390 -29,970 -31,968 Income from companies
consolidated at equity -16 -38 -19 -69
Income from operations 22,004 -8,926 30,695 -4,465
Financial income 35 289 331 481 Financial expenses -1,416 -1,463 -2,956 -2,886
Earnings before
income taxes 20,623 -10,100 28,070 -6,870
Taxes on income -7,556 147 -10,089 -2,450
Net earnings (loss)
for the period 13,067 -9,953 17,981 -9,320 Earnings per share,
diluted/undiluted (€) 0.15 -0.11 0.21 -0.10
Table of other comprehensive income Net earnings (loss)
for the period 13,067 -9,953 17,981 -9,320
Mark-to-market gains and losses* -1,804 -4,876 -5,194 -2,083 Foreign currency differences
from consolidation -67 1,260 79 2,264
Income and expenses to be reclassified in future in the profit and loss account
-1,871 -3,616 -5,115 181
Remeasurement of defined benefit
plans and similar obligations* 1,607 -1,193 1,607 -2,385
Income and expenses not to be reclassified in future in the profit and loss account
1,607 -1,193 1,607 -2,385
Income and expenses recognised in
shareholders‘ equity -264 -4,809 -3,508 -2,204 Total comprehensive
income 12,803 -14,762 14,473 -11,524
Outlook
The spot prices for bioethanol stabilized at a level above the previous year’s in the 1st half of 2015/16. The extent to which this
is sustainable remains uncertain in view of lower forward prices. Considerable volatility is therefore to be expected.
Owing to the temporary closure of the plant in Wilton, the pro-duction of both bioethanol, food and animal feed products will decrease in the 2015/16 financial year. The plants in Zeitz, Wanze and Loon-Plage are run at high capacity utilisation rates. Including trading, this is expected to ensure a sales volume for bioethanol of around 1 million m³. CropEnergies now expects revenues to range between € 700 and € 750 million.
In addition, as already reported on 22 September 2015, CropEnergies is markedly increasing its earnings forecast for the 2015/16 finan-cial year and expects to generate an EBITDA, adjusted for spefinan-cial items, of between € 85 and € 105 million. After depreciation, operating profit (before restructuring costs and special items) is expected to range between € 50 and € 70 million. Apart from this, special expenses of up to € 20 million are expected as a result of the temporary closure of the plant in Wilton.
The EU decisions to increase the proportion of renewable energies in the transport sector should ensure further market growth in the medium term. In particular, increasing the blending rates should result in E10 being introduced in additional member states. As one of the leading producers in Europe and owing to the flexibility and capacity of its plants, CropEnergies is well equipped for the corresponding increase in demand.
Balance sheet
€ thousands 31 August 2015 31 August 2014 Change 28 Febru-ary 2015
Assets
Intangible assets 10,072 10,626 -554 10,672 Property, plant and
equipment 461,927 462,967 -1,040 470,155 Shares in companies
consolidated at equity 1,709 1,369 340 1,728 Receivables and
other assets 46 45 1 46 Deferred tax assets 7,422 24,362 -16,940 10,761
Non-current assets 481,176 499,369 -18,193 493,362
Inventories 39,554 62,021 -22,467 63,631 Trade receivables and other
assets 75,093 85,242 -10,149 74,023 Current tax receivables 5,952 308 5,644 3,180 Cash and cash equivalents 5,983 10,184 -4,201 9,718
Current assets 126,582 157,755 -31,173 150,552 Total assets 607,758 657,124 -49,366 643,914 Liabilities and shareholders' equity Subscribed capital 87,250 87,250 0 87,250 Capital reserves 197,847 222,764 -24,917 222,764 Revenue reserves and
other equity accounts 61,036 65,081 -4,045 21,646
Shareholders' equity 346,133 375,095 -28,962 331,660
Provisions for pensions
and similar obligations 16,462 14,540 1,922 16,291 Other provisions 15,817 2,139 13,678 19,310 Non-current financial
liabilities 66,046 103,960 -37,914 99,064 Other liabilities 428 756 -328 704 Deferred tax liabilities 21,712 24,197 -2,485 22,494
Non-current liabilities 120,465 145,592 -25,127 157,863
Other provisions 14,219 4,666 9,553 18,558 Current financial liabilities 43,418 50,565 -7,147 60,802 Trade payables and
other liabilities 71,973 77,292 -5,319 73,858 Current tax liabilities 11,550 3,914 7,636 1,173
Current liabilities 141,160 136,437 4,723 154,391 Total liabilities and
shareholders' equity 607,758 657,124 -49,366 643,914
Cash flow statement
€ thousands 1st half year
2015/16 2014/15 Net earnings (loss) for the period 17,981 -9,320 Depreciation and amortisation of intangible assets,
property, plant and equipment and other investments 19,051 17,855 Other items 3,909 2,587
Gross cash flow 40,941 11,122
Change in net working capital 16,554 -765
I. Net cash flow from operating activities 57,495 10,357
Investments in property, plant and equipment
and intangible assets -10,865 -11,368 Cash received on disposal of non-current assets 39 44
II. Cash flow from investing activities -10,826 -11,324
Dividends paid 0 -8,725 Receipt of financial liabilities 6,000 32,696 Repayment of financial liabilities -56,402 -26,715
III. Cash flow from financing activities -50,402 -2,744 Change in cash and cash equivalents
(Total of I., II. and III.) -3,733 -3,711
Change in cash and cash equivalents due
to exchange rate changes -2 25
Decrease in cash and cash equivalents -3,735 -3,686
Cash and cash equivalents at the beginning
of the period 9,718 13,870
Cash and cash equivalents at the end
of the period 5,983 10,184
€ thousands 1st half year
2015/16 2014/15 Interest expense 2,184 2,632 Tax payments 4,954 4,702
Development of shareholders‘ equity
Revenue reserves and other equity accounts
€ thousands Subscribed capital Capital reserves Revenue reserves Cash flow hedges Cumulative foreign currency differences
Total Total consolidated shareholders‘
equity
1 March 2014 87,250 222,764 85,510 -2,158 1,978 85,330 395,344
Net earnings (loss) for the period -9,320 -9,320 -9,320
Mark-to-market gains and losses
on cash flow hedging instruments* -2,083 Foreign currency differences
from consolidation 2,264
Remeasurement of defined benefit plans
and similar obligations* -2,385
Income and expenses recognised
in shareholders‘ equity -2,385 -2,083 2,264 -2,204 -2,204
Total comprehensive income -11,705 -2,083 2,264 -11,524 -11,524
Dividends paid -8,725 -8,725 -8,725
31 August 2014 87,250 222,764 65,080 -4,241 4,242 65,081 375,095
1 March 2015 87,250 222,764 15,921 16 5,709 21,646 331,660
Net earnings (loss) for the period 17,981 17,981 17,981
Mark-to-market gains and losses
on cash flow hedging instruments* -5,194 Foreign currency differences
from consolidation 79
Remeasurement of defined benefit plans
and similar obligations* 1,607
Income and expenses recognised
in shareholders‘ equity 1,607 -5,194 79 -3,508 -3,508
Total comprehensive income 19,588 -5,194 79 14,473 14,473
Dividends paid 0 0 0
Other changes -24,917 24,917 0 0 24,917 0
31 August 2015 87,250 197,847 60,426 -5,178 5,788 61,036 346,133
Otherwise, the same accounting principles as used in the prepa-ration of the consolidated annual financial statements as of 28 February 2015 have been applied. Their explanations in the notes to the 2014/15 Annual Report in item (5) "Accounting principles" on pages 92 to 99 therefore apply accordingly. The number of employees is given as a full-time equivalent on the reference date.
Consolidated companies
The separate financial statements of CropEnergies AG and the entities which it controls (subsidiary companies) are included in the consolidated financial statements according to the principles of full consolidation. Control is deemed to be given if the company has the power to govern the financial and operating policies of an entity so as to obtain economic benefits from its activities. Accord-ingly, the following subsidiary companies are consolidated:
CropEnergies Bioethanol GmbH, Zeitz CropEnergies Beteiligungs GmbH, Mannheim BioWanze SA, Brussels (Belgium)
Ryssen Alcools SAS, Loon-Plage (France)
Compagnie Financière de l'Artois SA, Paris (France) Ensus Ltd, Yarm (United Kingdom)
Ensus UK Ltd, Yarm (United Kingdom)
Ryssen Chile SpA, Lampa, Santiago de Chile (Chile) CropEnergies Inc., Houston (USA)
The joint venture CT Biocarbonic GmbH, Zeitz, in which CropEnergies has a 50% interest and which is under joint manage-ment, is included at equity in the consolidated financial state-ments. CT Biocarbonic GmbH's contribution to earnings is thereby included only in earnings from entities consolidated at equity.
Notes to the interim financial
statements
Basis of preparation of the interim consolidated financial statements
The interim financial statements of the CropEnergies Group as of 31 August 2015 have been prepared according to the rules for interim financial reporting of IAS 34 in compliance with the International Financial Reporting Standards (IFRS) published by the International Accounting Standards Board (IASB) and their inter-pretation by the International Financial Reporting Interinter-pretations Committee (IFRIC). In accordance with IAS 34, the interim consol-idated financial statements of CropEnergies AG as of 31 August 2015 are presented in a condensed form. The interim consolidated financial statements as of 31 August 2015 have not been reviewed. The executive board of CropEnergies AG prepared these interim financial statements on 28 September 2015.
As shown in the notes to the Annual Report for the 2014/15 financial year in item (1) "Principles of preparation of the consol-idated financial statements" on pages 80 to 89, new or amended standards and interpretations were applicable for the first time to the interim reporting.
On 31 August 2015, a discount rate of 2.50% was used as a basis for major pension plans when calculating the provisions for pensions and similar obligations; on 28 February 2015 and 31 August 2014, respectively, the discount rate was based on 2.05% and 2.50%.
Income taxes were calculated on the basis of country-specific income tax rates, taking into account income tax planning for the entire financial year. Irrespective of the annual tax rate calculation, significant special items are fully recognised in the respective quarter.
Earnings per share
The overall net earnings of € 18.0 million for the 1st half of 2015/16
are fully attributable to the shareholders of CropEnergies AG. Earnings per share (IAS 33) have been calculated on the basis of 87.25 (87.25) million shares. This produces earnings per share for the 1st half of the 2015/16 financial year of € 0.21 (-0.10); there was no
dilution of earnings per share.
Inventories
€ thousands 31 August 2015 2014 Raw materials and supplies 14,426 18,320 Work in progress 3,048 4,380 Finished goods and merchandise 22,080 39,321
39,554 62,021
There was a volume-related reduction of € 22.5 million in invento-ries to € 39.6 million.
Trade receivables and other assets
€ thousands 31 August 2015 2014 Trade receivables 42,975 52,920 Receivables from affiliated companies 10,048 10,221 Other assets 22,070 22,101
75,093 85,242
Trade receivables and receivables from affiliated companies declined by € 10.1 million to € 53.0 million.
Other assets, amounting to € 22.1 (22.1) million, consist, in particular, of non-financial assets in the form of receivables from advance payments of € 11.0 (7.7) million and claims receivables of € 8.5 (5.7) million as well as financial assets in the form of positive mark-to-market values of derivative hedging instruments of € 0.1 (0.2) million and other financial assets of € 1.4 (1.7) million.
Revenue, profit, investment, and employees
€ thousands 1st half year
2015/16 2014/15 Revenues 390,391 404,556 EBITDA* 56,777 13,459 EBITDA margin in % 14.5% 3.3% Depreciation* -17,086 -17,855 Operating profit 39,691 -4,396 Operating margin in % 10.2% -1.1%
Restructuring costs and special items -8,977 0 Income from companies consolidated at equity -19 -69
Income from operations 30,695 -4,465
Investments in property, plant
and equipment and intangible assets 10,865 11,368
Employees 411 434
*Without restructuring costs and special items
EBITDA improved significantly to € 56.8 (13.5) million. After allowing for depreciation, there was also a substantial improve-ment in operating profit, which rose to € 39.7 (-4.4) million. The operating margin reached 10.2% (-1.1%). Restructuring or special costs of € 9.0 (0.0) million were incurred in the reporting period as a result of the temporary closure of the production plant in Wilton. Income from operations, as the sum of operating profit, earnings from entities consolidated at equity and special items, rose to € 30.7 (-4.5) million.
Of the capital expenditures, € 10.8 (11.3) million was on property, plant and equipment. Of the total, € 5.6 million was invested at CropEnergies Bioethanol GmbH and € 4.9 million at BioWanze SA. As of the end of the first six months of the 2015/16 financial year, the number of employees (converted into full-time equivalents) stood at 411 (434). Of the 411 employees, 42 were employed at CropEnergies AG, 116 at CropEnergies Bioethanol GmbH, 125 at BioWanze SA, 46 at Ryssen Alcools SAS, 75 at Ensus UK Ltd and 7 at Ryssen Chile SpA.
Financial liabilities
€ thousands 31 August 2015 2014 Liabilities to banks 4,875 15,389 Liabilities to affiliated companies 104,500 139,000 Liabilities from finance leasing 89 136
Financial liabilities 109,464 154,525
Cash and cash equivalents -5,983 -10,184
Net financial debt 103,481 144,341
Net financial debt as of 31 August 2015 decreased to € 103.5 (144.3) million. This includes long-term financial liabilities of € 66.0 (104.0) million.
All financial liabilities to banks are short-term. Of the financial liabilities to affiliated companies of the Südzucker Group, € 66.0 (99.0) million are due in more than one year.
Shareholders' equity
Shareholders' equity decreased to € 346.1 (375.1) million. The revenue reserves and other equity accounts consist of the retained net earnings for the year, the changes in cash flow hedges, pen-sions and similar obligations recognised directly in equity, and consolidation-related currency translation effects. The "cash flow hedges" item contains the changes in the mark-to-market values – including deferred taxes – of wheat and currency derivatives including accruals amounting to € -5.2 (-2.1) million.
Trade payables and other liabilities
€ thousands 31 August 2015 2014 Trade payables 33,457 36,074 Payables to affiliated companies 18,173 17,610 Other liabilities 20,343 23,608
71,973 77,292
Trade payables and liabilities to affiliated companies declined by € 2.1 million to € 51.6 million.
Other liabilities, amounting to € 20.3 (23.6) million, mainly com-prise financial liabilities in the form of negative mark-to-market values of derivative hedging instruments of € 7.5 (6.2) million and non-financial liabilities in respect of other taxes amounting to € 7.1 (7.2) million and liabilities in respect of personnel expenses of € 4.8 (4.1) million.
as of 31 August 2015, with book values of € 104.5 (139.0) million. Owing to their short maturities, it is assumed in the case of trade receivables, other receivables and cash items that fair values correspond to the book values.
The same applies to trade payables and other current liabilities. Further details on calculating the fair values of the individual financial instruments as well as their allocation to measurement levels can be found in the notes to the consolidated financial statements of the Annual Report for the 2014/15 financial year in item (28) "Additional disclosures on financial instruments" on pages 124 to 128.
Financial instruments and financial liabilities
Financial instruments
In the table below, the financial assets and liabilities calculated at fair value are classified by measurement level (fair value hierarchy) and are defined as follows according to IFRS 13:
Measurement level 1 comprises financial instruments traded on active markets, whose listed prices are taken over unchanged into the measurement. Measurement level 2 applies when measure-ment is based on methods whose influencing factors are derived di-rectly or indidi-rectly from observable market data. The measurement of level 3 derivatives is based on methods involving at least one significant influencing factor that cannot be observed. CropEnergies does not use any level 3 derivatives.
€ thousands Fair Value Hierarchy 31 August
2015 Level 1 Level 2 Level 3
31 August
2014 Level 1 Level 2 Level 3 Positive market values –
Cash flow hedge derivatives 51 0 51 0 141 0 141 0
Positive market values –
Derivatives held for trading 0 0 0 0 57 0 57 0
Financial assets 51 0 51 0 198 0 198 0
Negative market values –
Cash flow hedge derivatives 6,830 6,830 0 0 5,839 5,706 133 0 Negative market values –
Derivatives held for trading 652 501 151 0 397 296 101 0
Financial liabilities 7,482 7,331 151 0 6,236 6,002 234 0
Relations with related companies and persons (related party transactions)
"Related parties" for the purposes of IAS 24 (Related Party Disclo-sures) are Südzucker AG as majority shareholder, its executive and supervisory boards together with their close family members, and its subsidiaries (Südzucker Group), the joint venture CT Biocarbonic GmbH, and the members of the executive board and supervisory board of CropEnergies AG together with their close family members.
Financial liabilities
The fair values of liabilities to banks and affiliated companies are calculated as the present values of the cash outflows associated with the liabilities, based on the yield curve applicable on the respective balance sheet date. The fair values of liabilities to banks amounted to € 4.9 (15.7) million as of 31 August 2015, with book values of € 4.9 (15.4) million, while the fair values of liabil-ities to affiliated companies amounted to € 104.8 (139.0) million
As of 31 August 2015, there were receivables of € 9.9 (10.0) million outstanding from the affiliated companies of Südzucker AG and liabilities of € 10.4 (11.2) million outstanding to the affiliated com-panies of Südzucker AG in respect of the aforesaid related party transactions. Financial liabilities due to the affiliated companies of Südzucker AG amounted to € 50.0 (99.0) million.
The related party transactions with Südzucker AG and its affiliated companies were settled at usual market prices and interest rates; performance and consideration were commensurate, so no party was placed at a disadvantage. No significant transactions were conducted with related persons.
Services were provided and goods were supplied, at usual market prices, for the joint venture CT Biocarbonic GmbH amounting to € 0.7 (0.6) million in the 1st half of 2015/16.
There were no transactions with Süddeutsche Zuckerrüben- Verwertungs-Genossenschaft eG (SZVG) in the 1st half of the
2015/16 financial year.
Personnel matters
Dr. Guderjahn resigned from the supervisory board on 30 April 2015. A supervisory board member therefore needed to be elected for the remaining term of the current supervisory board. At the proposal of the supervisory board, which was based on the recom-mendation of the nomination committee, the annual general meet-ing on 14 July 2015 elected Dr. Wolfgang Heer, of Ludwigshafen/ Rhein, chairman of Südzucker AG. The election was effective from the adjournment of the annual general meeting on 14 July 2015 for the remaining term of the current supervisory board, that is until adjournment of the annual general meeting that decides on approval for the 2016/17 financial year. In the period up to the end of the annual general meeting on 14 July 2015, Dr. Heer was court-appointed as a member of the company’s supervisory board. Furthermore, there is Süddeutsche Zuckerrüben-Verwertungs-
Genossenschaft eG (SZVG), Ochsenfurt, whose own holdings of Südzucker shares plus the shares held in trust for its members represent a majority stake in Südzucker AG.
Südzucker AG
The transactions with Südzucker AG in the 1st half of the 2015/16
financial year involved supplies, especially raw materials and energy, by Südzucker AG amounting to € 23.8 (15.6) million. In addition, services worth € 1.6 (1.8) million and research & development work worth € 0.9 (1.1) million were provided.
Set against this, the CropEnergies Group received € 0.6 (0.5) million from Südzucker AG for supplies of goods. The CropEnergies Group incurred net interest expense of € 2.0 (2.3) million on intercompany lendings and borrowings.
As of 31 August 2015, there were receivables of € 0.1 (0.1) million outstanding from Südzucker AG and liabilities of € 7.8 (6.4) million outstanding to Südzucker AG in respect of the aforesaid related party transactions. Financial liabilities due to Südzucker AG amounted to € 54.5 (40.0) million.
Affiliated companies of Südzucker AG
The transactions with the affiliated companies of Südzucker AG in the 1st half of the 2015/16 financial year involved supplies,
especially raw materials and traded commodities, amounting to € 35.0 (38.7) million. In addition, services worth € 0.5 (0.5) million were provided.
Set against this, the CropEnergies Group received € 32.7 (30.1) million from the affiliated companies of Südzucker AG for supplies of goods. In addition, the CropEnergies Group received compensa -tion payments of € 1.1 (1.0) million and service revenues of € 0.7 (0.5) million.
Financial calendar
Report for the 1st to 3rd quarters of 2015/16 12 January 2016
Annual press and analysts' conference
for the 2015/16 financial year 18 May 2016
Report for the 1st quarter of 2016/17 6 July 2016
Annual General Meeting 2016 12 July 2016
Report for the 1st half of 2016/17 12 October 2016
Responsibility statement
To the best of our knowledge, and in accordance with the applica-ble reporting principles for interim financial reporting, the interim consolidated financial statements give a true and fair view of the net assets, financial position and results of operations of the group, and the interim management report of the group includes a fair re-view of the development and performance of the business and the position of the group, together with a description of the principal opportunities and risks associated with the expected development of the group for the remaining months of the financial year.
Mannheim, 28 September 2015
CropEnergies AG
The Executive Board
Joachim Lutz Michael Friedmann Dr. Stephan Meeder (Chief Executive