Understanding Inflation: Implications for Monetary Policy Stephen G. Cecchetti and Erica L. Groshen
NBER Working Paper No. 7482 January 2000
JEL No. E31, E58, J30
ABSTRACT
This paper discusses how optimal monetary policy is affected by differences in the combination of shocks an economy experiences and the rigidities it exhibits. Without both nominal rigidities and economic shocks, monetary policy would be irrelevant. Recognizing this, policymakers increasingly incorporate the understanding gained from new research on rigidities and shocks into both their policy actions and the design of monetary institutions. Specifically, shocks can be predominantly real, affecting relative prices, or primarily nominal, moving the general price level. They may also be big or small, frequent or rare. Similarly, some nominal rigidities are symmetrical, affecting both upward and downward movements equally, while others are asymmetrical, restricting decreases more than increases. After reviewing major trends in the conduct of monetary policy, we describe how the growing theoretical and empirical literature on shocks and rigidities informs three
crucial dimensions of monetary policymaking. First, we discuss why trimmed means provide the best measure of core inflation. Second, we outline how rigidities impede policymakers' ability to control inflation. And third, we describe how alternative shock/rigidity combinations create inflation's grease (whereby it improves economic efficiency by speeding adjustment) and sand effects (whereby it distorts price signals) with their contrasting implications for the optimal level of inflation. We conclude by considering some key implications for monetary policy.
Stephen G. Cecchetti Erica L Groshen
Department of Economics Bank for International Settlements
Ohio State University Centralbahnplatz 2
Columbus, Ohio 43210 CH-4002 Basle
1
INTRODUCTION
If prices and wages were perfectly °exible, monetary policy would be irrelevant. But casual observation suggests both that nominal prices and wages are at least somewhat rigid and that monetary policy has real e®ects. Economists' understanding of the nature of these rigidities has improved in recent years. At the same time, policymakers have begun to incorporate economists' theoretical and empirical ¯ndings in their institutions and actions. This paper explores the ways in which our empirical understanding of nominal rigidities informs three key dimensions of the conduct of monetary policy: how we measure core in°ation, how we control in°ation, and how we choose in°ation targets.
The overriding theme of our analysis is that an understanding of the nature of shocks and rigidities is crucial for the conduct of a sound monetary policy. Shocks and rigidities vary along a number of dimensions. E±cient in°ation measurement, optimal in°ation goals, and the e®ective execution of policy will all vary depending on these aspects of an economy's structure.
To be speci¯c, shocks can be predominantly real, a®ecting relative prices, or pri-marily nominal, moving the general price level. They may also be big or small, and they may be frequent or rare. Di®erent economies are susceptible to very di®erent types of shocks. For example, a country like the United States or a region like the European Monetary Union primarily faces small background shocks. Alternatively, Australia, a country heavily dependent on its exports of raw materials, and Norway, an oil-producing country, are more prone to occasional large shocks.
Similarly, there are several key di®erences in rigidities. Some nominal rigidities are symmetrical, a®ecting movements both up and down, while others exhibit more stickiness downward. In addition, rigidities can vary in their degree. For example, if symmetric wage and price stickiness is a result of costly adjustment (menu costs), then economies that have recently experienced high in°ation may have implemented price- and wage-change technologies that make individual changes less costly,
result-ing in more frequent adjustments and a lower level of symmetric stickiness. Downward rigidity will also vary among countries, depending, for example, on wage-setting prac-tices.
With this in mind, we begin our analysis by noting the diversity of approaches to the conduct of monetary policy around the world. Countries vary substantially in their choice of regime. Some target in°ation explicitly, others target money, and still others attempt to ¯x their exchange rates. Not surprisingly, their macroeconomic circumstances and outcomes have varied dramatically as well. These divergences raise questions about how various types of nominal rigidity a®ect each aspect of monetary policy. In particular, what evidence do we have of the existence of speci¯c rigidities, and what is the implication for the conduct of monetary policy?
The ¯rst monetary policy issue we address concerns the measurement of core, or trend, in°ation. Rigidities cause in°ation-induced price adjustments to occur asyn-chronously, an e®ect that introduces biases into the usual measures of price changes and lowers the signal-to-noise ratio in such measures. Recent research has advanced our understanding of these issues and o®ers some intriguing alternatives (such as medians and trimmed means) to the common average index.
Second, the nature and extent of rigidities create potentially variable lags in the monetary policy transmission mechanism, complicating the policymaker's job. The execution of policy requires forecasts of the variables of interest | normally output and in°ation | plus a quantitative estimate of the impact of policy changes. In addition to obscuring the level of trend in°ation, nominal rigidities make price and wage adjustments dependent on the actual pattern of shocks hitting the economy, introducing considerable uncertainty into in°ation forecasts, and complicating the measurement of the impact of policy substantially. Recent research illuminates the nature of this challenge and suggests how we might formulate policy in the face of this uncertainty.
mone-tary policymakers should target. Our paper looks at two combinations of shocks and rigidities and their contrasting implications for optimal targets. Symmetric rigidities with nominal shocks imply that optimal in°ation should be close to zero. Downward rigidities with real shocks imply that zero in°ation is too low a target.
We conclude our analysis by considering some implications of recent theoretical and empirical research on wage and price rigidity for the implementation of monetary policy. First, we suggest ways in which the in°ation trend can be more accurately measured, and second, we address the question of how best to select an in°ation target.
2
CONDUCT OF MONETARY POLICY
The decade of the 1990s has seen a convergence in the goals and methods used for the conduct of monetary policy around the world. A number of forces have driven this development. First, during the high in°ation of the 1970s and 1980s, many countries saw prices rise well in excess of 50 percent per year for extended periods.1 This experience led to a clear consensus that even moderate levels of in°ation damage real growth and that low in°ation must therefore be a primary objective of monetary policy. Casual observation suggests that low-in°ation countries experience higher growth rates, and so there are strong incentives to devise ways in which to keep in°ation low.2
Second, evidence indicates that in most countries, short-run money demand func-tions are unstable and so meaningful measures of money, such as M3, are very di±-cult to control. As a result, monetary targeting alone is no longer viewed as a viable strategy for stabilizing prices. Finally, excessive exchange rate volatility is seen as damaging. The discussion about the appropriate exchange rate regime is clearly
on-1Examples include Bolivia, Israel, and Argentina.
2The literature on the connection between in°ation and growth is large and growing, with less
going, but a shrinking cohort of countries organize their policy framework with the goal of reducing or eliminating °uctuations in the value of their currency relative to that of some anchor country. Since these anchor countries typically have low in°ation, this strategy calls for maintaining similar low rates.
As consensus has grown on these issues, many countries have redesigned their central banks and, for the most part, achieved remarkable reductions in in°ation.3 A survey of 77 countries reported in Morand¶e and Schmidt-Hebbel (1999) divides countries into three groups on the basis of their monetary policy regime: exchange rate targeting, monetary targeting, or in°ation targeting. The recent trend favors explicit or implicit in°ation targeting. At least ten countries or central banks now set explicit in°ation targets that clearly dominate any other targets or objectives. These countries are New Zealand, which in 1988 became the ¯rst industrialized country to adopt an explicit \hard" in°ation target; Canada, Chile, and Israel, which adopted in°ation targeting in 1991; the United Kingdom, which moved to explicit in°ation targets in 1992; and Australia and Sweden, which changed their policy frameworks in 1993; the Czech Republic and Spain which adopted targets in 1994 and 1995, respectively; and the European Central Bank, which announced a target in 1999. Morand¶e and Schmidt-Hebbel (1999) list a total of 45 countries that, over the past decade, have adopted some form of in°ation target: 12 industrialized, 12 transitional and 21 developing.4 Similarly, many other countries have changed their monetary regimes to target monetary aggregates or exchange rates with the goal of creating a credible low in°ation policy.5
3Mishkin (1999) provides a discussion of the recent international experience of various monetary
regimes.
4In their Table 1, Morand¶e and Schmidt-Hebbel (1999) also identify 34 countries that target
primarily money and 36 that target exchange rates.
5The political economy of monetary policy and the importance of credibility have been widely
studied. The research in this area has focused on the importance of a structure in which the central bank is independent of the elected o±cials in the government. See, for example, Alesina and Summers (1993). With independence of operation comes the need for central banks to be accountable for their performance, usually relative to an in°ation objective set by statute or agreement with other branches of government.
Regardless of the speci¯c target a country chooses for implementing monetary policy, central banks face a number of practical di±culties in maintaining low levels of in°ation. In°ation-targeting countries must specify an index to target, set a level for the target, decide whether to state the target as a band (for example, between zero and two percent) or as a point, and choose the number of quarters or years over which the target will be averaged. Similar choices must be made by countries that target money or exchange rates. These practical decisions are best based on a solid theoretical and empirical understanding of the processes underlying in°ation. Fortunately, in recent years, economic research has shed considerable light on these processes. The next three sections of this paper survey what we now know about core in°ation measurement, in°ation control, and the choice of an optimal long-term in°ation level.
3
CORE INFLATION MEASUREMENT
Before policymakers can hope to control in°ation, they must measure it; prefer-ably on a timely basis.6 This is a di±cult task that has attracted substantial at-tention among both academic and central bank economists.7 One of the primary di±culties associated with the measurement of in°ation is the presence of consider-able amounts of transitory noise.8 That is, monthly or quarterly in°ation readings can di®er signi¯cantly from the longer term trend in in°ation. A few numbers provide
6Throughout this section, we assume that measurement of core in°ation is a statistical problem
associated with the estimation of a long-run trend movements in prices. Other conceptions are surely possible, all of which would be based on structural economic models. For example, Quah and Vahey (1995), motivated by the concept of a long-run vertical Phillips curve, de¯ne core in°ation to be the component of measured in°ation that has no impact on real output in the long run. We shy away from such de¯nitions, as they are highly parametric and therefore unlikely to provide timely evidence on structural breaks in the in°ation process.
7The literature on core in°ation, now vast, began with Eckstein (1981). Wynne (1999) provides
a recent survey.
8A second di±culty is the presence of bias in price indexes. For recent work in this area, see the
some perspective. Over the past ¯fteen years, the standard deviation of (annualized) monthly changes in the U.S. Consumer Price Index has been 2.2 percentage points. Meanwhile, the 12-month changes have had a standard deviation that is half that value, or 1.1 percent; and the 36-month moving average has had a standard deviation of only 0.8. Clearly the monthly changes in consumer prices provide only limited information about the trend.
The experience of the ¯rst half of 1999 provides an excellent example of how noisy and confusing monthly CPI movements can be. The monthly readings varied between zero (there was no change from April to May) and nearly 9 percent (from March to April) at an annual rate. All the while, the trend was very likely somewhere between 2 and 3 percent per year. Although this example is surely extreme, it points out a serious practical problem. How far do monthly or quarterly aggregate price indexes have to move away from the perceived trend in in°ation before policymakers change their view of the trend? Put another way, when and how should monetary policymakers respond to what look initially like short-term in°ation changes?
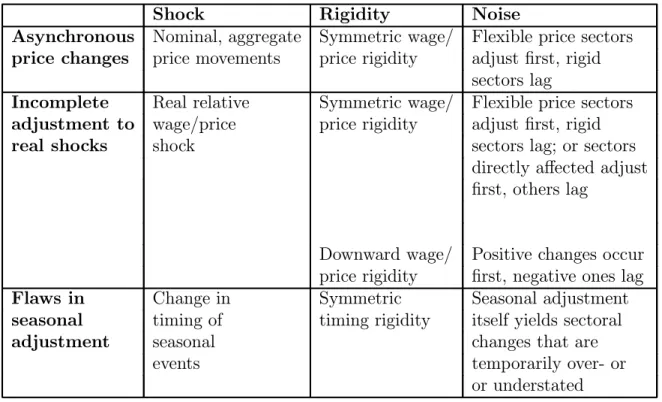
To address these issues, we ¯rst need to identify the sources of this noise. Once we have this information, we can start to ¯nd ways of reducing the noise in our measured indexes. Experience suggests that transitory moves in price indexes are often attributable to clearly discernible events. We can distinguish among three di®erent types of transitory CPI noise. These are summarized in Table 1, and we now describe them further.
First, in°ationary price changes are not uniform. That is, di®erent prices adjust at di®erent times because nominal price adjustment is costly and adjustment costs di®er across products. Prices which are costly to change (such as rents) will be more rigid, that is they will change less often, but by larger increments when they do. This variation leads to divergent in°ation measures across products and time even if the trend is unchanged.
mea-Table 1: Three Sources of Noise in In°ation Measurement
Shock Rigidity Noise
Asynchronous Nominal, aggregate Symmetric wage/ Flexible price sectors
price changes price movements price rigidity adjust ¯rst, rigid sectors lag
Incomplete Real relative Symmetric wage/ Flexible price sectors
adjustment to wage/price price rigidity adjust ¯rst, rigid
real shocks shock sectors lag; or sectors
directly a®ected adjust ¯rst, others lag
Downward wage/ Positive changes occur price rigidity ¯rst, negative ones lag
Flaws in Change in Symmetric Seasonal adjustment
seasonal timing of timing rigidity itself yields sectoral
adjustment seasonal changes that are
events temporarily over- or
or understated
sures of in°ation even if they are not associated with a nominal shock. Some sectors may be a®ected more rapidly than others because they are directly exposed, or be-cause they have more °exible prices. In addition, if prices are rigid downwards, then upward price movements will occur before the compensating downward adjustments. Broad-based resource shocks, such as variation in petroleum prices, will have widely divergent e®ects on the prices of di®erent consumer goods, and these do not all occur simultaneously. Exchange-rate shifts also a®ect prices di®erently; the prices of im-ported and import-competing goods are much more likely to change quickly than the prices of nontraded goods and services. Moreover, the size and timing of real shocks di®er across sectors, leading to heterogeneous price changes.
Finally, because the CPI is measured on a monthly basis, inexact seasonal adjust-ment can also add noise to in°ation measures. Firms with high costs of adjustadjust-ment
will limit the frequency with which they change prices. When these adjustments are coordinated among ¯rms within a sector, they produce recurrent patterns. In order to reveal movements in the trend, statistical agencies use various adjustment tech-niques to remove normal seasonal °uctuations from the monthly numbers. However, these techniques are not foolproof. In particular, minor changes in the timing of price adjustments | say, a decision by apparel manufacturers to change the prices of summer clothes in February rather than March one year | can confound seasonal adjustment. In that case, February would record a jump in in°ation matched by a corresponding drop in March.
These observations suggest that prices from di®erent sectors of the economy will contain di®erent amounts of information about in°ation trends. There is considerable variation both in the importance of shocks and in the degree of nominal rigidity. Some industries are more prone to large relative price movements than others, and some product prices are easier to change. Measuring the in°ation trend requires that we sort out the real shocks from the nominal ones on an economy-wide basis, taking account of these potentially large cross-sectional di®erences.
A common strategy used to estimate core in°ation is to systematically remove certain components of the price indexes. In the United States, it is standard to remove food and energy prices, both of which appear substantially more volatile than prices of other goods and services. The rationale is that short-term movements in these prices stem from rapid adjustment to frequent real shocks that are often reversed, and so they contain substantially less information about the long-term trend.
Returning to the experience of early 1999, we can see the bene¯ts of excluding food and energy prices when trying to gauge the in°ation trend. The highest reading of the CPI excluding food and energy is again from March to April, but the increase is estimated at just 4 3/4 percent (at an annual rate). The lowest reading is from January to February, and is slightly below 0.7 percent at an annual rate. By excluding food and energy, the range of in°ation readings over this brief ¯ve-month period is
reduced by more than one-half, from nearly 9 percent to just over 4 percent.
Still, the strategy of excluding food and energy relies on two arbitrary assumptions: that food and energy prices never contain information about the in°ation trend, and that other prices always do. Neither of these assumptions is likely to be true. An alternative approach would be to look to economic theory for guidance on how we might construct measures of trend or core in°ation. This strategy, adopted in a series of papers by Bryan and Cecchetti,9 is based on the observation that the economy is, roughly speaking, composed of two groups of price setters. The ¯rst have °exible prices in the sense that they set their prices every period in response to realized changes in the economy. Common examples include producers of fruits, vegetables, and motor fuel. The second group of price setters, by contrast, set prices infrequently, and face potentially high costs of readjustment. For example, we are thinking about those who set prices for housing rentals, restaurant meals or magazines at the newsstand.10 New Keynesian macroeconomic theory focuses on this second group in building models in which, as a result of sticky prices and menu costs, purely nominal disturbances have potentially long-lived real e®ects. The ¯rst group, the realization-based price setters, have the potential to create noise in standard price indexes. Because they can change their prices quickly and often, these ¯rms have little reason to care about long-term trends in aggregate in°ation. In sectors where prices are costly to change, price setters cannot correct mistakes quickly, and so the paths of their prices are much smoother. Prices set by these expectations-based price setters contain information about the trend that is not present in the °exible prices of the ¯rst group.
To give some indication of the relative volatility of di®erent prices, we have com-puted some simple standard deviations from monthly component price indexes. Look-ing at the period since 1985, we ¯nd that the highest variation is in the prices of fuel
9See Bryan and Cecchetti (1994) and Bryan, Cecchetti, and Wiggins (1997).
oil (for home heating), motor fuel (for cars), and fruits and vegetables. The stan-dard deviation of monthly changes in in°ation in these commodities (measured at an annual rate) ranges from 23 percent for the food stu®s to 45 percent for fuel oil. This is between 10 and 20 times the standard deviation in the overall CPI. At the other end of the spectrum are \food away from home" (restaurant meals) and shelter (which largely measures housing rental costs, or the rental equivalent value of home ownership){the only two signi¯cant components with less volatility than the overall CPI.
These observations have led to the development of a new set of price measures that combine existing price data di®erently. The logic, as described in Bryan and Cec-chetti (1994), is straightforward. Each ¯rm in the economy adjusts prices taking into account anticipated future developments. Following an initial adjustment, previously unanticipated shocks hit the economy. These real shocks create the desire for relative price adjustments. Only some ¯rms experience shocks that are large enough to make immediate adjustment worthwhile. As a result, the observed change in the aggregate price level will depend on the shape of the distribution of the desired adjustments. In particular, if this distribution is skewed (as often seems to be the case in practice), then the aggregate price level will move up or down temporarily. Once every ¯rm adjusts its prices, this transitory movement in the aggregate index disappears.11
The proposed solution to the problem of noise created by infrequent and asyn-chronous adjustment (in the absence of downward price rigidity) is to use alternative statistical procedures for combining the disaggregated in°ation information. The standard methodology for computing the aggregate CPI is to construct a weighted average of price data, in which the weights are based on expenditure surveys. But the sample mean is only one potential estimate of the central tendency of a distribution.
11If there is signi¯cant downward rigidity, and a signi¯cant number of ¯rms would wish to lower
their prices, the problem is even more severe. The process of complete adjustment can be very slow, and in the meantime the aggregate price level can move signi¯cantly, making real shocks look like nominal ones.
An alternative is to use the (weighted) median of the component in°ation data, as well as measures called trimmed means.12 Trimmed means are a generalization of the concept of a median. A sample of data is ¯rst ordered, as it is in the construction of the median, and then some percentage of the highest and lowest observations are eliminated while the remainder are averaged. For example, if one has 100 sample data points, then the computation of a 15 percent trimmed mean involves averaging the 70 observations in the center of the distribution.13
Trimmed means are a natural solution to the di±culties created by nominal rigidi-ties. In contrast to the average CPI excluding food and energy (which assumes that all noise comes from two sectors), the trimmed mean assumes that any extreme change is probably noise, no matter what sector it comes from. That is, the trimmed mean fo-cuses on the center of the distribution to tell us what the trend is doing. As noted just above, when ¯rms face costs of price adjustment, and the desired price changes are skewed, then the aggregate price index will contain transitory movements re°ecting the fact that only price setters who wish to make large moves will ¯nd it worth paying the cost. Substitution of a trimmed mean or the median for the sample average will reduce this source of noise and improve the signal policymakers need.
To see the di®erence this can make, we return to a comparison of the median CPI with the all-items CPI and the CPI excluding food and energy. Looking at the median in the ¯rst few months of 1999, we see that the lowest reading is 1.3 percent from February to March, and the highest reading is 3.6 percent, from March to April, both at an annual rate. Thus, the range for the all-items CPI is nearly 9 percent, for the CPI excluding food and energy, it is 4 percent, and for the median it is 2.3
12Wynne (1999) discusses several other alternatives, including weighting individual prices by the
inverse of their estimated variance. A procedure ¯rst suggested by Dow (1994).
13Bryan, Cecchetti, and Wiggins (1997) discuss a statistical rationale for computing trimmed
means. They note that a trimmed mean can be a more e±cient, reduced-variance estimator of the true mean when the underlying distribution of the data has fat tails. In°ation data generally exhibit very high kurtosis relative to the normal distribution, suggesting that trimmed means can provide improvements.
percent. Moreover, the standard deviation in monthly in°ation for the past ¯fteen years is 2.1 percent for the all-item CPI, 1.4 percent for the CPI excluding food and energy, and 1.3 percent for the median (again, all values are at an annual rate). We will simply note that it is possible to improve on this last measure by choosing the trimmed mean that minimizes monthly variation.
An in°ation-targeting regime needs both an appropriate, transparent target and timely information about the trend in that measure. The research cited above suggests that trimmed means provide superior timely measures of trend in°ation. However, the public is unfamiliar with this measure. Thus, adoption of a trimmed mean might not o®er the transparency desirable in an in°ation goal. If so, how can these ¯ndings be incorporated into an in°ation targeting regime? We o®er two possibilities. The ¯rst is to have the measure produced, announced and explained by a statistical agency independent of the central bank. This role for a disinterested party should alleviate most concerns and increase understanding of the rationale for the unfamiliar measure. Alternatively, a central bank could maintain an average CPI target, but rely on the trimmed mean as the best short-run monitoring device for tracking trends. Since the advantage of the trimmed mean lies in its lower sensitivity to noise, while preserving the trend (as captured in long-run averages), this tack is theoretically sound. In either case, transparency and sound monetary policy both dictate the need for an extensive study of the dynamic and long-run relationship between the trimmed mean and average CPI in their country. Then, the central bank must be prepared to explain policy decisions in light of both measures.
Many central banks now compute a number of alternative estimates of core in°a-tion, including medians and trimmed means. ¶Alvarez and de los Llanos Matea (1999) cite numerous examples. We note here several interesting empirical regularities. First, for the dozen or so countries for which we have seen data, the median signi¯cantly re-duces high-frequency noise. Second, we note that for countries other than the United States, the median appears to be systematically below the mean. The reason for
this second ¯nding is that, outside the United States, cross-section distributions of long-run price changes are positively skewed. This could suggest greater downward rigidities in those countries, but fuller explanation of the ¯nding will require further research.
4
INFLATION CONTROL
It is generally agreed that all central banks should strive to reduce in°ation and keep it at low levels. While the measurement of in°ation poses substantial challenges, these seem minor in comparison with the di±culties of controlling in°ation.
In°ation control can be thought of as a fairly technical problem in which the policymaker uses an instrument such as an interest rate to meet an in°ation (or output growth) objective.14 To carry out such a task, the policymakers must have a substantial amount of information. Most importantly the policymaker needs to know what will happen to the objective (in°ation) in the absence of any policy action, as well as what the impact of any particular action on the objective will be. Thus, in°ation control requires forecasts of in°ation and estimates of the response of in°ation to changes in interest rates. Neither of these is straightforward to obtain.
Forecasting in°ation is a daunting task. For example, over the past decade, the standard deviation of forecast errors in professional forecasters' predictions of U.S. in°ation one year ahead has been about 1 full percentage point, implying a 90 per-cent con¯dence band of about 3 perper-centage points. Over this same period, in°ation has averaged only about 3 percent. Nothing seems to forecast in°ation very well, except in°ation's own history.15 Indeed, the relationship between price in°ation and any potential indicator{such as wages, unemployment, or commodity prices{is very unstable. Theory provides us with a reason for the di±culty of forecasting: When
14Cecchetti (1998) discusses this problem in detail, noting that the objective is usually expressed
in terms of a trade-o® between output and in°ation variability.
monetary policy regimes change, the relationship among various quantities in the economy shift as well, rendering prior statistical regularities unreliable.
From here the problem only gets worse. Not only is it di±cult to forecast in°ation, but our ability to predict the e®ect of monetary policy actions on in°ation (and output) is very limited. A number of researchers have estimated the response of prices to interest rate movements in many countries. The ¯rst di±culty is in getting the estimates to display the proper sign. Most of us have a fairly ¯rm belief that increases in interest rates are consistent with monetary contractions and should eventually drive in°ation down. Unfortunately, it is more di±cult than one would think to obtain this empirical result in standard models.16 Then, beyond the di±culty of obtaining the proper sign, lie the issues of precision and statistical signi¯cance. For example, using a simple four-variable model (encompassing output, aggregate prices, commodity prices, and the federal funds rate), one can estimate that a 100 basis point increase in interest rates will drive in°ation down by about one-half of one percentage point after three years. But two standard deviation bands on this estimate go from approximately plus 1 percent to minus 1 3/4 percent.17
Why is it so di±cult to estimate the e®ects of monetary policy actions? The answer is both that the economy responds to di®erent shocks in di®erent ways, and that the economy's response depends on history, so the same shock will prompt di®erent reactions at di®erent times. Textbook discussions treat the transmission mechanism as invariant to the path by which the economy has arrived at its current state. This is surely not true. Consider for a minute the implications of costly price adjustment. A large monetary shock will lead all ¯rms to adjust and thus could result in smaller real e®ects than a small nominal shock that causes incomplete adjustment. The path of such shocks matters as well. Standard tools for estimating the economy's response to monetary policy actions are ill-suited to capturing the nonlinear responses that
16See Sims (1992) for a discussion of the problem that has come to be known as theprice puzzle. 17These estimates are derived from Cecchetti (1996).
theoretical models suggest should be pervasive. As the literature makes clear, linear approximations do not work well. Rigidities obscure both trend in°ation and the impact of policy actions from the policymaker's view.
Policy is made every day, and so despairing over our lack of knowledge and the inadequacies of our models is pointless. Instead, the most productive course is to take seriously the need to make policy in an uncertain and unstable environment. The imprecision of our knowledge must be built into the fundamentals of our policy-making procedures.
5
THE OPTIMAL RATE OF INFLATION
Higher prices or faster in°ation can diminish involuntary, disequilib-rium unemployment....The economy is in perpetual...disequilibdisequilib-rium even when it has settled into a stochastic macro-equilibrium....[When wages are rigid downward] price in°ation...is a neutral method of making arbitrary money wage paths conform to the realities of productivity growth.
James Tobin, `In°ation and Unemployment,' American Economic As-sociation Presidential Address (1972).
[Higher, more variable in°ation causes: a] reduction in the capacity of the price system to guide economic activity; distortions in relative prices because of the introduction of greater friction, as it were, in all markets; and very likely, a higher recorded rate of unemployment.
Milton Friedman, `In°ation and Unemployment,' Nobel Lecture (1977).
Who is right? Widespread reductions in core in°ation and the growing use of explicit or implicit in°ation targets by central banks make this question particularly relevant. Is the most economically e±cient level of price changes zero, as Friedman suggests, or something greater than zero, as Tobin implies? The answer depends both on the structural rigidities in the economy and on the type of shocks the economy
faces. But while the e®ectiveness of monetary policy depends on the nature of nominal rigidities, and the task of the policymaker is to respond to external shocks, not all rigidities and not all shocks are created the same. Di®erences in the types of shocks to which a country is prone and the types of rigidities built into that country's wage-and price-setting institutions will in°uence the optimal low-in°ation goal.
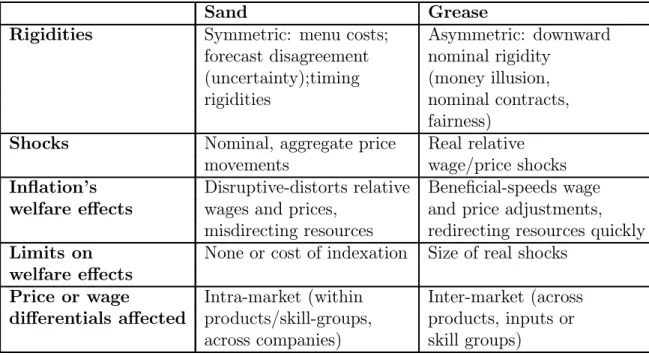
Both the resolution of the controversy between Friedman and Tobin and the im-plications of this controversy for the choice of an optimal in°ation target depend on the extent to which shocks are real or nominal, predominantly big or small; and the degree to which prices and wages are more rigid downward than up, and more or less sticky. A substantial amount of research has been devoted to these issues.18 Tobin's argument has been called thegrease e®ect: a certain amount of in°ation bene¯ts eco-nomic performance in labor and product markets by allowing greater wage and price °exibility in the face of presumed downward rigidities. Maintaining the metaphor of the economy as a geared machine, we use the term \sand" to refer to Friedman's characterization of the a®ects of in°ation: in this view, in°ation interferes with the transmission of price signals, disrupting the smooth operation of the economy. We now turn to a discussion of each of these e®ects, which we summarize in Table 2.
5.1
How In°ation Impairs Economic E±ciency: Sand
The case for an optimal in°ation level of zero (or lower) is based on the belief that the grease e®ects of in°ation are small while the sand e®ects are big. In a world where wage and price rigidities cause asynchronous adjustment to shocks, in°ation results in ine±cient idiosyncratic price or wage adjustments and relative price distortions. This
18The bulk of this work centers on the labor market, as this is presumed to be the source of
some of the most important nominal rigidities in the economy. Researchers tend to focus on wages for a number of reasons. First, labor accounts for two-thirds of production costs. Second, casual observation suggests that nominal wages are stickier than goods prices. Finally, wage data are more readily available than price data, making analysis easier.
Table 2: Comparisons of In°ation's Grease and Sand E®ects in the Labor Market
Sand Grease
Rigidities Symmetric: menu costs; Asymmetric: downward
forecast disagreement nominal rigidity (uncertainty);timing (money illusion,
rigidities nominal contracts,
fairness)
Shocks Nominal, aggregate price Real relative
movements wage/price shocks
In°ation's Disruptive-distorts relative Bene¯cial-speeds wage
welfare e®ects wages and prices, and price adjustments,
misdirecting resources redirecting resources quickly
Limits on None or cost of indexation Size of real shocks
welfare e®ects
Price or wage Intra-market (within Inter-market (across
di®erentials a®ected products/skill-groups, products, inputs or across companies) skill groups)
is the Friedman sand.19 The rigidities involved are symmetrical in that the costs of equal-sized upward or downward movements (in response to a change in the aggregate price level) are the same.
There are several reasons why ¯rms might adjust di®erently to the same nominal shock, causing relative prices to vary. These include forecast disagreement, due to uncertainty;20 menu costs that result in episodic rather than continuous adjustment, (such as negotiating, advertising, and design costs);21 factors that make it di±cult for consumers to comparison-shop (such as hard-to-gauge quality di®erences);22 and contractual obligations such as collective bargaining agreements or leases. Asyn-chronous adjustment means that aggregate price movements are not transmitted in-stantaneously or uniformly, so market participants confuse adjustment lags or errors with real shocks. This misunderstanding has two e®ects. First, and most obviously, pricing errors result in resource misallocations. The second e®ect arises because peo-ple anticipate that resource misallocations will occur. The potential for arbitrary relative price movements creates risk that will lead ¯rms to purchase insurance of various forms. For example, a ¯rm may choose to build a smaller factory in order to guard against the possibility of variable pro¯t streams. There is evidence that higher levels of in°ation are associated with increases in this type of risk.23
We can conclude that asynchronous price and wage adjustment in the presence of in°ation creates two complementary problems. First, it makes it di±cult for poli-cymakers to measure in°ation accurately and expeditiously; second, it misleads eco-nomic agents. In the labor market, unintended wage changes alter ¯rms' wages
rel-19Friedman has also argued that since the marginal producing cost of money is (nearly) zero,
the social welfare maximizing level of real balances sets the nominal interest rate to zero. Optimal in°ation is then minus the equilibrium real rate of interest. In our view, such a target would be extremely dangerous, since it dramatically increases the probability that policy errors force the real interest rate up unintentionally, since nominal interest rates will not be able to fall. For a further discussion on this point, see Cecchetti (1998b).
20See Friedman (1977).
21See Sheshinski and Weiss (1977).
22Stigler and Kindahl (1970) and Reinsdorf (1994). 23See Vining and Elwertowski (1976) and Huizinga (1993).
ative to the market and can produce unnecessary layo®s, workforce dissatisfaction, or resignations. These wage changes can also impose additional costs by compelling ¯rms to improve information or increase the frequency of adjustments.
The conclusion at this point is clear. If all shocks were nominal and rigidities were symmetrical, then the optimal level of in°ation would be zero. In this environment, any positive level of in°ation would disrupt price signals, and the higher the in°ation the worse the disruptions. These costs could be mitigated by indexing or by policies aimed at improving forecasts; but these solutions themselves would redirect resources from more productive uses. De°ation would have identical e®ects, leading us to conclude that price stability would be most e±cient.24
5.2
How In°ation Overcomes Rigidities: Grease
If shocks are predominantly real, creating a desire for ¯rms and workers to adjust relative prices and wages, and nominal wages and prices are more rigid downward than upward, then the conclusion changes dramatically. In this case, prices, and therefore resource allocations, adjust slowly and ine±ciently to shocks, and small amounts of in°ation provide the means for the necessary adjustment by reducing real product prices or workers' real pay without a cut in the corresponding nominal prices or wages. This is the world of Tobin's grease e®ect.
There are a number of potential explanations for the presence of downward nom-inal rigidity. Chief among them is the view that social or bureaucratic norms dis-courage ¯rms from either cutting the wages of good workers who face unfavorable market conditions or lowering the prices of goods with falling demand. This is the view originally expressed by Keynes, who thought that wage stickiness re°ected social notions of fairness. Alternative explanations are based on the existence of long-term,
24Some economists contend that the tax distortions created by in°ation reduce the level of output
permanently, and from this concludes that the optimal level of in°ation is negative. The relationship of in°ation to public ¯nance is beyond the narrow scope of our essay.
nominal contracts (for example, for debt or wages) or money illusion (that is, workers resist cuts in their dollar earnings more than they resist equivalent rises in the prices of what they buy).25
The common view is that nominal prices are less downwardly rigid than nominal wages because products themselves are not in°uenced by social norms, nominal con-tracts or money illusion. However, the producers and distributors that set prices may well be subject to the same in°uences that a®ect ¯rms setting wages since product sales represent income to them, just as wages do to workers. As a result, downward nominal rigidity may extend beyond the labor market and, to at least some degree, be present everywhere.
Clearly, in an environment where cutting nominal prices or wages is di±cult, in°ation can play an important role. Following a real shock, ¯rms may be faced with a need to reduce relative prices or wages. If they are unable to do so, ¯rms will eventually respond by reducing production and employment. In°ation relaxes downward wage and price rigidity because as other prices rise, ¯rms can e®ectively lower real wages or prices without imposing nominal cuts. With this grease in place, wage and price signals travel more rapidly through the economy, reducing layo®s, providing more accurate incentives to workers choosing careers, and raising overall production while reducing its volatility. Thus, in°ation reduces cyclical unemploy-ment. An important corollary discussed in Tobin (1972) and further formalized by Akerlof, Dickens and Perry (1996), extends this reasoning to economies facing con-tinual small \background" disturbances. In that case, in°ation reduces steady-state unemployment.
Returning to the question at hand, we ¯nd again that the conclusion is clear. In an economy with downward wage and price rigidity and real shocks, the output-maximizing (unemployment-minimizing) level of in°ation will be somewhere above zero. It follows directly that the larger and more prevalent the shocks, the more
bene¯cial is in°ation, and the higher the in°ation rate should be to maximize output. By the same token, however, in°ation beyond that needed to accommodate these adjustments adds no further bene¯ts.
Surely, however, the conclusions reached by looking exclusively at either the sand-induced costs or the grease-generated bene¯ts of in°ation are unrealistic. We expect that the two e®ects can and do coexist.26 That is, economies can sustain both real and nominal shocks and have varying degrees of downward nominal rigidities. The optimal in°ation goal depends on the balance between the nature of the shocks and rigidities in the economy. Thus, it is crucial that policymakers be aware of the empirical relevance of each e®ect to their current situation.
5.3
Empirical Research on Rigidities and In°ation
How can we detect the relative size of the grease and sand e®ects in order to help ¯x an in°ation goal? The task seems di±cult because both raise the variance of relative price changes. But, as shown in Table 2, two key di®erences are potentially observable. Increased price-change variability from sand's disruptions should be sym-metrical and should occur even among the prices of otherwise identical goods. Thus, sand can be measured in studies of in°ation's impact on intramarket (same-good) price changes. By contrast, the grease e®ect of in°ation allows an economy to adjust to shocks that alter the relative wages (prices) of di®erent skill groups (products). Hence, the grease e®ect is observed when in°ation raises the dispersion of intermar-ket (that is, between skill-group or product) wage and price changes. In addition, its impact may be asymmetrical, as it facilitates downward movements more than upward ones.
Measures of Sand E®ects
The sand phenomenon has been studied in both the goods and the labor mar-ket. Sand studies gauge in°ation's costs by measuring its tendency to raise intramar-ket prices unevenly.
Recent research on price adjustment variability uses narrow product micro data. Some studies consider price changes in a single class of goods, generally in low-in°ation countries;27 others have explored price changes for a wide variety of goods in high-in°ation environments.28 Examining price changes in the United States during high in°ation years (1980-82), Reinsdorf (1994) ¯nds that the variation in prices within a single product category rose when in°ation fell unexpectedly. The variation of price changes across product categories, however, was positively correlated with in°ation, and so it fell. More support for the sand hypothesis comes from the observed tendency of in°ation to raise forecast price-change dispersion.29 On balance, these studies agree that price change and forecast variability rise with in°ation, as predicted by the sand story.
Research using aggregate data on wages, however, seems to contradict the sand hypothesis. A number of studies ¯nd that the dispersion of wage changes fell as in°ation rose in the late 1970s and early 1980s.30 This seemingly contradictory result is attributed to the in°ation-induced introduction of indexation, which makes wage changes more uniform across industries by tying them more closely to price in°ation. In addition, since the datasets used in these studies leave investigators with a limited ability to control for business cycle variation in worker skill levels and workforce composition, the authors may be confusing intramarket sand e®ects with intermarket grease e®ects.
27See Cecchetti (1986) for magazines' cover prices. 28See Lach and Tsiddon (1992)
29See Ball and Cecchetti (1990).
The work of Groshen and Schweitzer (1996, 1999) reexamines this question using transaction-level data over a long time period. Their data set includes detailed infor-mation on occupation, and so allows for the type of controls that e®ectively replicate the comparability across goods (intramarket variability) sought in the product-price literature. They ¯nd that, over the full observed range of 1 to 14 percent, more in-°ation raises the variation of intramarket wage changes. Moreover, further increases in in°ation appear to increase costs without bound.
Measures of Grease E®ects
The original research investigating the existence of asymmetrical nominal rigidi-ties examined aggregate time-series data. Testing whether aggregate real wages are procyclical (as implied by downward wage rigidity), investigators have concluded that wages (in the United States) are probably rigid downward.31 However, these results have been challenged by theorists who have provided models with identical predictions but fully °exible wages and prices.32
The response to this challenge has been to examine micro-level data and employ tests that are immune to the earlier criticisms. This research program provides more direct evidence in support of the hypothesis that wages are rigid downward. Some studies examine this question using household survey data and ¯nd evidence of sub-stantial nominal wage cuts, which they take to contradict the existence of downward rigidity. But the data are plagued by various measurement errors that may drive the conclusions.33 More important, even if we take the evidence of these studies at face value, the existence of nominal wage cuts is neither necessary nor su±cient to demon-strate that wages are fully °exible, since we do not know how many wage cuts are needed to ensure e±cient allocation of resources. Furthermore, the results obtained
31For a more detailed review of the results referred to in this section, see the survey in Groshen
and Schweitzer (1997).
32The earliest example we know of is Lucas and Rapping (1969).
33Of particular concern is the fact that the data collection methods rely on individuals' memories
from looking at household survey data are contradicted by evidence obtained from interviewing employers and workers on the job. Employers report that their wage-setting policies have important downward rigidities built into them, and workers seem to agree. The studies all provide evidence that wages are downwardly rigid. Nominal wages are not cut unless there is explicit provision for °exible wages (such as through piece-rate or incentive systems) or the ¯rm is under demonstrable ¯nancial distress.
More recent microeconometric studies, based on longitudinal datasets that allow investigators to control more fully for mismeasurement, detect evidence of downward rigidity in spikes at zero and the implied positive skewness of wage changes.34 While spikes at zero or positive skewness of wage changes are neither necessary nor su±-cient signs of downward rigidity, they add to the evidence in support of the grease hypothesis.35
Studies of ¯rm-level micro data take another approach to looking for downward nominal rigidities. Transaction-level data on wages paid by ¯rms re°ect employ-ers' strategies to avoid downward wage rigidity and are not in°uenced by worker misreporting. Using such data, Groshen and Schweitzer (1996, 1999) ¯nd evidence consistent with downward wage rigidity and determine that the e®ect of in°ation on wage changes is exhausted at in°ation levels of about 7 to 9 percent | consistent with the notion that grease bene¯ts are bounded. Using employer data from the Employment Cost Index, Lebow, Saks and Wilson (1999) ¯nd additional evidence of downward wage rigidity.
In sum, while each individual micro or macro test may not be fully convincing on its own, taken together the tests provide diverse and fairly consistent evidence that wages are rigid downward.
34See Akerlof, Dickens and Perry (1996) and Card and Hyslop (1996).
35A spike is not su±cient because rounding in the data makes occurrences of zero-dollar wage
changes common. It is not necessary since truncated workers may be laid o®. As far as skewness is concerned, downward rigidities may also a®ect the upper tail of the distribution if employers limit other workers' salary increases to subsidize constrained workers.
Net E®ects of In°ation
Viewed from the policymaker's perspective, the question is whether in°ation at low rates is on net bene¯cial or detrimental. How low should the monetary authority aim? At zero or something above that? Sand e®ects are clearly disruptive and rise with in°ation, certainly wiping out the net bene¯ts from the grease e®ects when in°ation is high. But how do they compare at low rates? Beyond the impact on the price system's resource allocation mechanism, in°ation can interact with the tax system, reducing the steady-state level of output. Furthermore, downward rigidity at the micro level may not translate into higher unemployment when in°ation is low, implying that the grease e®ects themselves could be small. This would occur if the elasticity of demand for labor with respect to these distortions was low because employers honor implicit insurance-style contracts and absorb °uctuations of costs into pro¯ts. Finally, in°ation may have di®erent e®ects in di®erent environments.
Thus far (the simulations in Akerlof, Dickens, and Perry [1996] to the contrary), scant evidence of sizable macro e®ects exists. Indeed, both Card and Hyslop (1996) and Lebow, Saks and Wilson (1999) ¯nd little net unemployment impact from down-ward wage rigidity under normal conditions. Groshen and Schweitzer (1999) estimate that at the point where bene¯ts are maximized, for CPI in°ation around 2 1/2 percent, the net impact of in°ation (grease minus sand) is positive but an order magnitude smaller than the gross bene¯ts. They go on to estimate that raising in°ation from zero to 4 percent would lower unemployment by less than 1/10 of 1 percentage point. By contrast the net impact of raising in°ation from 4 percent to 8 percent would add as much as 3/10 of 1 percentage point to the unemployment rate. Overall, these results suggest that there is little labor market justi¯cation for raising real in°ation beyond about 1 percent (using an unbiased measure of consumer prices) or raising CPI in°ation beyond 2 percent.
However, variation in general productivity growth rates will a®ect the choice of an optimal in°ation target and the resulting monetary policy. The Groshen and
Schweitzer results are based on the labor productivity growth experience during the sample period under study | that is, the 40 year period from 1957 to 1996. To under-stand why productivity growth matters for in°ation targets, note that productivity growth has e®ects that are similar to those of in°ation | it injects grease and sand into wage setting. Because general productivity growth is even harder to gauge than in°ation, it adds confusion (sand) in wage setting. Moreover, because productivity growth raises average nominal wages, it adds grease to the labor market in the same way as in°ation does.36 Thus, even though productivity growth appears as if it might be unrelated to monetary policy instruments or targets, it a®ects optimal in°ation goals. In particular, as productivity growth strengthens, the amount of grease and sand in the labor market becomes greater, reducing the bene¯t of adding more in°a-tion. Conversely, as productivity growth declines, the amount of grease and sand in the labor market also falls, increasing the net bene¯t of in°ation.
As a ¯nal consideration, policymakers should bear in mind that studies of rigidi-ties and shocks are necessarily speci¯c to a particular economy and time. None of the papers cited provides comparative measures, even though, as we note above, dif-ferences in institutions and exposure to shocks may have important implications for policy. In particular, the studies implicitly treat shocks and rigidities as unchanged during the course of the study. While this assumption is entirely appropriate for the short run, it is certainly not true over the long run. Using short-run numbers to derive long-run estimates could bias results. Indeed, of particular policy interest are endogenous responses, such as the posited tendency for downward wage rigidity to relax in the face of persistent low in°ation, lowering the grease bene¯ts of raising in°ation, and lowering the optimal rate of in°ation. Similarly (but with contrasting implications), if low positive in°ation rates were maintained with little uncertainty,
36From the ¯rm's point of view, productivity growth lowers overall lower unit labor costs. This
increases overall demand for workers, leading to generally higher wages. However, at any time some workers are facing reduced demand for their skills relative to others. The higher is productivity growth, the wider is the scope for employers of those workers to reduce unit labor costs without lowering their nominal wages.
some sand costs of in°ation might dissipate as ¯rms (no longer subject to stop-and-go shocks) were better able to plan for the future and distinguish between real and nom-inal shocks. Thus, if monetary policy has been the primary source of unpredictable nominal shocks, then to the extent that the policy itself can become more stable, a higher target level of in°ation is justi¯ed.
A related caveat is that international di®erences have not yet been studied rig-orously. All cited studies of the grease e®ect rely on US data. Hence, for other economies, the results must be considered suggestive, rather than de¯nitive. By con-trast, sand e®ects have been studied in a wide spectrum of countries, albeit individu-ally rather than comparatively. Ultimately, given their importance for the conduct of sound monetary policy, comparative and longitudinal studies of shocks and rigidities will constitute an important area for further research.
6
POLICY IMPLICATIONS
What do we learn from our analysis? We began by noting that economies face both real and nominal shocks and that prices and wages are rigid in response. These rigidities may be asymmetrical (with decreases in prices and wages being more di±cult to bring about than increases) or not. The implications for monetary policy are manifold.
First, we have described how theoretical models help guide us in developing mea-sures of trend in°ation. These models suggest that trimmed means are more e±cient, timely measures of core in°ation than the more commonly used indexes that system-atically exclude certain components such as food and energy. Second, the research we have surveyed suggests that in°ation is very di±cult to control accurately, especially at short horizons. This explains why, in designing policy schemes, many central banks and governments have reconsidered the wisdom of adopting narrow in°ation-targeting bands. Staying inside the bands may turn out to be an impossible task, damaging
the credibility of the authorities that put the policy in place.
Finally, we address the question of how to select an optimal in°ation target. We note that when prices adjust infrequently, in°ation distorts price signals and leads to resource misallocations. But if wages and prices are rigid downward, some amount of in°ation facilitates adjustment to real shocks. Recent research has produced measures of the relative size of these costs and bene¯ts in an economy that suggest that in°ation targets between zero and 2 percent (bias-adjusted) are optimal.
But there are two important caveats. First, to the extent that labor productivity is increasing on average, there is room to reduce the in°ation target. Second, the optimal rate of in°ation depends on the mixture of shocks and rigidities to which an economy is subject. Furthermore, a long-run steady rate of low in°ation implies fewer nominal shocks and puts pressure on price and wage setters to reduce rigidities. Thus, the optimal rate of in°ation may both di®er somewhat across countries and evolve over time.
References
Akerlof, G. A., Dickens W.T. and Perry, G.L. (1996). \The Macroeconomics of Low In°ation." Brookings Papers on Economic Activity no. 1, pp. 1-74.
Alesina, A., and Summers, L. H. (1993). \Central Bank Independence and Macroe-conomic Performance." Journal of Money, Credit, and Banking, vol. 25, no. 2, pp. 151-62.
Alvarez, L. J., and M. de los Llanos Matea. \Underlying In°ation in Spain." In Mea-sures of Underlying In°ation and Their Role in the Conduct of Monetary Policy, proceedings of the workshop of central bank model builders. Bank for International Settlements, June 1999.
Andr¶es, J. and Hernando I. (1999). \Does In°ation Harm Economic Growth? Evi-dence from the OECD." In M. S. Feldstein, ed., The Costs and Bene¯ts of Price Stability, Chicago: University of Chicago Press for NBER.
Ball, L. and Cecchetti S.G. (1990). \In°ation and Uncertainty at Short and Long Horizons," Brookings Papers on Economic Activity no. 1, pp. 215{245
Bryan, M. F., and Cecchetti S. G. (1994). \Measuring Core In°ation." In N. G. Mankiw, ed., Monetary Policy, Chicago: University of Chicago Press for NBER.
Bryan, M. F., Cecchetti, S. G. and Wiggins, R.L., II, (1997). \E±cient In°ation Estimation." NBER Working Paper no. 6183.
Card, D. and Hyslop D. (1996). \Does In°ation `Grease' the Wheels of the Labor Market?" NBER Working Paper no. 5538.
Cecchetti, S. G. (1986). \The Frequency of Price Adjustment: A Study of the News-stand Prices of Magazines,' Journal of Econometrics, vol. 31, no. 3, pp. 255-74.
, (1995). \In°ation Indicators and In°ation Policy.\ in B. Bernanke and J. Rotemberg, eds. NBER Macroeconomics Annual. Cambridge, Mass.: MIT Press.
, (1996) \Practical Issues in Monetary Policy Targeting," Federal Reserve Bank of Cleveland Economic Review, vol. 32, no. 1, pp. 2-15.
, (1998a). \Policy Rules and Targets: Framing the Central Banker's Problem." Federal Reserve Bank of New YorkEconomic Policy Review vol. 4, no. 2, pp. 1-14.
, (1998b) \Understanding the Great Depression: Lessons for Current Policy," in M. Wheeler, ed.,The Economics of the Great Depression, Kalamazoo, Michigan: W.E. Upjohn Institute for Employment Research, pp. 171-194.
Dow, J. P., Jr. (1994). \Measuring In°ation Using Multiple Price Indexes," Unpub-lished paper, Department of Economics, University of California at Riverside.
Eckstein, O. (1991). Core In°ation. Englewood Cli®s, N.J.: Prentice-Hall, Inc.
Friedman, M. (1977). Nobel Lecture: \In°ation and Unemployment." Journal of Political Economy, 85, no. 3, pp. 451-72.
Groshen, E. L. and Schweitzer M. (1996). \The E®ects of In°ation on Wage Adjust-ments in Firm-Level Data: Grease or Sand?" Federal Reserve Bank of New York Sta® Report no. 9 (revised 1998).
and (1997). \Macro- and Microeconomic Consequences of Wage Rigid-ity." In D. Lewin, D. Mitchell, and M. Zaidi, eds., Handbook of Human Resource Management Greenwich, Conn.: JAI Press.
and (1999). \Identifying In°ation's Grease and Sand E®ects in the Labor Market." In Martin S. Feldstein, ed. The Costs and Bene¯ts of Price Stability, 273-308. Chicago: University of Chicago Press for NBER.
Haley, J. (1996). \Theoretical Foundations for Sticky Wages." Journal of Economic Surveys vol. 4, no. 2, pp. 115-55. (February):
Huizinga, J. (1993). \In°ation Uncertainty, Relative Price Uncertainty, and Invest-ment in U.S. Manufacturing," Journal of Money, Credit, and Banking vol. 25, no. 3, Part 2, pp. 521-49.
Lach, S. and D. Tsiddon (1992). \The Behavior of Prices and In°ation: An Empirical Analysis of Disaggregated Price Data." Journal of Political Economy vol. 100, no. 2, pp. 349-89.
Lebow, D. E., Saks, R. E. and Wilson, B. A., (1999). \Downward Nominal Wage Rigidity: Evidence from the Employment Cost Index." Board of Governors of the Federal Reserve System, Finance and Economics Discussion Paper no. 99-32.
Lucas, R. E., Jr., and Rapping, L. A. (1969). \Real Wages, Employment, and the Price Level." Journal of Political Economy, vol. 77, no. 5, pp. 721-54.
Mishkin, F. S. (1999). \International Experience with Monetary Policy Rules." Jour-nal of Monetary Economics, vol. 43, no. 3, pp. 579-606.
Morand¶e, F. and Schmidt-Hebbel, K. (1999). \The Scope for In°ation Targeting in Emerging Market Economics." Unpublished paper, Central Bank of Chile.
Quah, D. and S. P. Vahey (1995). \Measuring Core In°ation," Economic Journal, vol. 105, no. 432, pp. 1130-44.
Reinsdorf, M. (1994). \New Evidence on the Relation between In°ation and Price Dispersion," American Economic Review, vol. 84, no. 3, pp. 720-31.
Shapiro, M. D., and Wilcox, D. W. (1996). \Bias in the Consumer Price Index." In B. Bernanke and J. Rotemberg, eds. NBER Macroeconomics Annual. Cambridge, Mass.: MIT Press.
Sheshinski, E. and Y. Weiss (1977). \In°ation and Costs of Price Adjustment."
Review of Economic Studies, vol. 44, no. 2 pp. 287-303.
Sims, C. A. (1992). \Interpreting the Macroeconomic Time Series Facts: The E®ects of Monetary Policy," European Economic Review, vol. 36, no. 4, pp. 975-1000.
Stigler, G. J., and J. K. Kindahl (1970). \The Behavior of Industrial Prices." NBER General Series no. 90. New York: Columbia University Press.
Tobin, J. (1972). \In°ation and Unemployment." American Economic Review vol. 62, no. 1, pp. 1-18.
Vining, D. R. and T. C. Elwertowski (1976). \The Relationship Between Relative Prices and the General Price Level." American Economic Review, vol. 66, no. 4, pp. 699-708.
Wynne, M. A. (1999). \Core In°ation: A Review of Some Conceptual Issues." In
Measures of Underlying In°ation and Their Role in the Conduct of Monetary Pol-icy, proceedings of the workshop of central bank model builders. Bank for Inter-national Settlements.