FINANCIAL LIBERALIZATION AND FINANCIAL INSTABILITY IN THE
SELECTED SADC MEMBER COUNTRIES
By
NOLUNGELO MERCY CELE
(201201172)
A dissertation submitted in fulfilment of the requirements for
Masters of Commerce Degree
In
Economics
University of Fort Hare
East London
Supervisor: Dr F.M Kapingura
II ABSTRACT
The study examined the impact of financial liberalization on financial instability in selected SADC member countries namely South Africa, Tanzania, Madagascar and Botswana for the period 1970-2012. The Panel data methodology was adopted to establish the relationship between the two variables. Impaired loans were used to capture financial instability and financial reforms to capture the level of financial liberalization. Credit to the private sector, government expenditure, GDP and inflation were utilised as control variables The empirical findings reveal that financial liberalization leads to financial instability. The financial reforms were found to be positively related with the impaired loans ratio in almost all the specifications. It was also found that financial instability intensifies when the global financial crisis is taken into consideration. This suggests that financial liberalization can therefore be another source of financial instability in the SADC countries. The empirical results imply that policy makers should focus on reforms that give due share to the regulations rather than just simply liberalizing the financial sector.
Key words: Financial liberalization, financial instability, Southern African Development
III
DECLARATION ON COPYRIGHT
I, Nolungelo Mercy Cele, declare that the entire body of work contained in this research assignment is my own with the exception of quotations and references of which the authors are acknowledged. This dissertation has not been submitted or presented to another university for obtaining any qualification.
Signature: ………
IV
DECLARATION ON PLAGIARISM
I, Nolungelo Mercy Cele, student number 201201172, hereby declare that I am fully aware of the University of Fort Hare’s policy on plagiarism and I have taken every precaution to comply with the regulations.
Signature: ...
V
DECLARATION ON RESEARCH ETHICS
I, Nolungelo Mercy Cele, student number 201201172, hereby declare that I am fully aware of the University of Fort Hare’s policy on research ethics and I have taken every precaution to comply with the regulations. I have obtained an ethical clearance certificate from the University of Fort Hare’s Research Ethics Committee and my reference number is the
Following: ...N/A...
VI
AKNOWLEDGEMENTS
I firstly thank the Lord almighty who has given me all the strength I needed to complete this dissertation, without his grace completing this work would be impossible. To my supervisor Dr. F. M Kapingura, I thank you for the remarkable support and guidance shown throughout the writing of this research. Thank you for never giving up on me and encouraging me to always do my best.
To my amazing Parents and my two Siblings I thank you for always being there for me in my highs and lows. Your love, support and prayers drive me. I am forever grateful for having you in my life. To my friends’ thank you for always encouraging me to always study further and understanding when I am away from you. I will forever cherish our friendship.
Finally, I give special thanks to my bursars NRF and Levenstein for the financial support I received in the two years of completing this research. I also thank the University of Fort Hare at large for providing all the facilities needed to complete this research and being a vessel through which young people empower themselves.
VII
DEDICATIONS
I dedicate this research to my loving parents (Zanele & Sikhumbuzo Cele) and my siblings (Nosihle & Sphamandla).
VIII
TABLE OF CONTENTS
ABSTRACT ... ii
DECLARATION ON COPYRIGHT... iii
DECLARATION ON PLAGIARISM ... iv
DECLARATION ON RESEARCH ETHICS ... v
AKNOWLEDGEMENTS ... vi
DEDICATIONS ... vii
LIST OF TABLES... xi
LIST OF FIGURES ... xii
LIST OF ABBREVATIONS AND ACRONYMS ... xiii
CHAPTER ONE ... 1
INTRODUCTION AND BACKGROUND ... 1
1.1 BACKGROUND OF THE STUDY ... 1
1.2 PROBLEM STATEMENT ... 3
1.3 OBJECTIVES OF THE STUDY ... 4
1.4 HYPOTHESIS ... 5
1.5 SIGNIFICANCE OF THE STUDY ... 5
1.6 OUTLINE OF THE STUDY ... 5
CHAPTER TWO ... 7
OVERVIEW OF FINANCIAL LIBERALIZATION IN THE SELECTED SADC COUNTRIES ... 7
2.1 INTRODUCTION ... 7
2.2 GENERAL OVERVIEW OF FINANCIAL LIBERALIZATION IN THE SADC REGION ... 8
2.2.1 Exchange controls ... 11
2.3 AN OVERVIEW OF FINANCIAL SYSTEM IN THE SADC REGION ... 13
2.4 AN OVERVIEW OF FINANCIAL LIBERALIZATION IN SOUTH AFRICA ... 17
2.4.1 South Africa Pre- Financial Liberalisation ... 18
2.5 AN OVERVIEW OF FINANCIAL LIBERALIZATION IN MOZAMBIQUE ... 24
2.5.1 Trade Agreements and reforms ... 24
2.5.2 Openness of the Mozambique Financial sector... 24
2.5.3 The Existing Restrictions ... 25
2.6 AN OVERVIEW OF FINANCIAL LIBERALIZATION IN TANZANIA ... 26
2.6.1 Inception of Financial Liberalisation in Tanzania ... 26
2.6.2 Interest Rates Behaviour Before and After Liberalisation in Tanzania ... 27
IX
2.7.1 The Liberalization process ... 30
2.7.2 Experiences Post- Liberalization in Madagascar ... 32
2.7.3 Experience during Liberalization Process in the Madagascar. ... 33
2.8 CONCLUSION ... 35
CHAPTER THREE ... 36
LITERATURE REVIEW AND THEORETICAL FRAMWORK... 36
3.1 INTRODUCTION ... 36
3.2 THEORETICAL LITERATURE ... 36
3.2.1 McKinnon and Shaw Model ... 36
3.3 EMPIRICAL LITERATURE... 50
3.4 ASSESSMENT OF THE LITERATURE ... 54
CHAPTER FOUR ... 56
RESEARCH METHODOLOGY ... 56
4.1 INTRODUCTION ... 56
4.2 MODEL SPECIFICATION ... 56
4.3 DEFINITION OF VARIABLES AND EXPECTATION APRIORI ... 57
4.3.1 Impaired Loan Ratio (ILR) ... 57
4.3.2 Financial Reforms ... 58
4.3.3 Control Variables ... 59
4.4 DATA SOURCES ... 60
4.5 ESTIMATION TECHNIQUE ... 61
4.5.1 Panel Data Techniques ... 61
4.5.2 Selecting the Correct Technique ... 64
4.5.2.1 The Hausman Test ... 65
4.6 THE RESIDUAL CROSS-SECTION DEPENDENCE TEST ... 65
4.7 CONCLUSION ... 66
CHAPTER FIVE ... 67
EMPIRICAL ANALYSIS AND DISCUSSION... 67
5.1 INTRODUCTION ... 67
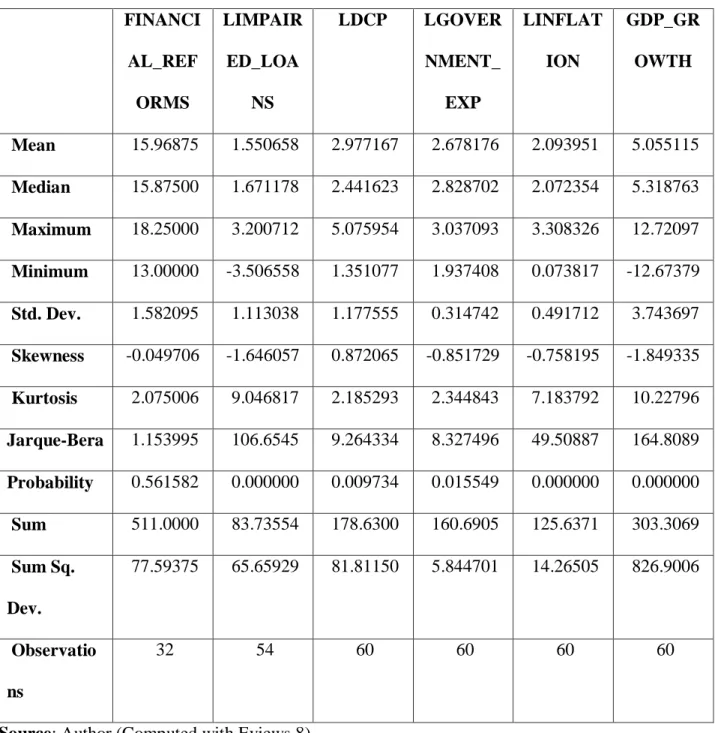
5.2 DESCRIPTIVE STATISTICS ... 67
5.3 CORRELATION MATRIX (RELATIONSHIP BETWEEN ILR AND ALLVARIABLES USED IN THE STUDY. ... 69
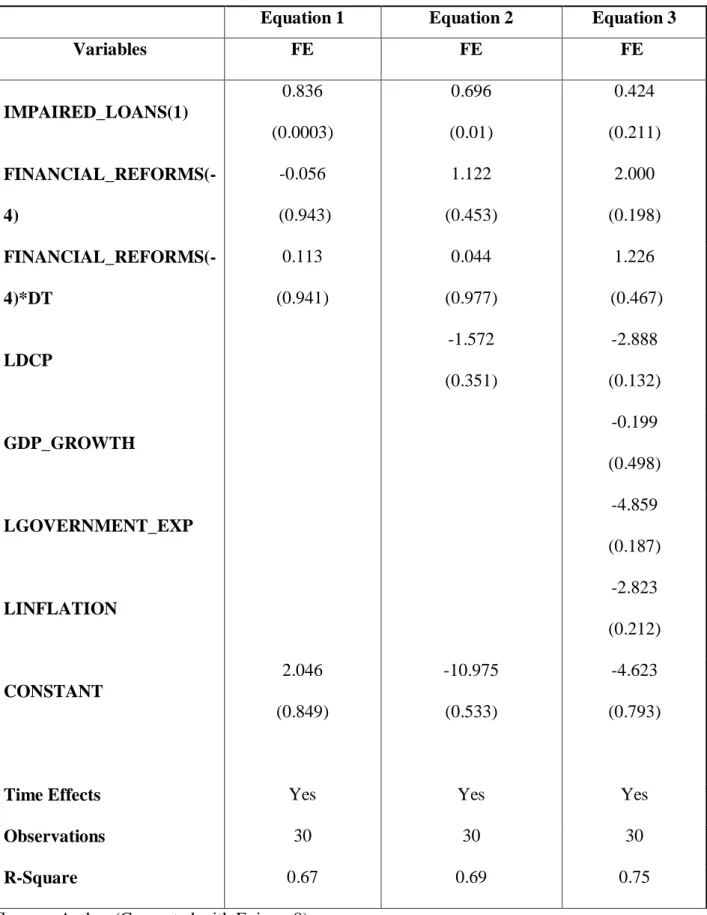
5.5 REGRESSIONS WITH THE IMPACT OF FINANCIAL LIBERALIZATION ON ILR 73 5.6 REGRESSIONS WITH LAGGED DEPENDANT VARIABLE ... 77
5.7 RESIDUAL CROSS-SECTION DEPENDANCE TEST ... 80
X
CHAPTER SIX ... 83
CONCLUSION AND POLICY RECOMMENDATION ... 83
6.1 INTRODUCTION ... 83
6.2 SUMMARY OF CHAPTERS ... 83
6.3 POLICY IMPLICATIONS AND RECOMMENDATIONS ... 85
6.4 LIMITATIONS OF THE STUDY ... 85
6.5 SUGGESTIONS FOR FURTHER STUDY ... 85
REFERENCE LIST ... 87
XI
LIST OF TABLES
Table 2.1: Exchange Control Progresses in the SADC Region…...12
Table 2.2: A summary the financial liberalization evolution in South Africa………...23
Table 5.1: Descriptive Statistic……….…..69
Table 5.2: Correlation Matrix………...71
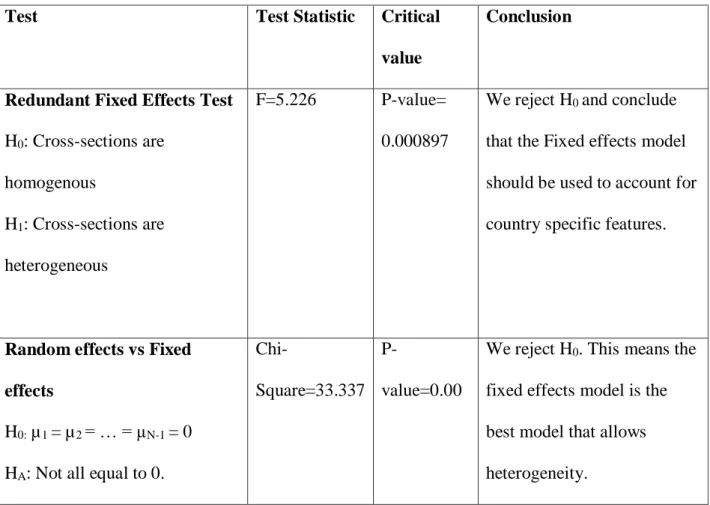
Table 5.3: Hausman test and F-test………...72
Table 5.4: Regressions with the Impact of Financial Liberalization on ILR………..76
Table 5.5: Regression with Lagged Dependant Variable (ILR)………...79
XII
LIST OF FIGURES
Figure 2.1: Interest Rate Spreads…...14
Figure 2.2: Credit to the Private Sector (per cent of GDP) Spreads………15
Figure 2.3: Credit to the Central Government……….16
Figure 2.4: M2 as a percentage of GDP Measuring Financial Deepening………..17
Figure 2.5: Trends of Interest Rates and Inflation Rate in South Africa (1969-1979)………20
Figure 2.6: Interest rate Trends after Financial Liberalization………21
Figure 2.7: Trends of Interest Rates and Inflation Rate in Tanzania (1978-1989)…………..29
Figure 2.8: Trends of Interest Rates and Inflation Rate in Tanzania (1995-2005)…………..30
Figure 3.1: The Effect of Movement from Financial Repression to Financial Liberalization.39 Figure 3.2: Market Equilibrium...46
Figure 3.3: Market Equilibrium and Over-borrowing………...……….48
Figure 3.4: Impact of Financial Liberalization on the Equilibrium……….49
XIII
LIST OF ABBREVATIONS AND ACRONYMS
BIS Bank for International Settlements
BOT Bill of Trade
COMESA Common Market of Eastern and South Africa
EACB East African Currency Board
EPA Economic Partnership Agreements EU European Union
FIP Financial and Investment Protocol
GATS General Agreement on Trade in Services
GDP Growth Domestic Product
ITPAC Industry and Trade Policy Adjustment Credit
PSAC Public Sector Adjustment Credit
SADC Southern African Development Community WTO World Trade Organisation
RISDP Regional Indicative Strategic Development Plan
1
CHAPTER ONE
INTRODUCTION AND BACKGROUND
1.1 BACKGROUND OF THE STUDY
In the past thirty years several developing countries around the world, especially in Africa liberalized their financial systems aiming to increase the scope of its role of mobilising and allocating financial resources (Enowbi and Mlambo, 2012). According to Patnaik (2011) financial liberalization was introduced in developing countries in the 1980’s. Its aim was to give financial markets a greater role in the development of countries and not just rely on the state. Patnaik (2011) further noted that bringing in financial liberalization was also a response to a number of issues relating to finance. These include costs, corruption, and inefficiencies associated with using finance as an instrument of populist; state-led development; a need for more financial resources; citizens’ demands for better finance and lower concealed taxes and subsidies; and the pressures employed on suppressed financial systems by greater international trade, travel, migration, and better communications.
This study aims to examine the impact of financial liberalization on financial instability in selected Southern African Development Community (SADC) region member countries. According to Bezemer, Bumann and Lensink (2015), financial instability refers to businesses’ failure to repay bank loans. Empirical literature accounts both negative and positive impacts of financial liberalization on financial instability. The SADC signifies a regional economic community allied with 15 countries. Southern Africa is targeting to attain development and economic growth by reducing poverty, by using proficiently natural resources and intensifying the quality and standard of people’s lives in the region by inter-dependence of member
2
countries, encouraging and maintaining peace and security through effective protection of the region, and strengthening cultural, historical and social links among them (Manzombi, 2012).
Studies have been documented to support liberalization of the financial system such as the well-known McKinnon (1973) and Shaw (1973). McKinnon (1973) and Shaw (1973) viewed financial liberalization as establishing higher interest rates that balance the demand for, and the supply of savings. Higher interest rates eventually lead to increased savings and financial intermediation as well as the enhancement of the efficiency of using savings. Higher real interest rates would increase the extent of financial intermediation while increased financial intermediation raises the rate of economic growth in developing countries. This is further supported by Magud, Reinhart and Vesperoni (2012).
However, even though financial liberalization succeeded in easing financial repression, Magud, Reinhart and Vesperoni (2012) highlight that its impact on growth and investment has not been convincing. At the same time, there are studies by Demirguc- Kunt and Levine (2008) and Enowbi and Mlambo (2012) which highlight that financial sector liberalization may actually create financial sector instability and crisis. Financial crisis could manifest itself in the form of bank failures, intense asset price volatility or a collapse in market liquidity. This has the potential of disrupting the payment and settlement process with dire effects as it can be transmitted to the real sector through its linkages with the financial sector. This is also supported by Kaminsky and Schmukler (2003) and Lorenzo (2008).
The study examines selected SADC countries as poverty remains one of the greatest challenges in the region. As one of the ways to eradicate the high levels of poverty, the countries in the region have considered one of their main objectives to be achieving sustainable economic
3
growth and development. The studies of Magud, Reinhart and Vesperoni (2012) support that this can be achieved through capital account liberalization which will attract more investment as well as mobilise savings which ultimately promote investment. It is therefore important to determine to what extent financial liberalization causes financial instability.
1.2 PROBLEM STATEMENT
In the SADC countries just like any of the African countries, financial liberalization was implemented through allowing market-determined interest rates. This was expected to bring with it a number of benefits to a country (Ikhide, 2015). These would include higher real deposit rates, thus stimulating savings. This would result in an efficient allocation of loanable funds. The other benefit expected from liberalization was the elimination of distortions which arise from a variety of administrative controls. Patnaik (2011) show that high interest rates were expected to promote financial deepening, help in the expansion of domestic capital formation and hence stimulate economic growth.
Though much was expected from financial liberalization, Ikhide and Alawode (2002) documents a number of problems to which many of the African countries which adopted liberalization at the time. These challenges include sharp increases in interest rates, bankruptcies of financial institutions and high levels of inflation. Liberalization also resulted in increased capital inflows which allowed rapid growth in credit to public and private institutions which were regarded as weak at the time. Demirgüç-Kunt and Levine (2008) also highlights that the quality of lending in general deteriorated in many of the countries which implemented liberalization.
4
The impact of financial liberalization on financial fragility has been brought to the fore following the 2008 Global financial crisis which emanated from the US. The recent studies which have examined the extent to which liberalization can result in financial fragility include Dell’Arricia and Marquez (2006), Lorenzoni (2008), Magud, et al. (2012), Calderón and Kubota (2012), Bezemer, et al. (2015). These show that during of the global financial crisis, financial liberalization intensified competition which then resulted in a decline in the franchise value of banks and the only way banks responded to this was by accepting more risk exposure so as to maintain their profits. This in turn, had dire consequences for the entire financial system and hence the whole economy.
This becomes important in the case of the SADC countries given that the SADC 2012 report on financial sector points out that through the development of the protocol on trade, the region is implementing plans which are aimed at increasing economic liberalization within Southern Africa. The protocol is in line with the SADC vision of a regional integration which is supported by member states as it is viewed as another way through which the region may have a strong economy as well as increasing international investment. Although much has been put forward to support financial sector liberalization, it becomes important to also examine if it can be another source of financial sector instability in the region given the mixed results in the academic discourse.
1.3 OBJECTIVES OF THE STUDY
The main objective of the study was to examine the effect of financial liberalization on the financial instability. The specific objectives were:
1.3.1 To provide an overview of liberalization policies instituted by selected countries in the SADC region.
5
1.3.2 Empirically assess the extent to which liberalization of the financial system impact on financial instability.
1.3.3 Based on empirical results, articulate policy implications of the study.
1.4 HYPOTHESIS
1.4.1 Liberalization of the financial system does have an impact on financial instability of a country.
1.4.2 Liberalization of the financial system does not have an impact on financial instability of a country.
1.5 SIGNIFICANCE OF THE STUDY
In the case of SADC, it is interesting to note that the available studies by Loayza and Ranciera (2002), Guillaumont and Kpodar (2004), Sibanda (2012) and Khumalo and Kapingura, (2013) analysed the impact of financial liberalization and have largely concentrated on economic. . On the other hand the study of Murinde (2010) focused on analysing its impact on trade in the region. There are a few studies which have focused on analysing how liberalization can be another source of financial instability. As a result, the study makes a contribution in the literature by examining the relationship between financial liberalization and financial instability in the region given its goals of pursuing the goal of financial liberalization aiming to increase the level of investment and achieve higher levels of economic growth.
1.6 OUTLINE OF THE STUDY
The study was organised as follows: Introduction and background to the study in Chapter one; Chapter two which looked at the trends in financial liberalization in the SADC countries. Chapter three focused on the literature review of the study which embodied the theoretical
6
portion and empirical evidence of the study. The research methodology, which is inclusive of the research design, data sources, model formulation, and estimation techniques, was dealt with in Chapter four. Chapter five presents the findings of the study while Chapter six provides a summary of the main findings of the study, conclusion and policy implications of the study.
7
CHAPTER TWO
OVERVIEW OF FINANCIAL LIBERALIZATION IN THE SELECTED SADC
COUNTRIES
2.1 INTRODUCTION
The financial sector has a critical role in modern market economies as it provides basic payment and transaction services, intermediating society’s savings to its best uses, offering households, enterprises and governments risk management tools. However of late it has been seen as another source of fragility as was witnessed during the 2007 Global Financial Crisis and the Eurozone crisis (Rancière, Tornell and Westermann, 2006).
Since the predominant acceptance of the idea of financial liberalisation, many countries have made attempts to liberalise their financial sectors by deregulating interest rates, eliminating or reducing credit controls, allowing free entry into the banking sector, giving autonomy to commercial banks, permitting private ownership of banks, and liberalising international capital flows (Rancière, et al. 2006). However, of these six dimensions of financial liberalisation, interest rate liberalisation has received the main focus of attention. Unfortunately, the countries that embarked on interest rate liberalisation have had mixed experiences. Whether financial liberalisation is a cause of financial instability still remains a question for empirical investigation.
In aiming to achieve the main objective of the study this chapter will discuss the overview of financial liberalisation for the selected SADC countries namely South Africa, Madagascar, Mozambique and Tanzania. The chapter is divided into six subsections: Following the introduction, Section 2.2 presents a general overview of the financial liberalization in the
8
SADC region Section 2.3 presents an overview of the financial system of the SADC region 2.4 provides an overview of financial liberalization in South Africa, 2.5 provides an overview of financial liberalization in Mozambique, 2.6 provides an overview of financial liberalisation Tanzania, 2.7 provides an overview of financial liberalisation in Madagascar and 2.8 provides a conclusion to the chapter.
2.2 GENERAL OVERVIEW OF FINANCIAL LIBERALIZATION IN THE SADC
REGION
The main objective of implementing liberalisation of trade in financial services was that open markets function in a more efficient way, deliver improved pricing and provide improved access (Manzombi, 2012). It is possible that foreign banks may be more efficient than domestic banks as they have access to a larger, more diverse group of capital (Ikhide, 2015). Foreign banks can as well benefit from economies of scale. This is mainly relevant when operating in small economies, with inadequate sources of capital, such as the economies of a number of SADC countries.
When measuring the level of trade liberalisation in the financial services sector in SADC, the starting point is the General Agreement on Trade in Services (GATS). All the SADC countries are members of the World Trade Organisation (WTO) and their commitments under the GATS shows whether or not a country is willing to open up or negotiate in a specific services sector (UNCTAD, 2010).
Most of the SADC countries adopted banking sector reforms in the 1990s as part of the economic structural adjustment programmes that were encouraged by the International Monetary Fund together with the World Bank. These reforms involved the re-construction of
9
the balance sheets of banks to reduce bad debts, the privatisation of state-owned banks, as well as allowing foreign participants into the domestic banking market. Most of the reforms were not devoted under the GATS, for instance Botswana, has not made any commitments in the financial sector under GATS whereas it has eliminated all forms of exchange control. According to UNCTAD, (2010), the failure to commit to reforms under GATS reflects the SADC countries’ exhaustion towards GATS negotiations and their fear of making binding commitments with no knowledge as to whether or not the reforms will actually work.
Mpofu (2013) highlight that in 2004, the financial sectors of Mauritius, Seychelles and South Africa developed significantly, with 50% of their Gross Domestic Products (GDP) being invested in highly accessible, short-term securities and deposits. The author does also point out that Tanzania has also fared well. Prior to liberalisation, no foreign banks operated in the country; five such institutions were operating by 1998 (Mpofu, 2013). However, the countries have witnessed an enormous change in the financial sector. In 2006, SADC established the Protocol on Finance and Investment, which sets out policies for financial development in the region. It recommends member states to cooperate on a number of aspects of financial systems as the region builds toward a market-driven system. These aspects include integrated regional economy: banking supervision; Payment systems; Exchange control policies; and Stock exchanges (UNCTAD, 2010).
SADC member countries are also involved in a number of regional agreements that are likely to impact on the banking sector. Despite slow progress in ratifying the SADC Protocol on Trade in Services, negotiations are expected to begin in 2012 and the financial sector has been identified as one of 6 priority sectors for early negotiation. In addition, the SADC Finance and
10
Investment Protocol (FIP), which came into force in 2010, commits SADC members to cooperate across a broad range of financial matters (UNCTAD, 2010).
In 2010, negotiations on services trade liberalization took place under the support of the Economic Partnership Agreements (EPA) with the EU. Since some SADC member states were also members of other regional groups, such as the Common Market for Eastern and South Africa (COMESA), they were spread over different negotiating formations. In all of the agreements, the banking sector was likely to be a key offensive interest of the EU (UNCTAD, 2010).
SADC has also established a fifteen year Regional Indicative Strategic Development Plan (RISDP), which outlines priorities for the region in all major sectors. This plan shows that, as SADC includes more members into its customs union, it will be crucial to deepen monetary and trade cooperation’s throughout the region. According to Lorenzoni (2008) this level of mutual aid and trade occurs most effectively in a financial climate without restrictions on investment and lending. Alternatively, the Regional Indicative Strategic Development Plan supports local entrepreneurs in developing businesses and a climate that attracts foreign capital.
Mpofu (2013) indicated that these liberalized policies have generated a positive effect on economic growth in the SADC region. Interest rates have risen following liberalization, which has encouraged saving. Most recently, Malawi, Angola and Madagascar have all made improvements to their credit systems, which should free access to credit for local investors in the future.
11
Nonetheless, increased financial liberalization has not addressed all of the region’s economic problems. Inflation continues to stride with the interest rates in most member states, and changes in economic development among nations have widened. Additionally, many member states are not deeply integrated into the global economy and observe even less international trade and investment during the initial stages of reform. However, many contributing factors other than financial policy, lack of infrastructure, labour issues, and regional conflicts have all impacted the economic development of the SADC region (Lorenzoni, 2008). According to Ikhide (2015), as improved industrial productivity and foreign trade strengthen member countries, links to the global economy, the liberalized financial policies of SADC are expected to attract even further investment into the SADC region and build upon gains already made towards regional and national economic growth.
2.2.1 Exchange controls
Exchange control involves the state dictating the value of its currency traded or exchanged with foreign currency. Exchange controls are embodied by current and capital accounts. Liberalizing exchange controls was meant to eradicate the governmental burden related to managing exchange controls, whereas the liberalization of the capital account was aimed at growing capital flows (Ikhide, 2015).
All SADC member countries have made remarkable progress in liberalization of exchange control on current accounts. Towards the end of 2010, major current account liberalization occurred in Mozambique and there was also substantial reduction in controls and floating of the Kwacha occurred in Malawi. Zimbabwe and Mozambique made substantial initiative and Malawi floated its currency in May 2012. There have also been developments in the liberalization of the capital account; however, service restriction is still very high in member
12
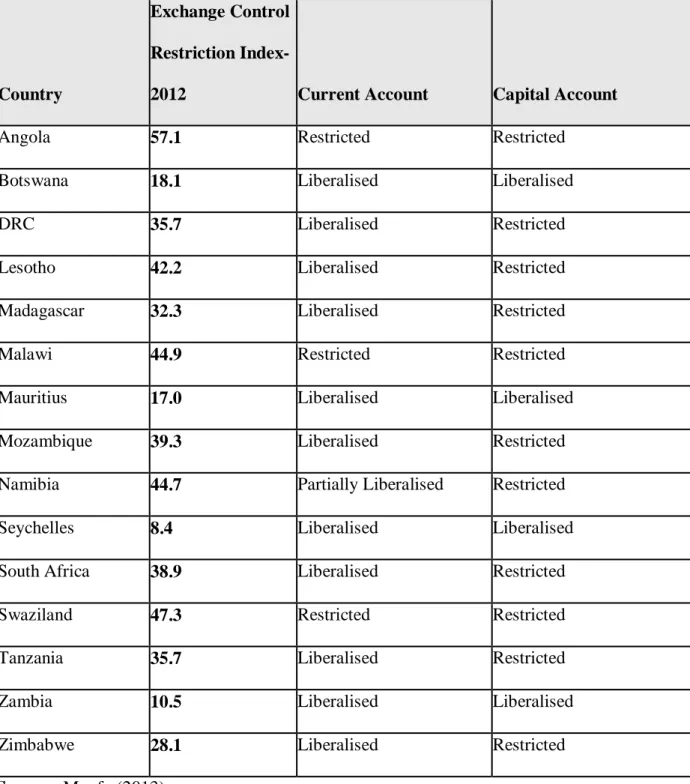
countries such as Angola and Malawi that are not fully liberalized (Mpofu, 2013). Table 1 depicts exchange controls development in the SADC region showing the index for each member state. It can be viewed that the restriction index is high in non-fully liberalized member states, for instance Angola as compared to Botswana which is liberalized.
Table 2.1: Exchange Control Developments in the SADC region in 2012.
Country
Exchange Control
Restriction
Index-2012 Current Account Capital Account
Angola 57.1 Restricted Restricted
Botswana 18.1 Liberalised Liberalised
DRC 35.7 Liberalised Restricted
Lesotho 42.2 Liberalised Restricted
Madagascar 32.3 Liberalised Restricted
Malawi 44.9 Restricted Restricted
Mauritius 17.0 Liberalised Liberalised
Mozambique 39.3 Liberalised Restricted
Namibia 44.7 Partially Liberalised Restricted
Seychelles 8.4 Liberalised Liberalised
South Africa 38.9 Liberalised Restricted
Swaziland 47.3 Restricted Restricted
Tanzania 35.7 Liberalised Restricted
Zambia 10.5 Liberalised Liberalised
Zimbabwe 28.1 Liberalised Restricted
13
2.3 AN OVERVIEW OF FINANCIAL SYSTEM IN THE SADC REGION
Though financial liberalization has been implemented in the SADC countries as discussed in the preceding section, Manzombi (2012) highlighted that when compared to other relative regions, member countries of the SADC prove to have slow growth when it comes to financial sector development. It is worth mentioning that member countries of the SADC region vary in terms of the banking and economic structures. To show this heterogeneity, this section discussed the performance in some relevant indicators for the SADC economies.
According to Cihak, Demirgüç-Kunt, Feyen and Levine (2012), the reason for a very slow financial sector development in SADC countries is the high cost of activities carried out by banks in the member countries. This then leads to high levels of interest rate spreads. The graph in Figure 2.1 illustrates these high interest rate spreads which almost reach 50%. It is interesting to note that from 2006 to 2009 the Asian and global financial crisis were higher than the years 2010 to 2013. In 2013 it is only Malawi and Madagascar that showed high interest rate spreads.
14
Figure 2.1: Interest Rate Spreads
Source: Banco Nacianal de Angola, (2013)
It is important to look at credit to the private sector/GDP ratio as a macroeconomic indicator when looking at financial sector development. This indicator the serves as the best tool when forecasting a banking crisis. However, the indicator’s significance for the economies is subject to regulatory framework and development stage for each banking system. In Figure 2.2, the change in credit/GDP indicates that it is better to accrue capital during a period where a systematic risk is anticipated. For the duration of the pre-crisis period of 2006-2009. South Africa and Mauritius show very high average of credit/GDP ratio.
According to Cihak, et al. (2012) during the pre-crisis period South Africa exceeded the upper threshold recommended by the Bank for International Settlements (BIS). BIS document studies that contributes to analytical frameworks, amongst these studies in 2010 BIS suggest the
15
requirement of capital in the form of shock absorbers, which should be placed in a buffer of 0 to 2, 5 per cent above the minimum set by the regulation. The average for the SADC region is significantly low.
Figure 2.2: Credit to the Private Sector (per cent of GDP) Spreads.
Source: Banco Nacianal de Angola (2013)
After looking at credit to private sector, Figure 3 below shows the performance of credit to central government. The averages of credit to private sector and central government are different. In most countries, the spreads are touching zero and some are negative. Botswana has shown average values of -36.9 per cent of the credit to private sector as a percentage of GDP for 2006 to2009 and -19, and 5 per cent 2010 to 2013. These results led to the SADC region collectively displaying a fair position, which is in line with the average values of – 0.3 per cent of GDP for 2006 to 2009 and 1.4 per cent of GDP for 2010 to 2013. Cihak, et al. (2012) concluded that a negative net credit to central government suggests that deposits by government in the banking system are greater than the lending by banks to government.
16
Figure 2.3: Credit to the Central Government.
Source: Banco Nacianal de Angola (2013)
Lastly another indicator is financial deepening and it is measured by M2 as a percentage of GDP. It is best to measure financial deepening by using the percentage of GDP as M2 growth is likely to decline after a banking crisis. The performance of M2 is illustrated in Figure 2.4. For this indicator, South Africa and Mauritius have performed amazingly well throughout the reviewed periods having an average of 91 per cent and 80 per cent, respectively in the pre-crisis period. The average for the SADC region jointly is almost reaching 50 per cent. Banco Nacianal de Angola (2013) submits that implementing reforms associated with these averages implied a steady increase in the deepening measures financial systems.
17
Figure 2.4: M2 as a percentage of GDP Measuring Financial Deepening.
Source: Banco Nacianal de Angola (2013)
The above figure shows that the SADC member countries have varied performances, reflective of the distinctive characteristics relating to the nature and stage of development of each country. The following sections will look at the overview of financial liberalization of selected SADC countries individually.
2.4 AN OVERVIEW OF FINANCIAL LIBERALIZATION IN SOUTH AFRICA
Financial liberalization in South Africa was started just after the De Kock Commission Reports which were between the years 1978 and 1985. Interest and credit controls were removed in 1980, whereas liquidity ratios of banks were reduced extensively between 1983 and 1985. Credit ceilings were initiated in the 1960s and 1970s. The South African Reserve Bank imposed an upper limit on the aggregate of loans so that banks were allowed to extend in 1967. In 1968 credit ceilings were furthermore stretched to cover bank investment in the private sector securities (Sibanda, 2012).
18
In trying to control competition, credit ceilings were even spread to non-monetary banks in 1970. Even though credit ceilings became unrestricted in 1972, the bank credit ceilings to the private sector were reemployed in 1976. Credit ceilings were further made stringent between 1977 and 1979, however the credit ceilings were ended in 1980. According to Williamson and Mohar (1998), the Register of Cooperation, which limited bank competition was also removed in 1983. In the 1970s and 1980s the predominant political environment caused an ongoing imposition of sanctions on South Africa which led the country to being deprived of access to the international financial markets. Hence, South Africa was characterised by interest and exchange rate controls, credit ceilings and directed credit allocation, cash and liquid requirements. Nonetheless, South Africa started the reform process, particularly after 1994, to enforce freedom in the financial sector.
2.4.1 South Africa Pre- Financial Liberalisation
Prior to liberalization which was between 1960 and 1980 South Africa was characterized by strong dependence on administrative controls such as ceilings on extending deposit rate and bank credit to curb growth in liquidity and aggregate spending (Gidlow, 1995). Also from the beginning of 1961 South Africa was characterised by extreme exchange controls which were meant to provide some protection to the national economy from the negative effects of capital flights (Gidlow, 1995). The capital account limitations limited cross-border flows of capital and lessened foreign competition and removed access to foreign instruments. Indirect credit controls in the form of credit ceilings were enforced through moral suasion. Credit ceilings were imposed in the 1960s and 1970. The South African Reserve Bank imposed an upper limit on the aggregate of loans so that banks were allowed to extend in 1967 (Odhiambo, 2011).
19
In 1965 the authorities instituted another restriction with regards to assets that can be instantly converted into cash or else be utilized as cash. This restriction is also known as the liquid asset requirement. This was followed by the deposit rate control in 1965 and the high bank reserve requirements in 1965 to 1966. The deposit rate controls were imposed to make sure that home mortgage rates were not increased parallel to interest rates increases and also reduce competition between banks and building societies (Sibanda, 2012).
Interest rates in South Africa were greatly controlled before liberalization. The South African Reserve Bank was in authority of outlining maximum and minimum deposit and lending rates. In the years 1967 and 1975, the minimum deposit rate and prime overdraft lending rates were fixed at 2% and 2.5%, accordingly, above the bank rate. As of 1975, banks were allowed to set their lowest overdraft rates within the margins of 2.5 - 3.5% above the bank rate. This continued until 1980 when interest rate controls were dropped. The deposit rate, on the other hand, had its first upper limits imposed in 1965. Although this restriction was dropped in 1970, it was re-introduced in 1972. It was maintained until 1980, when the deposit rates were fully liberalised. Figure 2.5 illustrates the trends of interest rates, and the inflation rate, in South Africa during the period 1960-1979 (Odhiambo, 2011).
20
Figure 2.5: Trends of Interest Rates and Inflation Rate in South Africa (1969-1979).
Source: Odhiambo (2011)
2.4.2 South Africa Post-Financial Liberalization
In South Africa the efforts of financial sector liberalization were started in 1980. South Africa liberalised both its lending and deposit rates in 1980. The foundation for this quick interest rate liberalisation was to allow banks greater flexibility and to encourage competition. After the liberalisation of interest rates, banks were able to vary rates charged to borrowers according to their cost of funds and according to creditworthiness of different borrowers. Even though the monetary authorities expected interest rates to be positive in real terms after their deregulation, interest rates generally remained negative in real terms. It was not until the 1990s that a distinct positive interest rate was attained. After 1990, the rates remained fairly and consistently positive over and above inflation, except in 1992, when rates fell drastically (Odhiambo, 2011). High interest rates became necessary in order to attain the twin objectives of curbing inflation and maintaining a current account surplus.
21
Following the liberalisation of interest rates in 1980, nominal interest rates increased significantly, although real interest rates remained negative until the mid-1980s. The nominal deposit rate, for example, increased immediately after the adoption of financial liberalisation from 5.54% in 1980 to 18.29% in 1984 before declining during 1984 to 1987. During 1988 to 1990, the nominal deposit rate increased again, however, this high deposit rate did not last for long. During 1991 to 1994 the interest rates showed another declining trend. The figure below figure 2.6 expresses although the real prime and repo interest rates increased during 1995 to 1998, they later declined in 2000. By 2001, the real prime and repo rate displayed a number of decreasing of values. In 2004 an increase Interest rate increased, but another declining trend is seen till 2012. In 2008 which is the year of the financial crisis the repo rate went to a negative.
Figure 2.6: Interest rate Trends after Financial Liberalization.
22
The reserve and liquidity requirements were reduced in 1980 and were further reduced more throughout the 1980s. This shaped South Africa’s financial system to a fairly competitive setting for the financial institutions that were subject to these requirements i.e commercial banks and those that were not subject to these requirementr. In the 1990s, the minimum reserve requirements to be held by banks in South Africa were altered from a fixed proportion of the value of short-term liabilities to a fixed proportion of the value of total liabilities (Nel, 2000). In 1998, the Reserve Bank then introduced a mutual reserve ratio of 2.5% on the total liabilities of banks, excluding issued capital and reserves.
Bank credit is an important source of finance to the private sector in South Africa. The credit controls removed in 1980. Ever since the credit controls were removed there has been a substantial growth in the private credit . Over the past 30 years bank lending to the private sector increased at a relatively high average annual rate of 17.9%. It has been on the steady increase from 56% of GDP in 1980 to 162% of GDP in 2007 (Sibanda, 2012). There was however a drop from 2008 which waspartially resulted by the 2008 global financial crisis. A number of foreign firms have entered the banking, insurance and broking markets since South Africa rejoined the world community in 1994.Between 1995 and 2000, there was improved bank market entry with foreign banks being permitted to open branches in South Africa in 1995.
23
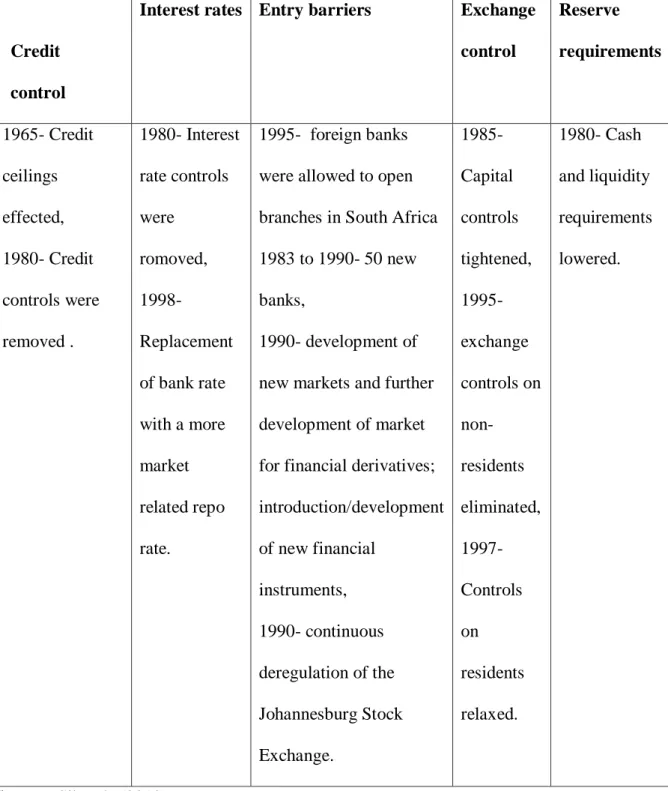
Table 2.2: A summary the financial liberalization evolution in South Africa.
Credit
control
Interest rates Entry barriers Exchange
control Reserve requirements 1965- Credit ceilings effected, 1980- Credit controls were removed . 1980- Interest rate controls were romoved, 1998- Replacement of bank rate with a more market related repo rate. 1995- foreign banks were allowed to open branches in South Africa 1983 to 1990- 50 new banks,
1990- development of new markets and further development of market for financial derivatives; introduction/development of new financial instruments, 1990- continuous deregulation of the Johannesburg Stock Exchange. 1985- Capital controls tightened, 1995- exchange controls on non-residents eliminated, 1997- Controls on residents relaxed. 1980- Cash and liquidity requirements lowered. Source: Sibanda (2012)
To-date South Africa has a one of the strongest and most attractive financial system. The country has gone through structural reform in aiming increase the country’s economic growth
24
(Ikhide, 2015). It is evidence that before the liberalisation, South Africa was a distinctively financially repressed country having interest rate controls, direct controls, exchange controls and other forms of financial repression. A number of these controls have been brought forward as the country goes further towards full financial liberalisation.
2.5 AN OVERVIEW OF FINANCIAL LIBERALIZATION IN MOZAMBIQUE
2.5.1 Trade Agreements and reforms
Mozambique having become a member of General Agreement on Trade in Services (GATS) witnessed a change in its banking sector as it became fully committed to Modes 1 and 2 of the four modes of services Trade under GATS. Under these Modes there are no restrictions with regards to accessing the local market and national treatment. Mode 3 has regular limitations that allow international banks and financial institutions to operate in a country as long as the country follows the laws that dictate the local business etiquette. As for Mode 4 foreign financial professionals are required to have a work permit to practise within the country. Thus, the local financial sector in Mozambique is open to foreign financial institutions if the representatives hold valid work permits and the institutions follow the local laws and regulations (Moza Banco SA, 2012).
2.5.2 Openness of the Mozambique Financial sector
Mozambican law has a few limitations and restrictions which has resulted in heavy investments of foreign institutions in the country. This is indicated by the 85% dominance of financial assets that these foreign financial institutions control (Moza Banco SA, 2012). The presence of smaller local financial institutions that also thrive in this favourable environment provide for more options with regards to banking and investing.
25 2.5.3 The Existing Restrictions
Mozambique has a relatively free policy with regards to exchange and trade of foreign currencies across its borders. However, if the amounts are to surpass the figure set out by the central bank it requires that the transaction are reported. There are a handful of foreign banks which control a huge bulk i.e. 4/5th of the banking assets. The foreign banks are not forced to merge with local financial institutions (IMF, 2009).
The movement of natural persons, the Law on Immigration (Law No. 5/93 of 28 December 1993) allows for foreign nationals applying their trade in the country similar rights as locals. They are also held accountable by law if they are found guilty of doing any illegal activities. The foreign professionals must however be in possession of a valid work visa. However, for you to get the permit you must prove that you will be able to sustain yourself and not involve in any criminal activities. Thus, there are no restrictions with regards to national treatment commitment (IMF, 2009).
The central bank of Mozambique oversees the authorisation of foreign financial institutions seeking to run in the country. Foreign banks are also subject to constant monitoring and supervision with regards to their practises affecting the local financial sector. The law sets out capital adequacy rules that the foreign institutions should follow which are based on: common internal controls; minimum levels of provisions; limitations with regards to connected lending; big exposures and concentration constraints; restrictions on foreign exchange exposures; base reserve requirements; and restrictions on fixed assets among others (Moza Banco SA, 2012).
The import and export of foreign currency is relatively easy in Mozambique. The Mozambique central banks will only step in and help foreign financial institutions that lack finances to
26
sustain themselves. Foreign Financial institutions are allowed to utilise the SWIFT and Telex systems (IMF, 2009). However, making sure that there is existence of world-wide access to financial services remains a policy obstacle that is shared across all countries of the SADC region.
2.6 AN OVERVIEW OF FINANCIAL LIBERALIZATION IN TANZANIA
2.6.1 Inception of Financial Liberalisation in Tanzania
The idea of financial liberalisation has been considered in Tanzania since the 1980's. Interest and commitment was first shown when the government sort to restructure its financial norms to open its market to foreign institutions. This was however only implemented in 1990’s because of fear of aggressive foreign investments and buy outs 'big bang' situation to (Odhimbo, 2011).
The country saw it fit to first get to a relatively comfortable level of financial stability and national productivity before opening foreign financial institutions. The liberalisation process involved the Bank of Tanzania in 1992 losing its responsibility to dictate interest rates but would only retain responsibility of maximum lending rates; passing of the Foreign Exchange Act of 1992 which superseded Exchange Control Ordinance; Doing away with the interest rate ceiling of 31% and in its place the 91-day Treasury Bill Auction in 1993 begun (Odhimbo, 2011).
In April 1993 establishments known as bureau-de-change markets that would allow the bank of Tanzania to change or trade with foreign currency was introduced. This was an opportunity for Bill of Trade (BOT) to monitor its liquidity risk exposure and dictate its exchange rates.
27
August 1993 saw the exchange rates standardized and commercial banks given the opportunity to take put in foreign auctions. The years 1994, 1995 and 1996 saw the doctrine of sustaining a positive real deposit rate formally put to an end, the liquidity asset ratio stopped and the liquidity asset ratio abolished respectively (IMF, 2009).
According to Odhimbo, (2011) financial liberalisation had a lot of negative results in the Tanzanian economy. This resulted in a steady reduction in domestic lending to the private sector, unpredictable financial depth, big differences between lending and deposit rates, high cost of borrowing and volatile exchange rates. Pre-financial reforms saw a higher rate of savings and investments compared to the post-financial reforms period. There was a general decrease of loans given to the private sector recorded as 28.62% in 1991 to 6.98% in 1998.
2.6.2 Interest Rates Behaviour Before and After Liberalisation in Tanzania
Pre-financial liberalisation Tanzanian interest rates were monitored by the East African Currency Board (EACB). The Board only oversaw the interest rates on government securities and did not involve itself with local commercial bank interest rates. There was emphasis on keeping the Treasury bill below that of the UK. Independently the dominant banks in Tanzania mirrored UK interest rates with no significant resultant change with regards to deposit rates in the country. The deposit rates reacted as follows: it decreased from 3.5% per annum in 1961 to 3% per annum in 1962 and remained unchanged until 1964. The interest rate later increased to 3.5% in 1965 and maintained that until 1966 (Williamson and Mohar, 1998).
Following the increase in interest rates, it was noted small insignificant fluctuation in the deposit rates was largely caused by the tight grip the local commercial banks had on the local interest rates. The policies that allowed commercial banks to dictated local interest rates were
28
changed after the Arusha Declaration of April 1967 with introduction of government dictated fixed interest rates in Tanzania (Williamson and Mohar, 1998).
In 1968 the government reduced and maintained a Treasury bill rate of 4.3% until 1982 with an increase in 1983 of 5.00% and 5.70% in 1985. This was done in the government’s favour to allow it to borrow from the banking sector at a lower cost. There was however a rapid decline in the real interest rate throughout this period, the highest recorded at -26.95% in 1981 due to the high inflation rate of the Tanzanian shilling during this period (Odhimbo, 2011).
According to the IMF (2009) the bank rate for Treasury Bills was also dictated by the government during this period. This saw the nominal bank rate set at 5.00% from 1967 to 1977, 6.00% from 1979 to 1986. However the real bank rate experienced a negative trend with a low of -28.88% in 1 due to the high inflation 1985. The normal lending rates were adjusted to 7% in 1967, 6.5% in 1968 through to 1977, 6.54% in 1978 and 13% in 1984. Regardless of these adjustments the real rate showed a negative trend throughout this period. Deposit rates were also administratively fixed. The government fixed it at 4% per annum from 1967 to 1984 and 4.5% in 1985. The real deposit rate however showed a persistent negative trend.
Looking at figure 2.7 below, the interest rates began showing positive gains as a result of a change of course and principles influencing the government’s control of the finance sector. The figure below shows the trend of interest rates and inflation rates in Tanzaniafrom 1978 to 1989.
29
Figure 2.7: Trends of Interest Rates and Inflation Rate in Tanzania (1978-1989).
Source: Odhimbo (2011)
After further loosening of policies within the financial sector governing the interest rates in Tanzania in the early 1990s, there were significant increments in the real and nominal interest rates as follows; The treasury bill in 1995 was at 40.33%, 1994 saw the deposit rate at 26% and an increase in nominal and real lending rates. The figure below shows the trend of interest and inflation rates in Tanzania from 1995 to 2005.
30
Figure 2.8: Trends of Interest Rates and Inflation Rate in Tanzania (1995-2005).
Source: Odhimbo (2011)
2.7 AN OVERVIEW OF FINANCIAL LIBERALIZATION IN MADAGASCAR
2.7.1 The Liberalization process
Madagascar made efforts towards financial liberalization in the late 1980's. This was through two International Development Appointment adjustments that resulted in positive and negative results in the economy. Huge backing came from the World Bank and these efforts were reciprocated by the local banks dedication and the governments drive towards budgetary reforms in the private financial sector. This conducive environment hence promoted trade liberalization. However due to lack of attention from the government and banks the public sector and the civil service suffered (Ikhide, 2015).
31
Looking back on the liberalization attempt by Madagascar shows that privatization is key in sustaining trade and financial changes. Findings from an OED audit of the projects showed that the government’s lack of full commitment to these restructuring processes led to the poor performance in the public sector. Privatization through transparency, publication of reforms on the social safety net programs, clarity on the key business objectives and performances, banks and borrowers clearing out the nitty-gritty details of their contracts by agreeing on standardized set of rules (Ikhide, 2015).
Madagascar after its independence in 1972 took it on itself to empower its local business enterprises. This was through giving these local enterprises monopoly in trading with hopes of benefiting and building a stronger local economy (IMF, 2015). The government strictly promoted a policy which encouraged domestic production that would discourage importation of goods. Huge financial external debt was experienced resulting in the government restructuring its trade policies with backing from the International Monetary fund and banking restructures.
Government sort to approve two policies which covered local and foreign trade and the highly neglected public sector; the Industry and Trade Policy Adjustment Credit (ITPAC) approved in 1987 and the Public-Sector Adjustment Credit (PSAC) approved in 1988. ITPAC main aim was to create a liberal environment that would encourage local and foreign trade. This was a move towards restructuring the public banking and investment sector. PSAC main agenda was to restructure the way public resources were distributed putting a close eye on public investments and expenditure, change the way the banking system dealt with public resources and aim at creating clarity and justifying public businesses (IMF, 2015).
32
2.7.2 Experiences Post- Liberalization in Madagascar
ITPAC policies prove to be quite successful. This was achieved through the government loosening its hand in the control of prices and profit gains, justified and reduced import taxes, stopped restrictions on the import and export quantities and restructured the exchange rate policies making it more beneficial to traders (IMF, 2011).
According to IMF, (2015) PSAC also experienced success. The first phase involved restructuring of the budget process benefitting the public sector and allowing the private banking system to get involved in implementing PSAC policies. However, the second phase experienced a slow down due to lack of resolve of minor issues which intern led to the termination of the third phase. From the onset the policies structure was unresolved. This was due to rushed implementation pressured by the banks that were to benefit although there was no surety from the debtors. Lack of accountability of the institutions involved also played a role in this policies collapse.
The policies and goals were not outlined and adhered to. Changes that were made in the public business sector were not clearly defined and shared with the public. The government was not being clear with the criteria it followed in privatizing enterprises. It took it on itself to take control of public businesses that were performing poorly. Public sector businesses that stayed afloat or that were successful were never considered by government for privatization. A 1995 audit highlighted that the government had privatized 100 enterprises which was putting a huge strain on the government resources (IMF, 2009).
Madagascar experienced a lot of political instabilities in 1991 – 1993. This led to older existing policies being restructured to political ends. Funding for financial liberalization projects were
33
put to an end due to lack of resolve of issues that were carried on from the previous regime. This particularly affected private business restructuring process that were instead replaced by policies that were less beneficial and did not promote liberal financial environments. Civil service restructuring and changes did not take off at the time. Political liberalisation became more important to achieve and took centre stage over financial liberalisation in the public sector (IMF, 2015).
2.7.2.1 Social Characteristics of adjustment
The new environment brought about by privatization of the public sector required that the public adjust and adapt to the new norms (IMF, 2011). In 1988 a companion Economic Management and Social Action Support Project was launched in order to counteract and ease the effects on the public. The project proves to be very costly for both the government and banks. This was due to poor initiation and lack of a concrete plan to reduce the impact caused by this environment on the underprivileged. Implementation of the strategies only took place 5 years after the privatization begun.
Political influence though small, played a role in creating unfriendly environments for privatisation of the public enterprises. The process of privatisation although having faced many challenges, seemed to have had a positive effect on the people financially. However, had the government and the banking sector timeously streamlined and refined the reform process, the resultant gains and benefits would have been more significant.
2.7.3 Experience during Liberalization Process in the Madagascar.
The government and banks got too involved in trying to resolve the minor processes that would satisfy successful privatisation of the public sector. This took too long resulting in them
34
ignoring the bigger policy issues that would have made a bigger impact in the reform process. The government and banks should have formulated and concentrated on major frameworks than tried to manage and micromanage every business entity. A well-designed formula for reforms, transparency and accountability in the process is necessary for the privatizations success (IMF, 2011).
Lack of attention and full involvement by government on the restructuring of public businesses and the civil service led to the poor outcomes of the privatization process. More involvement of banks and government when it came to trade and financial liberalization in the private sector led to its success. This shows that more involvement in the policy making and their implementation by both government and banks results to more positive outcomes in the liberalization process in both private and public sector (IMF, 2015).
Although privatisation played a role in the liberalization process, it took too long to privatise most of the public enterprises. There was an attempt to clean up the finances and accounts of acquired banks but this did not prevent the repercussions of its overindulgences from ensuing. There was an attempt by the central bank to pay off the excesses of the public banks by credit expansions that led to a liquidity crisis in 1991. Had the banks been privatised this credit expansion would not have been allowed (IMF, 2011).
According to IMF, (2011) transparency in the privatisation processes of the public sector was key in creating confidence in the public during the reform process. The parties involved especially the public should be well aware of the reform process and assured that there is equal and fair treatment of all stake holders. Controlled foreign investments and balanced ethnic opportunities for the Malagasy population would have created equal opportunities for all.
35
Maintaining the process of privatisation of public enterprises would require the formulation of a solid contingency plan to convince the public to accept the process. This would have sufficed at the time of political and social instability that Madagascar was in.
2.8 CONCLUSION
The chapter has focused on presenting an overview of financial liberalisation in the SADC region, specifically looking at the sample overview completed in this chapter has made it clear that the different member states of the SADC region, have implemented the process of financial liberalization in so many different strategies, hence the results, experiences and outcomes vary from country to country. It has been observed that the SADC member states’ financial markets are too small, with the exception South Africa, the reason for this could be low levels of financial diffusion and high interest margins in many SADC countries. In total, post financial liberalization the SADC region has maintained a strong economic growth and future prospects are promising. Most SADC member states have steadily implemented banking liberalisation, slowly sequencing the process and are correct indeed. Financial reform is a very sensitive topic and the domestic interests of different consumers, stability and efficiency have to be carefully considered.
36
CHAPTER THREE
LITERATURE REVIEW AND THEORETICAL FRAMWORK
3.1 INTRODUCTION
This chapter reviews theoretical and empirical literature on the impact of financial liberalization on financial instability. The chapter consists of three parts; the first part covers the theoretical literature focusing on presenting the hypothetical impact of financial liberalization on financial instability. The second section focuses on the empirical literature discussing the available studies on the impact of financial liberalization on financial instability. The final section presents an assessment of literature.
3.2 THEORETICAL LITERATURE
There have been theories which have been documented to explain the role of financial liberalization in emerging economies. This section will discuss two prominent theories that are closely linked to financial instability which are the McKinnon and Shaw model and the De Meza and Webb model.
3.2.1 McKinnon and Shaw Model
McKinnon (1973) and Shaw (1973) assumed that in a country, where interest rates are liberalized, there will be an increase in the real interest rate which will lead to increase in domestic savings, increased investments and ultimately lead to economic growth. The essence
37
behind the McKinnon and Shaw model revealed that financial liberalization results in capital inflow. The increase in financial inflow boosts domestic savings and capital allocation.
In the beginning of the 1970’s, developing countries experienced resilient declines in economic growth and impacted greatly on the financial systems. McKinnon (1973) and Shaw (1973) pointed out that the declines in the economic growth and deteriorating investment performance was caused by the interest rate ceilings, direct credit allocation policies, foreign exchange regulations, dense taxation in the financial sector, restrictions in the allocation of credit and extremely stringent reserve requirements. McKinnon (1973) and Shaw (1973) then categorised these regulations as financial repression. According to McKinnon (1973) and Shaw (1973), financial repression refers to a system whereby the government imposes interest rate ceilings, direct credit allocation policies, foreign exchange regulations, dense taxation in the financial sector, restrictions in the allocation of credit and extremely stringent reserve requirements.
Having pointed out financial repression, McKinnon (1973) and Shaw (1973) encouraged financial liberalization, which according Ikhide (2015) is a policy implemented to ensure full financial freedom in the economy, independence of central banks from state/government, removal of government determined differential interest rates schemes, freedom in banks in chasing profits, de- nationalization (removal of restrictions in bank ownership) and complete foreign ownership freedom.
Financial repression came along with several negative effects. In the form of interest rate ceiling, financial repression meant keeping the interest rate at a level below the free market rate. According to Sibanda (2012), this is because if the allocation of credit is not price-based, then it gives the state an authority to govern who is accesses credit and who is not. Savings and
38
capital formation in turn declines hence impacting negatively on the country’s financial system. Ikhide (2015) highlighted that government’s direct control suppresses interest rates and may also undermine the effectiveness of the monetary policy and encouraging capital escalation. These arguments against financial repression made visible the need for countries to implement financial liberalization in financial systems.
The policy recommendation provided by McKinnon (1973) and Shaw (1973) was that liberalization of the financial sector of countries is an attempt to achieve economic growth promotion, by letting the interest rates to modify freely according to market mechanisms and not by government mechanisms. According to McKinnon (1973) and Shaw (1973), entrepreneurs have more returns on investments in high-yield projects and in this way, higher economic growth is expected. Figure 3.1 below depicts the effect of the movement from financial repression to financial liberalization as supported by the McKinnon and Shaw model.
39
Figure 3.1: The effect of movement from financial repression to financial liberalization
Source: Sibanda (2012)
In Figure 3.1 above, the vertical axis shows the real rate of interest whereas the horizontal axis shows both savings and investment. The SS curve is the savings function which is a positive function of real interest rates. The II represents the investment function. If the market was allowed to operate freely, equilibrium in the market for loanable funds would be attained at point E, where amount saved is equal to amount invested (I*) and the market-determined rate of interest would be r*. Line C represents an interest rate ceiling (as a result of financial repression) which is an administratively fixed nominal interest rate that holds the real rate below its equilibrium level. If the interest rate ceiling is imposed on deposit rates, actual savings would be limited to I1. Since the ceiling is applied only to deposit, but not loan rates, the investor/borrower faces a lending rate r2 which would be the market clearing rate at constrained investment of I1. However, interest rate ceilings usually apply to both deposit and lending interest rates. In this case, both savings and investment would be restricted to I1, AB amount of investment opportunities are not met, and the investment undertaken would be inefficient.