“The use of impression management
tactics in typical and maximum
performance situations and the influence
of self-efficacy”
Athur Menko
Studentnummer 9925805
Fleur van Heek
Studentnummer 0140414
Universiteit van Amsterdam
Master thesis
Supervisor Ute-Christine Klehe
maart 2007
Abstract
Numerous researchers (e.g. Klehe & Anderson, 2005) have stressed the importance of distinguishing between maximum performance (what people ‘can do’ when evaluated) and typical performance (what people ‘will do’ on a daily basis). This research proposes that self- efficacy (SE) influences maximum and typical performance. We also focus on impression management (IM) tactics used by the participants. Traditionally IM tactics have been divided into assertive and defensive IM tactics. Here we propose a different classification, namely competence oriented versus sympathy oriented IM tactics. This classification is based on the competency-demand hypothesis (Mischel & Shoda, 1995, 1998; Wright & Mischel, 1987). In this research we examine the amount and the different kinds of IM tactics people use in the typical and in the maximum condition.
Videos were observed of 93 participating first year psychology students. Their SE was manipulated through a fake feedback on a multiple choice knowledge test. Next, participants explained three topics to a confederate, presented to participants as being another student (typical condition) and to the experimenter (maximum condition). Each participant was rated on quality of explanation, behavior and use of IM tactics in both conditions.
Results showed that participants in the high SE condition generally performed better than participants in the low SE condition. Contrary to the hypotheses participants used more IM tactics in the typical condition than in the maximum condition. More specifically, they used the competence oriented IM tactics more in the typical condition than in the maximum condition. The sympathy oriented IM tactics were used more in the maximum condition than in the typical condition. Both high and low SE participants used more defensive IM tactics than assertive IM tactics in both conditions.
Index
1. Introduction p. 4
1.1 Typical and Maximum performance p. 6
1.2 Evaluation aspect p. 8
1.3 Self-efficacy p. 9
1.4 Hypotheses p. 9
1.5 Hypotheses including impression management p. 10
2. Method p. 16 2.1 Sample p. 16 2.2 Procedure p. 16 2.3 Measures p. 18 3. Results p. 22 3.1 Reliabilities p. 22 3.2 Manipulation checks p. 23
3.3 Checking for controls p. 23
3.4 Hypotheses p. 25
3.5 Hypotheses including impression management p. 28
4. Discussion p. 33 4.1 Theoretical contribution p. 38 4.2 Practical contribution p. 39 4.3 Methodological contribution p. 40 4.4 Conclusion p. 43 5. References p. 44 6. Appendix p. 48
1. Introduction
Selection processes are essential to all organizations. These organizations have traditionally used many tools during the recruitment processes to determine the fit between the organization and the prospective employee. One of the issues that arise during the testing in the selection procedures is the natural tendency of the potential employee to perform at his or her peak (maximum performance). While this is important, because it shows the (intellectual) potential, people do not perform at their peak all the time (typical performance). Thus, it is important to make this distinction between peak (maximum) and average (typical) performance. Klehe and Anderson (2005) said that in selection processes, organizations want to distinguish what people ‘can do’ and what people ‘will do’ in terms of their future job performance. Previous research (Klehe & Anderson, in press) has demonstrated this distinction between maximum performance (what people ‘can do’ when evaluated) and typical performance (what people ‘will do’ on a daily basis) to be present.
Wayne, Liden, Graf and Ferris (1997) found that people can influence how they are being evaluated. In their research Wayne et al. (1997) found that several subordinate influence tactics were related to managers' perceptions of subordinates' interpersonal skills, manager liking of subordinates, and managers’ perceptions of similarity to subordinates. Specifically, subordinates’ use of reasoning, assertiveness and favour rendering were positive ly related to managers’ perceptions whereas bargaining and self-promotion were negatively related to these perceptions. Wayne and Liden (1995) found that subordinate impression management behavior influenced supervisory performance ratings through their impact on supervisors' perceptions. Impression management (IM) is defined as, those behaviors individuals employ to protect their self- images or influence the way they are perceived by significant others or both (Schlenker, 1980). According to Schneider (1981), IM behaviors can take different forms: verbal statements and
nonverbal or expressive behaviors, are the most well known. In this research we examine how people use IM tactics to influence their evaluation. More specifically, what kind of different IM tactics (Stevens & Kristoff, 1995) and in which amount do people use the different IM tactics in typical and in maximum performance situations.
Outlining the use of IM tactics in distinction between typical and maximum performance situations, can add valuable information for practitioners in personnel selection and in evaluating job performance. As demonstrated above, IM clearly contributes to the way people are observed. A better understanding of the use of the different types of IM tactics in different situations can, for example, help practitioners get an insight on when participants are inclined to use certain IM tactics. Likewise, when knowing these tendencies, recruiters for instance could prevent themselves to let the use of IM tactics distract them and therefore can focus more on the content of what the participant says. This way recruiters can make more objective decisions in selection processes. [0]Besides this research of being valuable to practitioners, it is also valuable to researchers in personnel selection. Up to date IM tactics have never been studied in the different (typical and maximum) performance situations. Therefore analyzing the effect of the different performance situations on the use of the different types of IM tactics can contribute to the field of Industrial, Work and Organizational Psychology.
There are two factors that play a role concerning typical and maximum
performance and the use of IM tactics. First we have the evaluation aspect. Evaluation can enhance performance on a simple task and diminish performance on a difficult task (Smith & Mackie, 2000). In this research the evaluation aspect is clearly present in the maximum performance situation and hardly present in the typical performance situation. During an interaction between people there is always some evaluation present. Because in this research the evaluation aspect is hardly present, we will refer to the typical condition as no evaluation being present. With this we make a clear difference between the two performance condit ions. The second factor is the construct self-efficacy. Self-efficacy (SE) is “the beliefs in one’s capabilities to organize and execute courses of action required to produce given attainments” (Bandura, 1977; p 3). In this research SE is important, because previous research has found that SE is a valid predictor for job
performance (Judge & Bono, 2001).
All together, in the present research we first examine typical and maximum performance by taking the reader by hand through the literature that has been gained by numerous researchers. Then we take a deeper look into the evaluation aspect of the typical and maximum performance situation. Next, SE is explained more thoroughly,
where upon we come to our expectations of this research. In total nine hypotheses are formulated based on the literature of all the constructs mentioned above, including IM. Then, the reader is informed with the Method of this research, after which follow the Results. At last we finish with the Discussion of this research, where all the results and practical implications are discussed.
1.1 Typical and Maximum performance
Numerous researchers have stressed the importance of distinguishing between maximum performance and typical performance. Sackett, Zedeck and Fogli (1988) proposed that typical performance was influenced by both ability and motivation while performance under maximum test conditions was primarily a measure of ability. The reason
underlying this proposition is that motivation is variable in situations of typical
performance, in which (a) individuals are not aware of a performance evaluation and (b) are not consciously trying to perform their best. Additionally, (c) performance is
observed over an extended period of time. Sackett et al. (1988) also proposed that motivation was expected to be high in situations of maximum performance, in which (a) individuals are explicitly aware that their performance is being observed and evaluated and (b) are explicitly aware of and accept the implicit or explicit instruction to maximize effort, and in which (c) the time duration of the situation is short enough for the
performer to remain focused on the task of maximum performance.
Sackett et al. (1988) and DuBois, Sackett, Zedeck and Fogli (1993) argued that these situational characteristics forced motivation to be high in maximum performance situations: The choice to perform was expected to be high by individuals’ awareness of being monitored. The level of effort was high since individuals were, by definition, aware of and accepted the instruction to expend effort. During situations of maximum
performance, when performers are encouraged to invest their full effort and are evaluated on the basis of their performance, the link between performance and extrinsic rewards becomes highly apparent, leading performers to be highly motivated and the resulting performance to be a reflection of their ability. DuBois et al. (1993) also found that supermarket cashiers’ cognitive ability was more related to their maximum than to their typical speed of processing goods. This indicates that in a maximum performance
situation more of the cognitive ability is demanded than in a typical performance situation.
Unfortunately the empirical outcome of the assumption that motivation is variable in typical conditio ns and expected to be high in maximum conditions is comparatively weak (Sackett et al., 1988). Still, the idea has found considerable recognition in
Industrial, Work and Organizational Psychology due to its wide-ranging theoretical and practical implicatio ns. Klehe and Latham (2006) found typical and maximum
performance to be distinct though related constructs. They showed that practical
intelligence correlated significantly higher with maximum than with typical performance. KSA’s correlations with performa nce pointed in the same direction without being
significant, though. Based on research (Klehe & Anderson, 2005) the Typical and Maximum Performance Scale (TMPS) was developed. In this research the TMPS was used to check if the manipulation (typical versus maximum) succeeded.
Ployhart, Lim and Chan (2001) adopted a different approach. An earlier study had revealed that the ‘big five’-personality factors were somewhat related to transformational leadership (Judge & Bono, 2000). Ployhart et al. (2001) argued that this relationship should be pronounced in maximum performance conditions, since they believed that transformational leadership might be especially relevant under those circumstances. They found maximum and typical transformational leadership performance to be related, but distinct latent constructs. The importance of this distinction is shown by the fact that validities for the personality constructs were not equally predictive of both criteria: Openness was most predictive of maximum performance and Neuroticism was most predictive of typical performance.
Using an internet-search-task within a laboratory setting, Klehe and Anderson (in press) offered a first complete confirmation of Sackett et al.’s (1988) model and
proposition that there is a correlation between motivation and maximum performance. Their findings also confirmed that the correlation between motivation and performance diminishes, while the correlation between ability and performance increases in maximum conditions.
To date, the field of typical and maximum performance studies is increasing. Findings presented by Klehe and Anderson (in press) show that maximum performance
conditions always have the proposed effect on motivation but no effect on performers’ ability. It could be that the findings are primarily a function of the task being rather repetitive and of low intrinsic interest to performers. Whether their findings hold true for other tasks still needs to be tested.
A central characteristic of the literature on typical and maximum performance is the distinction between high (maximum performance) versus low expectations of evaluation (typical performance) (Sackett et al., 1988). Therefore it could very well be that a different amount and different kinds of IM tactics will be used in the different performance situations. Next the evaluation aspect will be discussed.
1.2 Evaluation aspect
Whether or not people are being evaluated, can influence their performance. As mentioned above, evaluation can enhance performance on a simple task. This is called social facilitation (Smith & Mackie, 2000). On the other hand social inhibition can occur. This means that performance on a difficult task can be diminished by evaluation (Smith & Mackie, 2000). Thus, the factor explaining the difference between social facilitation and social inhibition is real or perceived task difficulty. When on the contrary evaluation is absent, social loafing can arise. Social loafing is the tendency to exert less effort on a task when an individual’s efforts are an unidentifiable part of a group than when the same task is performed alone (Smith & Mackie, 2000).
The phenomena of social facilitation, social inhibition and social loafing have common underlying mechanisms (e.g. Jackson & Williams, 1985; Harkins, 1987; Harkins & Szymanski, 1987). The same mechanisms are likely to affect maximum and typical performance (Sackett et al., 1988). The argument that “unless one is inviting disciplinary action, one has little choice but to expend effort on the task in question” (Dubois et al. 1993; p 206) is the same argument used for explaining the lack of social loafing when individuals are evaluated. Thus, it can be proposed that the results obtained in studies on social facilitation and inhibition, as well as social loafing might also be applicable to maximum and typical job performance. In this research, this means that evaluation can enhance performance when the task is perceived as a simple task (social facilitation). On the other hand evaluation can also diminish performance when the task is
perceived as simple (social loafing) and when the task is perceived as difficult (social inhibition).
1.3 Self-Efficacy (SE)
If results are applicable to maximum and typical performance, then research on social facilitation, social inhibit ion, and social loafing suggest that the relationship between maximum and typical performance is more complex than Sackett et al. (1988) proposed.
A construct that possibly can contribute to a better understanding of this complex relationship is self-efficacy (SE), “beliefs in one’s capabilities to organize and execute courses of action required to produce given attainments” (Bandura, 1977; p 3). Kirk and Brown (2003) challenged the notion of the maximum performance paradigm by testing the effects of proximal (SE) and distal (need for achievement) motivation on performance in the maximum condition. In their study they used a walk-through performance test to evaluate the performance of 90 blue-collar employees. The structural model
demonstrated significant pathways between latent measures of motivation, SE, and performance ratings. The findings confirm the explanatory power of SE on performance in maximum conditions. In a meta-analysis about the relationship of SE with job
performance, Judge and Bono (2001) found that SE had a correlation of .23 with job performance. In total, the results based on 274 correlations suggest that SE is a valid predictor of job performance.
1.4 Hypotheses
Deducted from the theory above, expectations for this research are made. Nine hypotheses are formulated.
- Hypothesis 1: Participants with high SE in the task will generally perform better than participants with low SE in the task in both performance conditions.
Moreover Sanna (1992) found that expectation of evaluation on the task enhanced performance of individuals with high SE. For individuals with low SE, performance on the task diminished when expectations of evaluation were present. These findings suggest
that performance does not always increase in the maximum condition, due to the level of SE, since social inhibition and social facilitation are induced by perceived task difficulty, and by not real task difficulty.
Thus, SE may be a moderator of the effects of the performance in the typical and maximum condition: people should perform better in the maximum condition if they have high SE in the task and think the task will be simple for them, but should perform worse if they have low SE in the task and think that the task will be difficult for them.
- Hypothesis 2: The maximum and typical condition will interact with participants’ SE.
2A: Participants with high SE in the task will perform better in the maximum condition than in the typical condition.
2B: Participants with low SE in the task will perform worse in the maximum condition than in the typical condition.
Since maximum performance is known to be related but distinct from typical performance (Ployhart et al. 2001) and since Hypothesis 1 assumes that SE correlates with typical performance, one can further propose:
- Hypothesis 3: Introducing SE as a second predictor of typical performance, after the first predictor maximum performance, should improve the prediction of typical performance.
Based on Sanna (1992) we have made the assumption that SE influences performance. Earlier, we pointed out that people can influence the evaluation of their performance by using IM (Wayne et al., 1997; Wayne and Liden, 1995).
1.5 Hypotheses including impression management (IM)
Impression Management (IM) is defined as a “conscious or unconscious attempt to control the images that are projected in … social interactions” (Schlenker, 1980, p. 6). People seek to highlight their virtues and minimize their deficiencies (Schlenker, 1980).
Zivnusk, Kacmar, Witt, Carlson & Bratton (2004) linked performance with IM tactics. They suggested that individuals, in order to increase their perceived value to the organization, may engage in political behaviors with the aim of positioning themselves as a powerful and crucial person. An employee who perceives that politics are widespread in the organization may use IM tactics to convince others to view him or her as influential or vital.
Following the above, in this research we expect that when performing well, participants will emphasize their good performance by using more IM tactics.
- Hypothesis 4: Participants who perform better will use more IM tactics
Considerable theory (Bozeman & Kacmar, 1997; Ferris & Judge, 1991) and research (Kacmar & Carlson, 1999; Rynes & Gerhart, 1990) suggest that the use and effectiveness of IM tactics may vary across situations. In this research, the two situations are the typical condition and the maximum condition. That IM tactics play a profound role when performance is evaluated, for example in a selection interview or assessment center (McFarland, Yun, Harold, Viera Jr. & Moore, 2005; Ellis, West, Ryan & DeShon, 2002), has been supported. In this research we look at the use of IM tactics when
evaluation is present (maximum condition) and also when evaluation is “not” (typical condition). Because people seek to highlight their virtues and minimize their deficiencies, people are expected to use more IM tactics when they are being evaluated, in the
maximum condition.
- Hypothesis 5: Participants will use more IM tactics in the maximum condition than in the typical condition.
IM tactics consists of verbal and nonverbal behavior. In our research we mainly focus on verbal IM tactics. Verbal IM tactics can be split into two broad categories of tactics: assertive and defensive (Stevens & Kristoff, 1995). Assertive IM tactics are used to acquire and promote favorable impressions (Tedeschi & Norman, 1985) and consist of Ingratiation, Self-Promotion and Overcoming Obstacles tactics. Whereas the assertive IM
tactics are designed to bolster one’s image, defensive IM tactics are designed to protect or repair one’s image (Higgins, Snyder, & Berglas, 1990; Schlenker, 1980). Researchers have identified a number of different defensive IM tactics, including Excuses,
Justifications, and Apologies (e.g., Gardner & Martinko, 1988).
Besides splitting IM into assertive and defensive IM tactics, we suggest an additional categorization of IM tactics, namely competence and sympathy oriented IM tactics. Figure 1 (appendix p. 48) shows this categorization of the different IM tactics.
****************** Insert Figure 1 here ******************
McFarland et al., (2005) conducted two field studies to understand how the competency demands of assessment center exercises influence the use and effectiveness of IM tactics. The competency-demand hypothesis is based on Mischel’s (Mischel & Shoda, 1995, 1998; Wright & Mischel, 1987) work that has examined how behavior changes as a function of both one’s personal characteristics and characteristics of the situation. The competency-demand hypothesis suggests that situations vary in terms of the demands they place on various competencies (Shoda, Mischel, & Wright, 1989; 1993a, 1993b) For instance, in studies conducted by Shoda et al. (1993a) and Wright and Mischel (1987), the authors examined children’s behavior across a variety of camp situations. They had experts code the camp situations for the extent to which they elicited certain competency demands relevant aggression. In both studies they found that
situations with strong competency demands relevant for aggression resulted in a mean increase in the display of aggressive behavior as compared to situations with weak competency demands for aggression. Further, there was also more variability in
aggressive behavior in those situations with high competency demands for aggression. In situations that had no competency demands relevant for aggression, few people behaved aggressively and, therefore, variability in aggressiveness was small. Although previous work has focused on aggression, Mischel and his colleagues have consistently suggested that situations may also demand other competencies (Shoda et al., 1993a). For example, a situation may demand social or cognitive competencies, and such situations will elicit individual differences relevant to those competencies (Wright & Mischel, 1987).
Because Shoda et al., (1993a) suggest that you can generalize the competency-demand hypothesis to different competencies than aggression, we expect in this research that in the maximum situation there will be a higher demand to look competent. Because the participants in the maximum condition are evidently being evaluated, we expect them to put more effort in looking competent on, for instance, intelligence and knowledge and therefore will use more IM tactics.
The competence oriented IM tactics that are used in this research are Self-Promotion, Overcoming Obstacles, and Justification. Previous research has shown that the three IM tactics are good examples of competence oriented IM tactics (McFarland et al., 2005; Ellis et al., 2002). Self-Promotion tactics are intended to show that the
participant possesses desirable qualities for the task. For example, a participant tries to make others think that he or she is competent in either general ability dimensions (e.g., intelligence) or specific skills (e.g., ability to explain clearly to another person) (Ellis et al., 2002). In this research an example of a Self-Promotion IM tactic item is: “The student claims to know a lot about the subject”.
Overcoming Obstacles is a tactic used by the participant to circumvent problems or barriers impeding progress toward fulfilling the task (Ellis et al., 2002). To use this tactic, the individual must show that an obstacle was present and that it could ha ve hindered progress. An example of an Overcoming Obstacles IM tactic item is: “The student claims to know the answer, but will come back to it later”.
Finally, Justification is an IM tactic that involves the participant accepting the responsibility for a negative outcome or event but suggests that it is not as bad as it seems (Ellis et al., 2002). Often the negative outcome is attributed by the participant to an external cause. “The student cannot explain much about the subject, but implicates that it is not important”.
Except being focused on looking competent, people can also use IM tactics to be liked (Ellis et. 2002). We call these IM tactics: sympathy oriented IM tactics, consisting of Ingratiation, Excuses and Apologies. Because these sympathy oriented IM tactics do not contribute to looking competent, we expect them to be used less in the maximum condition compared to the competence oriented IM tactics.
- Hypothesis 6: Participants in the maximum condition will use the competence oriented IM tactics (Self-Promotion, Overcoming Obstacles, and Justification) more than the sympathy oriented IM tactics.
In the typical condition participants’ performance is perceived as less important by the participants themselves than in the maximum condition, because of the lack of evaluation (Sackett et al., 1988). Therefore we expect participants to focus more on giving a sympathetic impression in the typical condition. Good examples of sympathy oriented IM tactics found in previous research are Ingratiation, Excuses and Apologies (McFarland et al., 2005; Ellis et al., 2002). Ingratiation refers to a tactic that is intended to evoke interpersonal liking and attraction between the experimenter/confederate and the participant by, for instance, praising and flattering (Ellis et al., 2002). For example, “The student gives a compliment to the other person”.
Excuses is a tactic used by the participant to deny responsibility for a negative outcome or behavior. An example of an Excuses IM tactic item is: “The student points out to the other person that he or she does not know the answer all too well, because the subject was studied a long time ago”.
Last, Apologies is a tactic that involves accepting responsibility by the participant for a negative outcome or event and also recognizing the negative implications of such responsibility along with the acknowledgement that certain actions are unacceptable. “The student apologizes for making a mistake”, is an example of an Apologies IM tactic item.
Because the evaluation aspect is no t present in the typical condition, the need to look competent could be smaller. Liden and Mitchell (1988) suggested that as status difference increases between ingratiatory and target, the perceived risk of ingratiation also rises. In the typical conditio n the perceived status difference is absent, because participants think they are explaining the content to a fellow student. Therefore we expect participants to emphasize more on being liked and hence use the sympathy oriented IM tactics more than the comp etence oriented IM tactics.
- Hypothesis 7: Participants in the typical condition will use the sympathy oriented IM tactics (Ingratiation, Excuses and Apologies) more than the competence oriented IM tactics.
Finally, when combining IM tactics with SE, SE is expected to influence the use of IM tactics in both the typical and maximum condition. SE has been found to have explanatory power of performance in test conditions. The IM literature (Fletcher, 1989; Tedeschi & Norman, 1985) differentiates between IM behaviors that are assertive and those that are primarily defensive. Assertive IM tactics occur when a person actively tries to establish an identity to gain rewards whereas defensive IM tactics are oriented to protect the individual’s identity from challenge or threat (Fletcher, 1989). As mentioned earlier, there is the expectation of participants with high SE to enhance task performance and they can do so by trying to establish an identity to gain rewards (Sanna, 1992). This leads to the expectation that participants with high SE will use more of the assertive IM tactics.
- Hypothesis 8: Participants with high SE in the task will use more assertive IM tactics in comparison to defensive tactics in the typical and maximum
condition.
Moreover, participants with low SE are expected to diminish in task performance. Herewith the participant might try to protect one’s identity from challenge or threat (Sanna, 1992). This leads to the expectation that participants with low SE will use more of the defensive IM tactics.
- Hypothesis 9: Participants with low SE in the task will use more defensive IM tactics than assertive tactics in the typical and maximum conditions.
2. Method 2.1 Sample
Videos were watched of the 93 participants who had signed up for the experiment. During the experiment the participants had to perform in the typical and in the maximum condition. At the end the participants had to fill in the Typical and Maximum
Performance Scale (TMPS) (Klehe & Anderson, 2004b) to see if the participants
experienced the conditions as different from one another. While watching the videos the participants were observed on their behavior. The scoring of the observations was done with the Behavioral Observation Scheme (BOS) (Murphy, Martin & Garcia, 1982). The participants were also rated on their use of IM tactics by means of the Impression Management Scheme. In two cases data was missing because of software/test material failures: for one case the BOS and content scale from the typical condition were missing and for another case the TMPS from the typical condition were missing. These cases were excluded from analyses when referring to these data. Seven participants were excluded from all analysis due to the low auditory quality of their videos. On the videos these participants were inaudible.
Consequently, 86 psychology students (12.9% male, 87.1% female) with an average age of 20.26 years (SD = 2.86) participated in this research (see Table 1;
Appendix p. 49). They were all first year psychology students who had participated in the first Introductory Psychology exam before the start of the experiment.
2.2 Procedure
The appendix contains a process diagram (p. 57 )1; and the task- information in Dutch (p. 58), and in English (p. 70) On the videos could be seen that dur ing the welcoming of the participant and confederate to the experiment, which was said to be about Introductory Psychology, both were unobtrusively asked about their perceived performance in the first exam of Introductory Psychology. After this, the experimenter explained the purpose of the experiment. Of course this was done through a cover story to prevent subject expectancy effects: participants were told that the experiment dealt with the effect their
1
The experiment was run in Dutch. English translations of the test-material are provided in the Appendix (p. 32).
explaining would have on the knowledge of another student. For this reason, they had to accomplish two tasks: First they had to explain content of the Introductory Psychology lecture to the other student. Second, the explaining skills would be measured directly through an evaluation of the explanation to the experimenter.
The first task on the video was a 9-item multiple-choice knowledge test about the three content domains covered in the performance tasks in the experiment, followed by a fake feedback. Participants with a negative feeling about their exam received a low result (the lower 20th percentile) and participants with a positive feeling about their exam received a high result (the upper 80th percentile) in order to manipulate their self-efficacy (SE) to explain topics from Introductory Psychology to someone else. With this
manipulation one can not be sure that the effect is due to the manipulation and not due to the actual knowledge. Here fore see Sanna (1992), for a comparable manipulation. The confederate received a constant feedback of having performed at the 50th percentile, an average result. Then participant and confederate filled out a SE questionnaire as a manipulation check before being ‘randomly’ assigned to the roles of either explainer or receiver.
In the third task, which consisted of the first performance task, participants had to explain three topics of Introductory Psychology (to the student/confederate in condition one: typical performance, to the experimenter in condition two: maximum performance). Unlike in the typical condition, in the maximum condition, evaluation apprehension was raised by (a) the explicit evaluation by the experimenter, (b) the explicit instruction to maximize effort and (c) the explicit time duration of a maximum of 15 minutes (Sackett, Zedeck & Fogli, 1988).
In the fourth task, the participants filled out a questionnaire about their feelings during the previous performance task: the TMPS (Klehe & Anderson, 2004b). After this, the second performance task took place (explaining to the experimenter in condition one: maximum performance and explaining to the student/confederate in condition two: typical performance). Then participants filled out the questionnaire again as they had done after the first performance task, together with some background questions. In total, this experiment took one hour for each participant. Naturally, the experiment ended with a solid debriefing.
2.3 Measures
2.3.1 Performance
- The six questions used for the explanation tasks covered the same three content domains as the multiple-choice questions used as a basis for the fake feedback. Three questions each (1 per topic) were used for the assessment of typical and maximum performance (Tentamenbundels Onderwijsinstituut Psychologie, UvA, 2001; 2002). The order of questions was rotated. (The appendix contains the essay questions in Dutch, p. 64; and in English, p. 76). The subject matter expert in this area (the professor teaching Introductory Psychology) evaluated both sets of questions as equally difficult, based on results of former exams.
The content part of both explanations was coded according to a standardized coding scheme (developed in this research with support of the professor lecturing Introductory Psychology). Participants could receive a maximum of 8 points per question (one good aspect in the answer equaled one point), which made a maximum total of (3 x 8) 24 points (the appendix contains the coding schemes in Dutch, p. 64; and in English, p. 76).
- The communicative quality of the explanation was scored with a Behavioral Observation Scale developed to assess the quality of lectures (BOS; Murphy et al., 1982). This scale consists of 10 items, which were scored on a 5-point Likert-scale, ranging from 1 (entirely not applicable) to 5 (entirely applicable) (the appendix contains the BOS in Dutch, p. 67; and in English, p. 79). The
questionnaire was translated into Dutch. It was back translated by an independent person into English to rule out changes due to translation, following the procedure of “double-blind” translation.
2.3.2 Impression Management
- To measure impression management (IM) a coding scheme was developed. IM consists of verbal and nonverbal behavior. Verbal IM can be split into four broad categories of tactics: assertive and defensive (Stevens & Kristoff, 1995), and competence oriented and sympathy oriented (Mischel & Shoda, 1995, 1998; Shoda, Mischel, & Wright, 1989, 1993a, 1993b; Wright & Mischel, 1987).
Assertive IM tactics consist of Ingratiation, Self-Promotion and Overcoming Obstacles. Defensive IM tactics consist of Excuses, Justifications, and Apologies (e.g., Gardner & Martinko, 1988). Competence oriented IM tactics consist of Self-promotion, Overcoming Obstacles, and Justification and the tactics that belong to the sympathy oriented IM tactics are Ingratiation, Exc uses, and Apologies. Both verbal and non-verbal IM tactics were represented in the IM scheme and initially consisted of 23 items in total. The items were developed based on McFarland, Yun, Harold, Viera Jr. and Moore (2005), Ellis, West, Ryan and DeShon (2002), Stevens and Kristof (1995), Fletcher (1989), Gardner and Martinko (1988), and Tedeschi and Norman (1985). (The appendix contains the IM coding scheme in Dutch, p. 82). After factor analyses and confirmatory factor analyses using AMOS 5.0 (Arbuckle, 2003), the IM coding scheme represented six factors (the verbal IM tactics; Ingratiation (four items), Excuses (two items), Justification (two items), Apologies (two items), Self-Promotion (two items) and the non-verbal IM tactics (two items)). The fourteen items were scored on a 5-point Likert-scale (hardly present- frequently present).
2.3.3 Rating
- A hidden camera and microphone were installed in the laboratory. In doing so, it was possible for the uninformed observers to watch the videos in hindsight. A key element of this research is that the ratings were done double blind. The observers were uninformed and unaware of the purpose of the experiment and the
manipulation of SE and therefore only focused on the rating job. Hence, this could not influence or bias their ratings of the participants.
2.3.4 Manipulation checks
- To test whether the manipulation of SE with a false feedback had worked, participants filled out a questionnaire directly after they received their results from the multiple-choice test. SE was measured with the 8- item subscale of the Teacher Efficacy scale (Gibson & Dembo, 1984).
Items were adapted to make them applicable to the sample in this research, for example saying, “explaining” instead of “lecturing”. The items were scored on a 5-point Likert-scale, ranging from 1 (strongly disagree) to 5 (strongly agree). (The appendix contains the self-efficacy scale in Dutch, p. 67; and in English, p. 79). The questionnaire was translated into Dutch. It was back translated by an independent person into English to rule out changes due to translation, following the procedure of “double-blind” translation.
- To test whether the manipulation of both performance conditions (typical vs. maximum) had worked, participants filled out 14 items from the TMPS after both explanations (Klehe & Anderson, 2004b). This was done in order to check if the maximum condition was perceived as significantly more evaluative, if
participants felt more instructed to invest their full effort in the maximum
condition and if participants perceived the maximum condition to be shorter than the typical condition. The items were scored on a 5-point Likert-scale, ranging from 1 (strongly disagree) to 5 (strongly agree).
The TMPS originally contains 31 items; the first part assesses participants’ motivation, the second part assesses participants’ perception of the situation. The reason not to use the whole scale is twofold: since participants had to perform the task for a second time after filling out the TMPS-scale for the first time, too many questions about their motivation and the situation could have triggered demand effects and influenced participants’ performance in the second performance task. Second, the TMPS was not completely used because of practical reasons: filling out 31 questions would have taken too much time (the appendix contains the included TMPS items in Dutch, p. 68; and in English, p. 80). The questionnaire was translated into Dutch. It was back translated by an independent person into English to rule out changes due to translation, following the procedure of “double-blind” translation.
2.3.5 Control variables
In the preparation of this experiment, eight control variables were taken into account that else might influence results; knowledge at time of exam, date since exam, knowledge at
time of experiment, experimenter person, experimenter rating, timing/order effects, receiver behavior and background. This number of variables however, is far too much given the sample-size, thus reducing statistical power beyond an acceptable level (Cohen, 1988; 1992). Therefore it was necessary to leave some control variables out of the
analyses. Control variables that are used in the experiment are listed below:
- Experimenter person: To control for effects from the two different actors who executed the experiment that was seen on the video (e.g. effect of sex difference) the roles of actors were rotated over the experimenter and the second participant. The actors each acted as a second participant for 50% of the time and acted as the experimenter the other 50% of the time.
The actors were of comparable age. They were both 21 years old at time of the recording of the experiment. They were of different sex, which made it possible to control for sex related effects in the analyses. Participants were randomly assigned to different orders of tasks, and different actor conditions: Actor one led 44 test sessions. Of these 44 sessions there were 22 sessions in which the typical performance task came first, followed by the maximum performance task. Of these 22 sessions, 12 participants were in the low SE
condition and 10 participants were in the high SE condition. Actor one also led 22 sessions in which the maximum performance task came first followed by the typical performance task. Of these 22 sessions, 12 participants were in the low SE condition and 10 participants were in the high SE condition. Actor two led 42 test sessions. Of these 42 sessions, there were 20 sessions in which the typical
performance task came first followed by the ma ximum performance task. Of these 20 sessions, 8 participants were in the low SE condition and 12 participants were in the high SE condition. Actor two also led 22 sessions in which the maximum performance task came first followed by the typical performance task. Of these 22 sessions there were 12 participants in the low SE condition and 10 participants were in the high SE condition.
Thus, the experimental design controlled for order effects
(typical-maximum vs. (typical-maximum- typical) and for effects resulting from any specific actor characteristics (e.g. sex).
- Background questions were asked to check if the research groups in the different conditions differed significantly on sex, age and study-background (the appendix contains the background questions in Dutch, p. 69; and in English, p. 81).
3. Results 3.1 Reliabilities
The raw scale means, standard deviations, inter rater-reliabilities, correlations, and
internal consistencies for the central research variables are presented in Table 1 (appendix p. 49). A scatter plot on performance scores showed that there were no outliers on the performance scales under typical or maximum conditions. To measure the reliabilities of the scales, we calculated Cronbach’s a. The results are shown in the diagonal of Table 1 (appendix p. 49). Reliabilities are acceptable for the BOS, the content scale, and the impression management (IM) scale in both typical and maximum performance condition (a > .70).
****************** Insert Table 1 here ******************
The inter rater-reliabilities between the uninformed observers on the content scale, BOS, and IM in the two conditions were calculated with Pearson’s r. Inter rater-reliabilities were generally high on the content scale in both the typical condition (r = .98,
n = 84, p < .01) and the maximum condition (r = .98, n = 86, p < .01).
On the BOS, the inter rater-reliability between the two uninformed observers was
r = .91 (n = 84, p < .01) in the typical condition and r = .88 (n = 86, p < .01) in the maximum condition.
The inter rater-reliabilities between the uninformed observers on the IM scale were also acceptable in the typical (r = .95, n = 84, p < .01) and maximum condition (r = .94, n = 86, p < .01).
3.2 Manipulation Checks
The self-efficacy (SE) scale was used to check the manipulation of SE through a false feedback. An independent samples t-test showed that the SE manipulation did not influence the SE scale (t = .23, df = 91, p = .82). This means that the scale showed no significant differences between the low and high SE conditions.
To test the differences between the two performance conditions we used the TMPS: A paired samples t-test showed significant differences between the maximum and the typical condition (t = -3.68, df = 87, p < .01). The mean in the maximum cond ition was 3.41 (SD = .39) and in the typical condition the mean was 3.25 (SD = .50). This indicates that participants perceived the maximum condition as more maximum
performance evoking than the typical condition. There differences between the maximum (M = 3.24, SD = .57) and the typical (M = 2.77, SD = .60) condition were significant on the Evaluation dimension (t = -7.31, df = 87, p < .01). On the Duration dimension, likewise there were significant differences between the maximum and typical condition (t
= -2.24, df = 87, p = .05). In the maximum condition the mean was 4.05 (SD = .70) and the mean in the typical condition was 3.92 (SD = .69). This means that participants felt more evaluated in the maximum condition than in the typical condition and that they were also more aware of the limited time-duration in the maximum condition. Only the Instruction dimension did not show significant differences (t = .99, df = 87, p = .33) between the typical and maximum condition.
3.3 Checking for controls
3.3.1 Experimenter person
We ran a MANOVA to check on experimenter effects between the experimenters on the videos. It did not show any significant effect of experimenter on either measure (content and BOS) of performance (F (1, 81) = .08, p = .78). Additional t-tests showed no
differences between participants’ performance whether explaining to the male or female experimenter on content in the typical condition (t = -.46, df = 84, p = .65) or on content in the maximum condition (t = -.36, df = 83, p = .72). There were also no differences between participants’ performance whether explaining to the male or female
the maximum condition (t = -1.27, df = 83, p = .21). Again there were no differences between participants’ performance whether explaining to experimenters in using IM tactics in the maximum condition (t = 1.03, df = 83, p = .30). Finally, the t-test in the typical condition did show a significant difference between participants’ use of IM tactics, depending on whether they explained to the male or female experimenter (t = -3.34, df = 84, p < .01). Apparently, participants used more IM tactics when having to do the task with the male experimenter (Male; M = 2.68, SD = .65 and Female; M = 2.22, SD
= .65).
3.3.2 Order effects
To see if any order effects appeared, we ran a MANOVA. Participants’ performance differed significant on content when controlled for order. In version 1, participants started performing on content in the typical condition followed by the maximum condition. In version 2, participants started performing on content in the maximum condition followed by the typical condition (F (1, 81) = 12.94, p < .01). An independent t-test showed that participants scored better on the content scale in the maximum condition (M = 3.27, SD = 1.25), when typical performance was assessed first (t = 4.07, df = 84, p < .01).
Participants scored worse on the content scale in the maximum condition (M = 2.06, SD = 1.49), when maximum performance was assessed before typical performance, compared to when maximum performance was assessed after typical performance (t = 1.81, df = 84,
p = .07).
We ran a MANOVA to check if order effects appeared in the BOS. Participants’ scored significant ly different on the BOS controlled for order (F (1, 81) = 7.17, p < .01). An independent t-test showed that the BOS only had significant differences due to order in the maximum condition (t = 2.99, df = 84, p < .01), and not in the typical condition (t = 1.34, df = 84, p = .18). This means that participants scored lower on the BOS in the maximum condition when being assessed first in the maximum condition (M = 2.38, SD = .54), compared to when they started in the typical condition (M = 2.71, SD = .48).
Finally, we ran a MANOVA to check if order effects appeared in the use of IM tactics. The participants’ significantly differed in their use of IM tactics when controlling for order (F (1, 81) = 22.17, p < .01). An independent t-test showed that participants used
significantly more IM tactics in the typical condition (t = 4.16, df = 84, p < .01) when the participants started in the typical condition (M = 2.76, SD = .68) compared to when they started in the maximum condition (M = 2.20, SD = .58). Moreover, the participants used significantly less IM tactics in the maximum condition (t = 3.73, df = 83, p < .01) when they started in the maximum condition (M = 1.92, SD = .45) compared to when they started in the typical condition (M = 2.31, SD = .56). This means that in both conditions participants used significantly more IM tactics when they were first assessed in the typical condition.
3.3.3. Background
Demographics, namely age and sex, did not correlate significantly with most of the studied variables scales, which indicate that there was no need to control for
demographics in the analyses (see Table 1). However the IM scale and gender correlated significant positive in the typical condition (r = .22, n = 86, p < .05). This result indicates that women use more IM tactics than men in the typical condition.
When looking at the correlation of competence and sympathy oriented IM tactics with gender separately, the correlation was only significant between gender and
sympathy oriented IM tactics in the maximum condition (r = .21, n = 89, p < .05). This result shows that women used more sympathy oriented IM tactics than men in the maximum condition.
3.4 Hypotheses
Before testing the hypotheses, we did analyses to test the main and interaction effects. Using a two-way MANOVA, we tested the main effect of the SE condition (low vs. high) and the performance conditions (typical vs. maximum) on content and the BOS. The MANOVA showed a significant main effect of the SE condition (low vs. high) on overall performance (F (1, 80) = 6.92, p = .01). We also found a significant main effect for the performance condition (typical vs. maximum) on overall performance (F (1, 80) = 4.36, p
< .05). This means that the scores on content and the BOS differ between the typical and the maximum condition. The interaction effect between the SE condition (low vs. high) and the performance condition (typical vs. maximum) was marginally significant (F (1,
80) = 3.52, p = .06). Results did not reveal a significant three-way interaction for the SE condition (low vs. high) with performance condition (typical vs. maximum) and the performance on content and the BOS (F (1, 80) = 2.84, p = .10).
The MANOVA also reported a significant two-way interaction for performance rating (content vs. BOS) and the SE condition (low vs. high) (F (1, 80) = 5.56, p < .05). The results did not show a significant two-way interaction for performance condition (typical vs. maximum) and performance rating (content vs. BOS) (F (1, 80) = 0.72, p = .40). These results justify further analyses of the effects.
- Hypothesis 1
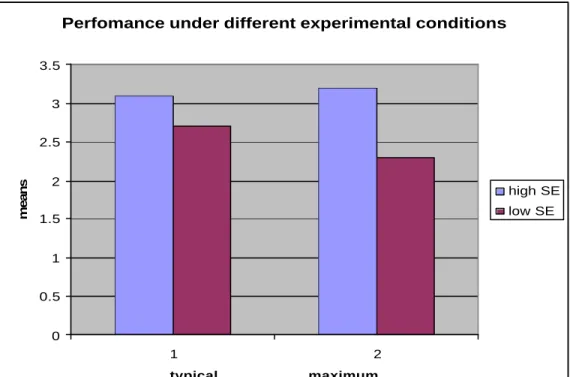
In Hypothesis 1 we assumed that participants with high SE in the task would generally perform better than participants with low SE in the task in both performance conditions. Given the significant interactions in the performance ratings (content and BOS), we carried out a repeated measurement ANOVA’s separately for the content scale and the BOS scale. For content, a significant main effect of SE condition emerged (F (1, 81) = 7.89, p <.05). Additional t-tests sho wed that the differences in performance between participants with low and high SE were significant in the typical condition (t = 2.03, df = 84, p < .05) and significant in the maximum condition (t = 2.85, df = 84, p < .01). The mean in the typical condition was 3.17 (SD = 1.08) for high SE participants and for the low SE participants the mean was 2.73 (SD = .95). In the maximum condition the mean for high SE participants was 3.12 (SD = 1.49) and 2.23 (SD = 1.39) for participants with low SE. Participants with high SE scored better on content than participants with low SE in both the typical and maximum condition (See Figure 2, appendix p. 50).
For the behavioral aspect of the explanation (BOS), there was a marginally significant main effect of the SE condition (F (1, 81) = 3.60, p = .06). A t-test showed that participants in the high SE condition (M = 2.67, SD = .47) scored significantly higher in the maximum condition (t = 2.21, df = 84, p < .05) than participants in the low SE condition (M = 2.42, SD = .56). The difference between participants with low and high SE on BOS in the typical condition was not significant (t = 1.20, df = 84, p = .23) (See Figure 3, appendix p. 50).
Hence, Hypothesis 1 is confirmed in the maximum condition for content and the BOS. In the typical condition Hypothesis 1 could is only confirmed for content and not for the BOS.
********************** Insert Figure 2 and 3 here **********************
- Hypotheses 2
Hypothesis 2 was the expectation that the maximum and typical condition would interact with participants’ SE. A repeated measurement ANOVA’s showed a significant
interaction effect of the SE condition and performance condition on the content measure (F (1, 81) = 3.88, p = .05) and a marginally significant interaction effect of the SE condition and performance on the BOS (F (1, 81) = 3.60, p = .06). Given these results, t -tests were performed to test Hypothesis 2 in more specific detail.
- Hypothesis 2A
More specifically in Hypothesis 2A, we stated that participants with high SE in the task would perform better in the maximum condition than in the typical condition. T-test revealed that high SE participants did not perform better in the maximum condition than in the typical condition on either content (t = -.13, df = 38, p = .90) or BOS (t = .84, df = 38, p = .41). Hence, Hypothesis 2A was not confirmed for content and BOS.
- Hypothesis 2B
In Hypothesis 2B, we expected that participants with low SE in the task would perform worse in the maximum condition than in the typ ical condition. Additional t-tests showed that participants with low SE scored significantly lower on content (t = 2.66, df = 42, p < .05) in the maximum condition (M = 2.23, SD = 1.39) than in the typical condition (M =
2.73, SD = .95) (See Figure 2, appendix p. 50).
When looking at the BOS, additional t-tests showed that participants with low SE scored significantly lower (t = 2.67, df = 42, p < .05) in the maximum condition (M =
2.42, SD = .56) than in typical conditions (M = 2.63, SD = .57). Therefore, Hypothesis 2B is confirmed for content and BOS (See Figure 3, appendix p. 50).
********************** Insert Figure 2 and 3 here **********************
- Hypothesis 3
Hypothesis 3 assumed that when introducing SE as a second predictor of typical performance, after the first predictor maximum performance, the prediction of typical performance would improve. To test the predictive value of the SE condition on the dependent variable typical performance after accounting for the effect of maximum performance, we carried out a multiple regression analyses. These analyses showed that the prediction of typical performance by maximum performance did not improve after introducing SE condition as a second predictor. This effect was found using content as performance measure. Using the enter method, a non-significant model emerged (F (2, 79) = 1.33, p = .27). The variables are shown in Table 3 including the predictor variable “Knowledge at time of experiment”.
When we looked at BOS as the performance measure, the SE condition likewise did not predict typical performance significantly (F (1, 80) = 0.31, p = .58) (See Table 2, appendix p. 51). Hence, Hypothesis 3 was not confirmed for the content measure and the BOS. This means that the prediction of typical performance did not improve after the introduction of SE as a second predictor.
******************** Insert Table 2 here ********************
3.5 Hypotheses including IM tactics
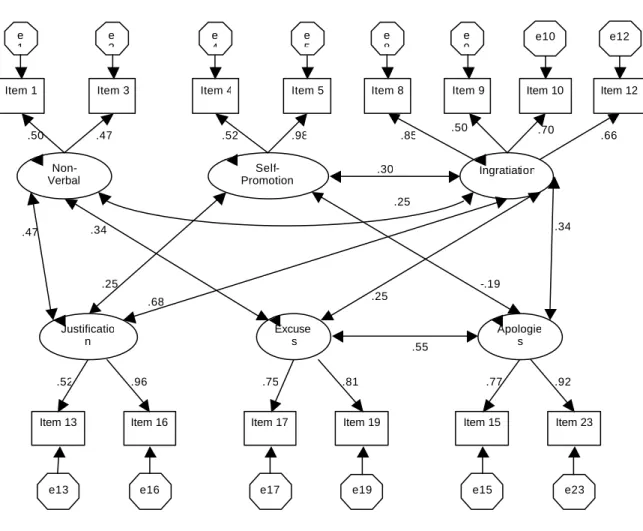
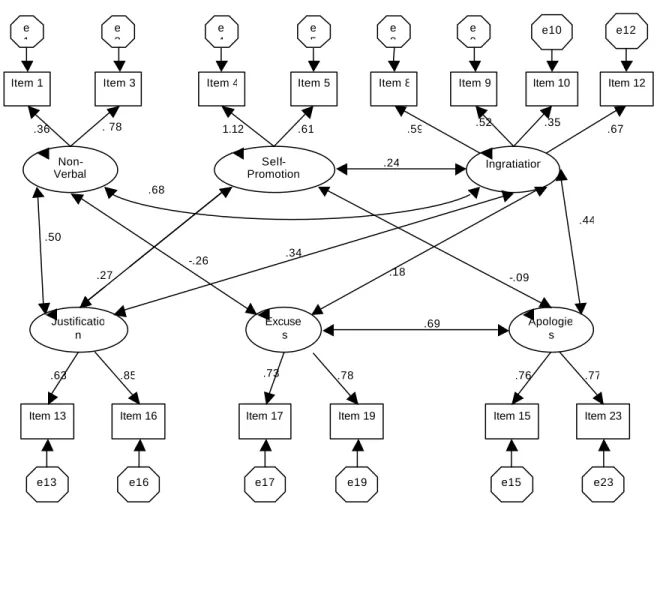
Confirmatory factor analysis on the observed IM tactics using AMOS 5.0 (Arbuckle, 2003), suggested the accuracy of a six factor solution. Originally a seven- factor solution was proposed. After using AMOS, we left out the factor “Overcoming Obstacles” of further analyses. This factor did not fit into an appropriate factor solution. “Overcoming
Obstacles” led to inflated Chi-square estimates and poor indicators of fit with the IM scale. In Figure 4 (appendix p. 52), the factors with the accessory items are shown for the typical condition and in Figure 5 (appendix p. 53) for the maximum condition. In Table 3 (appendix p. 53) the Goodness of Fit Indices calculated with AMOS, are shown. The fit-indices indicated a good fit of both the model for typical and the model for the maximum condition, to the data with the GFI indicator close to .90, and the TLI and CFI indicators surpassing .90. The AFGI indicator surpassed .80 which is acceptable. Also the 90% confidence interval of the RMSEA was acceptable, being .10.
********************* Insert Figure 4 and 5 here ********************* *********************
Insert Table 3 here *********************
The fit presented here was the best solution to be used for both the typical and maximum condition. In Table 4 (appendix p. 54) the raw scale means, standard
deviations, and correlations for the IM scale in the typical and maximum condition are presented.
********************* Insert Table 4 here *********************
- Hypothesis 4
In Hypothesis 4 we assumed that participants who performed better would use more IM tactics. Correlating participants’ performance on the content and the BOS with overall use of IM tactics did not show significant results. This was the case in both the typical condition and the maximum condition, for content and BOS (See Table 1, appendix p. 49). This indicates that performance (on content and BOS) and the use of IM tactics did not correlate in this research. Hence, Hypothesis 4 was not confirmed.
However, when looking at the correlations of the different IM tactics separately with performance on content, these did show significant results (Table 5, appendix p. 55).
********************* Insert Table 5 here *********************
The competence oriented IM tactics (Self-promotion and Justification), correlated significantly positive with performance on content in both the typical (Self-promotion; r
= .31, n = 85, p < .01, Justification; r = .35, n = 85, p < .01) and the maximum condition (Self-promotion; r = .42, n = 86, p < .01, Justification; r = .39, n = 86, p < .01).
Evidently, the better the performance on the content, the more use of competence oriented IM tactics or vise versa. Another striking result was the significant negative correlation of Apologies with performance on content in the typical (r = -.35, n = 85, p < .01) and the maximum condition (r = -.41, n = 86, p < .01). This indicates that when performing well on the content, participants used less Apologies as IM tactics, or vise versa. For Excuses this was only the case in the maximum condition (r = -.24, n = 86, p < .05). Finally, Non-Verbal IM tactics correlated significantly with performance on the content in the maximum condition (r = .27, n = 86, p < .05).
Also, when we looked at the correlations of the different IM tactics separately with performance on the BOS, we found significant results (Table 6, appendix p. 55).
********************* Insert Table 6 here *********************
The correlation between the BOS and the competence oriented IM tactics was significant in the typical condition for both Self-promotion (r =.50, n = 86, p < .01) and for
Justification (r =.35, n = 86, p < .01). This means that participants, when not being evaluated, used more competence based IM tactics when showing more observable behavior or vice versa. In the maximum condition the BOS only correlated significant with Self-promotion (r =.30, n = 86, p < .01).
When we looked at the sympathy oriented IM tactics, the only IM tactic that correlated significantly with the BOS in the typical condition was Ingratiation (r =.24, n
= 83, p < .05). This indicates that in the condition without evaluation, participants used more Ingratiation when they showed more observable behavior, or vice versa. The other two sympathy oriented IM tactics, Apologies and Excuses, correlated significantly
negative in both the typical (Apologies; r = -.39 n = 86, p < .01, and Excuses; (r = -.24, n
= 86, p < .05) and maximum (Apologies; r = -.49 n = 86, p < .01, and Excuses; (r = -.27,
n = 86, p < .05) condition. This striking result means that when using these two sympathy oriented IM tactics, participants showed less observable behavior, or vice versa.
The Non Verbal IM tactic only correlated significant with the BOS in the
maximum condition (r =.23, n = 86, p < .05). When being evaluated, participants showed more observable behavior and used more Non Verbal IM tactics, or vice versa.
- Hypothesis 5
To test Hypothesis 5, the expectation that participants use more IM tactics in the
maximum condition than in the typical condition, a repeated measurement ANOVA was done. Results show that in contrast to the hypothesis, participants used significant more IM tactics in the typical condition than in the maximum condition (F (1, 81) = 25.89, p <
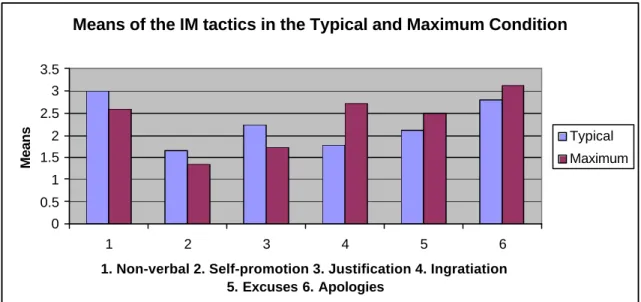
.01). Hence, Hypothesis 5 was no t confirmed (See Figure 6 for means of the different IM tactics in both performance conditions, appendix p. 56).
********************* Insert Figure 6 here *********************
- Hypothesis 6
A repeated measurement ANOVA was also done to test Hypothesis 6, which assumed that participants in the maximum condition used the competence oriented IM tactics (Self-promotion and Justification) more than the sympathy oriented IM tactics. Competency oriented IM tactics differed significantly between the two performance conditions (F (1, 82) = 23.37, p < .01). Contrary to Hypothesis 6, participants used the competence oriented IM tactics significantly more in the typical condition than in the maximum condition. This difference was also significant when looking at the competence oriented IM tactics separately (Self-promotion; (F (1, 81) = 12.58, p < .01), Justification; (F (1, 81) = 13.81, p < .01). Therefore Hypothesis 6 was notconfirmed.
- Hypothesis 7
Another repeated measurement ANOVA tested whether participants in the typical condition used the sympathy oriented IM tactics (Ingratiation, Excuses and Apologies) more than the competence oriented IM tactics (Hypothesis 7). The use of sympathy oriented IM tactics differed significantly between the two performance conditions (F (1, 88) = 43.51, p < .01). Contrary to Hypothesis 7, participants used the sympathy oriented IM tactics significantly more in the maximum condition than in the typical condition. All three sympathy oriented IM tactics (Ingratiation; (F (1, 81) = 62.22, p < .01), Excuses; (F
(1, 81) = 4.46, p < .05), Apologies; (F (1, 81) = 3.15, p = .08), were significantly used more in the maximum condition than in the typical condition. Therefore Hypothesis 7 was not confirmed.
- Hypothesis 8
A t-test did not confirm that participants with a high SE in the task used more assertive IM tactics than defensive IM tactics in the two performance conditions (Hypothesis 8). In the typical condition (t = -2.95, df = 41, p < .01) the high SE participants actually used significantly more defensive IM tactics (M = 2.28, SD = .88) than assertive IM tactics (M = 1.80, SD = .76). Likewise, in the maximum condition (t = -3.15, df = 40, p < .01) the high SE participants used the defensive IM tactics (M = 2.49, SD = .86) significantly more often than the assertive IM tactics (M = 1.97, SD = .71). Hence, results show a significant difference in the opposite direction than expected. Hypothesis 8 is not confirmed.
- Hypothesis 9
Hypothesis 9 assumed that participants with low SE in the task used more defensive IM tactics than assertive IM tactics in the typical and maximum condition. We tested the hypothesis using a t-test. Participants with low SE in the task used significantly more (t = -6.16, df = 43, p < .01) defensive IM tactics (M = 2.48, SD = 86) than assertive IM tactics (M = 1.65, SD = .60) in the typical condition. In the maximum condition the low SE participants used significantly more (t = -2.45, df = 44, p < .05) defensive IM tactics (M =
participants in both SE conditions used the defensive IM tactics significantly more often. Therefore Hypothesis 9 was confirmed.
4. Discussion
Results of this research replicate findings of earlier researchers (Sackett, Zedeck & Fogli, 1988; DuBois, Sackett, Zedeck & Fogli, 1993; Klehe & Anderson, 2004b) in proving that the distinction between typical and maximum performance is real and should be included and studied in current models of job performance. Participants felt more evaluated in the maximum condition than in the typical condition and were also more aware of the limited time-duration in the maximum condition. This is important because empirical studies on this topic are very scarce so every replication should still be acknowledged.
On the other hand, this research contradicts Sackett et al.’s (1988) propositions and DuBois et al.’s (1993) findings in showing that performance is not per se as high as possible in maximum conditions. In contrast, this research shows that performance can be much lower in maximum conditions for participants with low self-efficacy (SE).
Moreover participants with high SE did not perform better in the maximum condition than in the typical condition. Together, these findings raise considerable doubt regarding the accuracy of Sackett et al.’s (1988) assertion of the reduced role of motivation during maximum performance. One can conclude that maximum performance is not just a function of ability, because in this research the motivational variable SE appeared a predictor of performance also in the maximum condition. Besides, SE distinguished performance in the maximum condition even better than in the typical condition.
Klehe and Anderson (in press) confirmed Sackett et al.’s (1988) model and proposition that motivation will rise during maximum performance. Their findings confirmed that the correlation between motivation and performance diminishes, while the correlation between ability and performance increases in the maximum condition. Given the contrary results found in this research, an avenue for future research could be the search for the relevant difference between studies accounting for such different results. For example, one could argue that Klehe and Anderson’s (in press) results are primarily a function of the task being rather repetitive and of low intrinsic interest to performers. The
task used in this research was important for the participants for both intrinsic and extrinsic reasons. The task was related to the course called Introductory Psychology. Participants who have decided to study psychology as a profession, are likely to be intrinsic motivated to take their performance on the content of this course seriously. An extrinsic motivation for participants in this research is that first year psychology students are obligated to participate in multiple experiments to pass their first year. Additionally, an adequate performance on the content of this course is crucial to students’ financial funding and future studies. The fact that about 50% of the students each year fail the Introductory Psychology course further indicates that it presents a relatively difficult task to students. Task-difficulty, as mentioned earlier, has been linked to the phenomenon of social inhibition.
This research also replicates Sanna’s (1992) findings in showing that participants with high SE performed better than participants with low SE. Besides, this research extends Sanna’s (1992) findings in showing that results obtained in the social facilitation and social inhibition literature equally hold true for typical and maximum performance. That is, participants with low SE performed worse in the maximum condition than in the typical condition. Apparently, SE interacts with typical and maximum condition and hence influences performance. This means that expectation of evaluation, in the
maximum condition, diminishes performance on tasks in which individuals have low SE in accomplishing.
In accordance with Hypothesis 2,our expectation was met when looking at the different performance on content between participants with high- and low SE. For the BOS, this only held true in the maximum condition. In the typical condition no
significant difference was found between participants with high and low SE. Apparently the lack of evaluation in the typical condition did not cause the participants with low SE to act differently than the participants with high SE. An explanation could be that
evaluation causes nervous behaviors, especially regarding participants with low SE. Since evaluation was not present in the typical condition, the difference in performed nervous behaviors between participants with high and low SE could have been smaller. Future research could take a look at this.