Flexible Web Visualization for
Alert-Based Network Security Analytics
Lihua Hao
Department of Computer Science North Carolina State University
Christopher G. Healey
Department of Computer ScienceNorth Carolina State University [email protected]
Steve E. Hutchinson
Adelphi Research Center U.S. Army Research LaboratoryABSTRACT
This paper describes a web-based visualization system de-signed for network security analysts at the U.S. Army Re-search Laboratory (ARL). Our goal is to provide visual sup-port to the analysts as they investigate security alerts for malicious activity within their systems. Our ARL collab-orators identified a number of important requirements for any candidate visualization system. These relate to the an-alyst’s mental models and working environment, and to the visualization tool’s configurability, accessibility, scalability, and “fit” with existing analysis strategies. To meet these requirements, we designed and implement a web-based tool that uses different types of charts as its core representation framework. A JavaScript charting library (RGraph) was extended to provide the interface flexibility and correlation capabilities needed to support analysts as they explore dif-ferent hypotheses about a potential attack. We describe key elements of our design, explain how an analyst’s intent is used to generate different visualizations, and show how the system’s interface allows an analyst to rapidly produce a se-quence of visualizations to explore specific details about a potential attack as they arise. We conclude with a discus-sion of plans to further improve the system, and to collect feedback from our ARL colleagues on its strengths and lim-itations in real-world analysis scenarios.
Categories and Subject Descriptors
[Security and Privacy]: Network security; [Human Cen-tered Computing]: Visualization—visualization applica-tion domains, visualizaapplica-tion systems and tools
General Terms
Design, Security
1.
INTRODUCTION
This paper describes a collaboration between visualization researchers at North Carolina State University (NCSU) and
(c) 2013 Association for Computing Machinery. ACM acknowledges that this contribution was authored or co-authored by an employee, contractor or affiliate of the national government of United States. As such, the Gov-ernment retains a nonexclusive, royalty-free right to publish or reproduce this article, or to allow others to do so, for Government purposes only.
VizSec ’13October 14, 2013, Atlanta, GA, USA Copyright 2013 ACM 978-1-4503-2173-0/13/10 ...$15.00.
network security analysts at the U.S. Army Research Lab-oratory (ARL). We are designing a prototype visualization system to improve an analyst’s efficiency and effectiveness when exploring potential network security incidents.
Discussions with a wide range of security analysts led to an interesting conclusion. The analysts overwhelming agreed that, intuitively, visualizations should be very useful. In practice, however, they had rarely realized significant im-provements by integrating visualizations into their workflow. A common comment was: “Researchers come to us and say, Here’s a visualization tool, let’s fit your problem to this tool. But what we need is a tool built to fit our problem.” This is not unique to the security domain, but it suggests that security analysts may be more sensitive to deviations from their current analysis strategies, and therefore less receptive to general-purpose visualization tools and techniques.
This is not to say, however, that visualization researchers should simply provide what the security analysts ask for. Our analysts have high-level suggestions about how they would like to visualize their data, but they do not have the visualization experience or expertise to design and evaluate specific solutions to meet their needs. To address these, we initiated a collaboration between the two groups to build visualizations that: (1) meet the needs of the analysts, but also (2) harness the knowledge and best practices that exist in the visualization community.
Again, this approach is not unique, but it offers an oppor-tunity to study its strengths and weaknesses in the context of our network security domain. In particular, we were curi-ous to see which general techniques (if any) we could begin with, and how significantly these techniques needed to be modified before they would be used by our analysts. Seen this way, our approach does not focus explicitly on network security data, but rather on network security analysts. By supporting the analysts’ needs, we are implicitly addressing a goal of effectively visualizing their data.
Based on our discussions with ARL personnel, we defined an initial set of requirements for a successful visualization tool. Interestingly, these do not inform explicit design deci-sions, for example, they do not define which data attributes we should visualize and how those attributes should be rep-resented. Instead, they implicitly constrain a visualization’s design through a high-level set of suggestions about what a real analyst is (and is not) likely to use. We summarized these comments into six general categories:
• Mental Models. A visualization must “fit” the men-tal models the analysts use to investigate problems. Analysts are unlikely to change how they attack a
by the alerts they are currently investigating.
• Accessibility. The visualizations should be familiar to an analyst. Complex representations with a steep learning curve are unlikely to be used, except in very specific situations where a significant cost–benefit ad-vantage can be found.
• Scalability. The visualizations must support query and retrieval from multiple data sources, each of which may contain very large numbers of records.
• Integration. Analysts will not replace their current problem-solving strategies with new visualization tools. Instead, the visualizations must augment these strate-gies with useful support.
The analysts’ requirements meant that we could not fol-low our normal strategy of defining the analysts’ data and tasks, designing a visualization to best represent this data, then modifying the design based on analyst feedback. Work-ing environment, accessibility, and integration constraints, as well as comments from colleagues at ARL, suggested that a novel visualization with unfamiliar visual representations would not be appropriate. Since no existing tools satisfied all of the analysts’ needs, we decided to design a frame-work of basic, familiar visualizations—charts—that runs in the analysts’ web-based environment. We applied a series of modifications to this framework to meet each of the ana-lysts’ requirements. Viewed in isolation, each improvement often seemed moderate in scope. However, we felt, and our colleagues agreed, that the modifications were the difference between our system possibly being used by the analysts ver-sus never being used. In the end, the modifications afforded a surprising level of expressiveness and flexibility, suggest-ing that some parts of our design could be useful outside the network security domain.
2.
BACKGROUND
Visualization has been proposed as an important com-ponent of network security analytics [2, 13, 20]. It allows for interactive exploration and analysis of large amounts of data, and can help analysts detect unexpected patterns more efficiently and effectively than traditional, text-based repre-sentations.
Standard visualization techniques have been customized to support visual analysis of network security data. Node– link graphs [11, 14] are widely employed to display commu-nications in a network. Picviz [16] uses parallel coordinates to present relationships between multiple data dimensions like IP, port, packet number, TTL, and time. Treemaps [20] have been used to visualize hierarchical structures in net-work data, for example, in the NFlowVis system proposed by Fischer et al. [3]. Scatterplots in PortVis and NVisionIP [8, 10] highlight correlations between data dimensions. Phan
views must deal with issues of interaction, item comparison and occlusion [9, 13].
Effective security analysis normally requires integration of various data sources, often starting from an overview of the data, with additional details provided on demand. Se-curity visualization systems support different visualization techniques and multiple representations to allow analysis at different scales and from different perspectives. NVisonIP [8] provides visualizations at three levels of detail: galaxy, small multiple, and machine views. Similarly, VisFlowCon-nect [19] supports global, domain, internal, and host statis-tics views. Commercial security visualization systems such as VIAssist [5], Code DX [1] and NDVis [18] combine tools to support the analysis of different types of security data, and to integrate the analytic roles of the tools. They employ traditional visualization techniques like charts and node–link graphs with flexible zooming and data filtering.
Although these security visualization systems aim to sup-port more flexible user interactivity and to correlate various data sources, many of them still force an analyst to choose from a fairly limited set of static representations. For ex-ample, Phan et al. uses charts, but with fixed attributes on thexandy-axes. General purpose visualization systems like Tableau or ArcSight offer charts similar to ours. These systems do not include visualization and human perception guidelines, however, so representing data effectively requires visualization expertise on the part of the analyst. Finally, many systems lack a scalable data management architecture [9]. This means an entire dataset must be loaded into mem-ory prior to filtering and projection, increasing data transfer cost and limiting dataset size.
3.
DESIGN
The configurability, accessibility, scalability, and integra-tion requirements of our design demand flexible user in-teraction that combines and visualizes multiple large data sources. The working environment requirement further dic-tates that this happen within the analyst’s current work-flow. To achieve this, our system combines MySQL, PHP, HTML5, and JavaScript to produce a web-based network security visualization system that uses combinations of user-configurable charts to analyze suspicious network activity.
3.1
Data Management
To provide improved scalability, data management occurs on a remote server running MySQL and PHP. This is a com-mon approach to provide efficient data filtering and projec-tion. Although a SQL server does not guarantee better per-formance or unlimited scalability, proper database and query construction do provide significant improvements over file-based data management, especially in web applications. Our SQL databases can support gigabytes of data. We maintain configurability in the visualizations by making no assump-tions about the types of data in the database. The analyst
(a)
(b)
Figure 1: Database, table, and attribute selection
chooses the database tables and data attributes to visualize, which sets the necessary constraints for table correlation and data filtering (Fig. 1).
Our system loads only the data we need to render a given query’s results. If the analyst later requests additional at-tributes, the system automatically generates queries to re-trieve the new data. Another important accessibility re-quirement is that analysts do not need to construct SQL queries. Based on the tables, constraints and attributes in-volved in an analysis, and the use case of the visualization, the system will dynamically construct SQL queries to ex-tract correlated information from the database.
3.2
Web-Based Visualization
Based on our integration requirement, we implement our visualizations as a web application using HTML5’s canvas element. This works well, since it requires no external plug-ins and runs in any modern web browser.
We visualize network data using 2D charts. Basic charts are one of the most well known and widely used visualization techniques. This supports our accessibility requirement, be-cause: (1) charts are common in other security visualization systems our analysts have seen, and (2) charts are an effec-tive visualization method for presenting the values, trends, patterns, and relationships our analysts want to explore.
Numerous JavaScript-based libraries exist to visualize data as 2D charts, for example, HighCharts, Google Charts, Flot Charts, and RGraph. Unfortunately, these libraries are de-signed for general information visualization, so they do not support analysis at multiple levels of abstraction or correla-tion between multiple charts. To address this, we extended RGraph [7] to generate security visualizations with flexible user interaction, data retrieval via MySQL, and the ability to correlate between multiple charts.
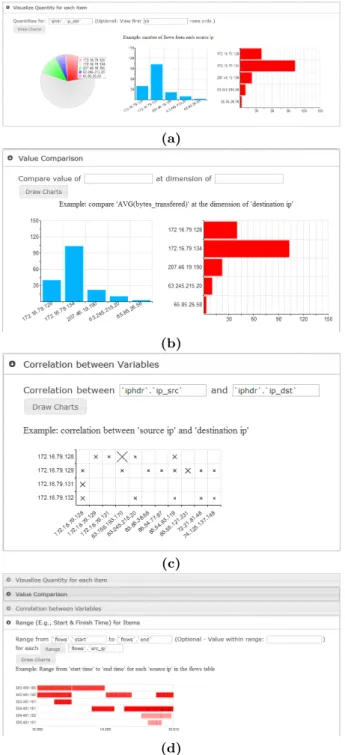
RGraph cannot automatically choose chart types based on the data to visualize. This capability might be useful, since analysts do not want to manually select the chart type if this decision is obvious. On the other hand, the analysts do not want to be restricted to specific, pre-defined visual-izations. To support these conflicting needs, we classify our charts based on the different use cases in Fig. 2: (1) pie and bar charts for proportion and frequency comparison over a single attribute, (2) bar charts for value comparison over a secondary attribute, (3) scatterplots for correlation between two attributes, and (4) Gantt charts for range value
compar-(a)
(b)
(c)
(d)
Figure 2: Charts classified by use case: (a) pie and bar chart, analysis of proportion; (b) bar chart, value com-parison along one dimension; (c) scatterplot, correlation analysis; (d) Gantt chart, range in at least one dimension
isons. In our system a visualization is created based on anal-ysis goals, and not on the specific data being visualized. The analyst is free to change this initial selection, and more im-portantly, to interactively manipulate which data attributes are mapped to the primary and secondary dimensions.
Once a request is finalized, the system: (1) generates SQL queries to extract the target data from the database, (2) initializes chart properties like background grids and glyph size, color, and type, and (3) visualizes the data.
flows by source IP
3.3
Analyst-Driven Charts
In a general information visualization tool, the viewer nor-mally defines exactly the visualization they want. In our vi-sualization system, we automatically choose an initial chart type based on: (1) existing knowledge on the strengths, lim-itations, and uses of different types of charts, and (2) the data the analyst asks to visualize. For example, if the an-alyst asks to see the distribution of a single data attribute, the system recommends a pie chart or bar chart. If the an-alyst asks to see the relationship across two data attributes, the system recommends a scatterplot or a Gantt chart.
The axes of the charts are initialized based on properties of the data attributes, for example, a categorical attribute on a bar chart’sx-axis and an aggregated count on they -axis. If two attributes like source and destination IP are selected, the attributes are mapped to a scatterplot’sxand
y-axes, with data points shown for flows between pairs of values (Fig. 2d). Or, if the attributes were event timestamp and destination IP, time would be assigned to thex-axis and destination IP to they-axis of a scatterplot (Fig. 3a). Vi-sualizing start and end times for flows across destination IP produces a Gantt chart with time on thex-axis, destination IP on they-axis, and rectangular range glyphs representing different flows (Fig. 3b).
Data elements sharing the samexandyvalues are grouped together and displayed as a count. For example, in a scat-terplot of traffic between source and destination IPs, the size of each tick mark indicates the number of connections be-tween two addresses. In a Gantt chart, the opacity of each range bar indicates the number of flows that occurred over the time range for a particular destination IP.
More importantly, the analyst is free to change any of these initial choices. The system will interpret their modi-fications similar to the processing we perform for automat-ically chosen attributes. This allows the analyst to auto-matically start with the most appropriate chart type (pie, bar, scatterplot, or Gantt) based on their analysis task, the properties of the attributes they assign to a chart’s axes, and on any secondary information they ask to visualize at each data point.
3.4
Interactive Visualization
To realize analyst-driven charts, we implemented a user interface with event handling on the canvas element and the jQueryUI JavaScript library for higher-level UI widgets and operations. Our design allows for full control over the data attributes to assign to a chart’s axes. This capability turns out to be fairly expressive, and can be used by an analyst to generate an interesting range of charts and chart
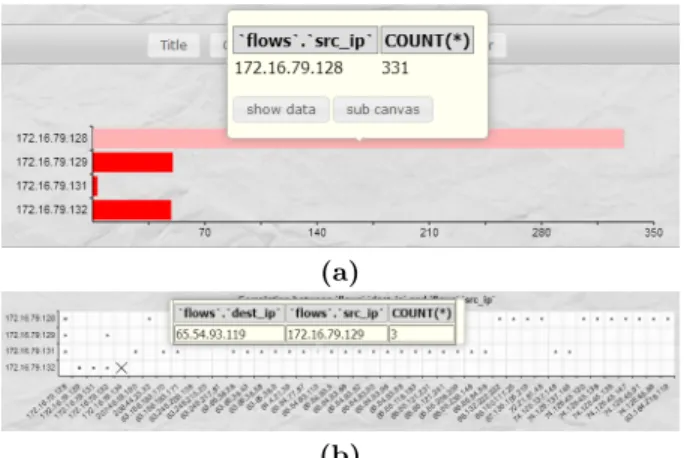
(b)
Figure 4: Tooltips: (a) for bar charts; (b) for scatterplots
Figure 5: Default zooming in RGraph
types. Analysts can also attach additional data attributes to control the appearance of the glyphs representing data elements within a chart. For example, a glyph’s color, size, and shape can all be used to visualize secondary attribute values.
3.4.1
Tooltips
Tooltips define data-drive notes attached to elements in a chart. For example, we commonly use tooltips to display the exact attribute values encoded in a chart element (Fig. 4), providing access to quantitative data on demand.
3.4.2
Zooming
RGraph’s default zooming is not powerful enough to sup-port level-of-detail visualization. RGraph zooms an area of a chart by simply increasing the size of a pselected re-gion (Fig. 5). For an area in a chart with numerous data elements, this type of zooming does not provide any addi-tional information to allow a deeper understanding of the sub-region of the chart.
To solve this, we rewrote RGraph’s zooming function for scatterplots and Gantt charts. When an analyst selects an area in the original chart, we redraw the chart to include only the selected elements. For example, Fig. 6a shows a scatterplot created by an analyst, where the size of each tick mark encodes the number of flows for a corresponding source and destination IP (plotted on the chart’sxand y -axes). Fig. 6b is the result of zooming in on the sub-region selected in Fig. 6a. In the original scatterplot the differ-ence between the flow counts for the selected region cannot be easily distinguished. After zooming, the size of the tick marks are re-scaled for the currently visible elements, high-lighting differences in the number of flows, particularly for destination IP 172.16.79.132 in the bottom row. The same type of zooming can be applied to Gantt charts (Fig. 6c, d). After zooming into a selected area, the flows that occlude
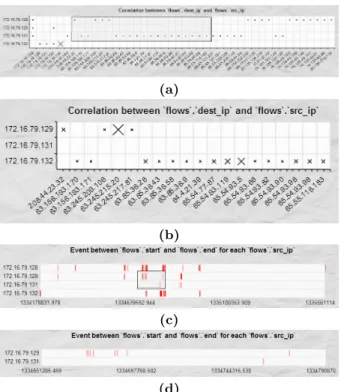
(a)
(b)
(c)
(d)
Figure 6: Chart zooming: (a) original scatterplot with zoom region selected; (b) zoom result; (c) original Gantt chart with zoom region selected; (d) zoom result
one another in the original chart are separated, helping the analyst differentiate timestamps.
3.4.3
Toolbars
Option toolbars at the top of each chart allow the analyst to customize glyph size, color, and shape, as well as other properties like title and size. Toolbars for scatterplots and Gantt charts also offer zooming, as well as the display or creation of correlated charts and spreadsheets of the raw data in the chart. Fig. 7 illustrates the use of a toolbar to change the shape of tick marks in a scatterplot.
3.5
Correlation Over Multiple Views
Our analysts normally conduct a sequence of investiga-tions, pursuing new findings as they are uncovered by corre-lating multiple data sources and exploring the data at mul-tiple levels of detail. This necessitates visualizations with multiple views and flexible user interaction. In our system, we correlate multiple data sources by generating correlated SQL queries and extending the RGraph library to support dependencies between different charts.
As an analyst examines a chart, they will form new hy-pothesis about the cause or effect of activity in the network. Correlated charts allow the analyst to immediate generate new visualizations from the current view to explore these hypotheses. In this way, the system allows an analyst to conduct a series of analysis steps, each one building on pre-vious findings, with new visualizations being generated on demand to support the current investigations.
3.5.1
Correlated Charts
Similar to zooming, analysts can create correlated charts for regions of interest by selecting the region and requesting a sub-canvas. The system generates a constraint to extract
(a)
(b)
Figure 7: Toolbar-based tickmark shape selection: (a) cross; (b) circle
Figure 8: New constraints to create a correlated chart
Figure 9: Pie chart with a raw data spreadsheet
the data of interest in a separate window. The analyst can then select new attributes to include or new tables and con-straints to add to the new chart (Fig. 8).
3.5.2
Raw Data Spreadsheets
Text-based examination is a conventional approach widely used in security analysis. In our system, we allow users to retrieve the raw data attached to a selected visual element
An important requirement for testing our system is to ap-ply it to real-world data. For security reasons, it is not pos-sible to use data from ARL during testing. Because of this, we built a trap server to capture anonymized network flows from network switches housed on one floor of our Computer Science building.
The trap server collects network traffic by enabling the span ports on the network switches. Network data are sent to a separate switch dedicated to data collection. The collec-tion switch transmits the data to a Snort sensor to perform: (1) intrusion detection using a Snort ruleset distributed by SourceFire and customized by our network security research group, and (2) extraction of network packets. Personal iden-tification information is either anonymized or removed at this stage, with the original IP addresses and packet pay-loads being maintained (e.g., an IP address involved in an intrusion alert). This remaining information is further ob-fuscated in a consistent manner prior to being visualized.
The trap server stores two types of data representing net-flow data and Snort alerts. Net net-flows contain source and destination IP, port, start and end time, TCP flags, and packet information. Alerts contain source and destination IP, port, time of the alert, and alert type. A flow and (possibly multiple) alerts are correlated when they share the same source and destination, and when the alerts occur be-tween the flow’s start and end time. This produces fairly large datasets with real-world traffic patterns. An example file for 24 hours of data contained approximately 17.4GB of packet headers with 938K unique source IPs and 168K unique destination IPs, representing 1.6M flows containing 615K alerts.
5.
EXAMPLE ANALYSIS SESSION
To demonstrate our system, we obtained trap data being used by network security colleagues at NCSU to act as in-put for their automated intrusion detection algorithms. This provided us with a real-world dataset, and also offers the possibility of comparing results from an automated system to a human analyst’s performance, both with and without visualization support. One of our NCSU colleagues served as the analyst in this example scenario. Visualization starts at an abstract level (distribution of alerts at different destina-tion IP addresses), then follows the analyst’s exploradestina-tions of different hypotheses as he highlights and zooms into subre-gions of interest, creates correlated charts to drill down and analyze data at a more detailed level (visual analysis for alerts to a specific destination IP), and imports additional supporting data into the visualization (port and source IP). By including a new database flow table, the analysis of a subset of interest is extended to a larger set of data sources (analysis of flows related to interesting alerts). The visual-ization system supports the analyst by generating different types of charts on demand, based on the analyst’s current interest and needs. The analyst can view the data both
• iphdr. Source and destination IP and other informa-tion related to packet headers.
• tcphdr. TCP related information such as source and destination port.
The analyst begins by selecting the database and the ta-bles to use for the first visualization, as well as the con-straints needed to correlate the tables and filter the rows to explore. Based on these tables and constraints, the analyst can choose the types of analysis he wants to pursue and the data attributes to visualize. The analyst initially chooses to visualize the number of alerts for each destination IP, select-ingip dst from tableiphdr as the “aggregate for” attribute. A SQL query is automatically generated to extract data for the chart:
1 SELECT iphdr.ip_dst, COUNT(*) 2 FROM event, iphdr, tcphdr 3 WHERE event.sid = iphdr.sid 4 AND event.cid = iphdr.cid 5 AND event.sid = tcphdr.sid 6 AND event.cid = tcphdr.cid 7 GROUP BY iphdr.ip_dst
8 ORDER BY COUNT(*) DESC
Choosing “Draw Charts” displays the aggregated results as pie and bar charts (Fig. 10). This supports visual analysis of the data from different perspectives. Pie charts highlight the relative number of alerts for different destination IPs, while bar charts facilitate a more effective comparison of the absolute number of alerts by destination IP. The charts are linked: highlighting at a bar in the bar chart will highlight the corresponding section in the pie chart, and vice-versa.
By default, we sort the aggregation results by the number of alerts for different destination IPs in reverse order, and allow the analysts to choose to visualize the first few rows. This is based on the assumption that analysts are more in-terested in addresses where a significant amount of traffic or number of alerts occurs. The analysts can reverse the sort order if they want to search for low-occurrence alerts.
The pie and bar charts indicate that the majority of the alerts (910) happen for destination IP 172.16.79.134. Choos-ing “Show Data” displays all 910 rows as a spreadsheet in a new window. To further analyze alerts associated with this destination IP, the analyst chooses “Sub Canvas” to open a new window with the initial query information (the database, tables, and constraints) predefined. The constraint
iphdr.ip dst = 172.16.79.134 is added to restrict the query for further analysis over this target destination IP. The an-alyst can continue to add new constraints or tables to the query as he requests visualizations to continue his analysis. Next, the analyst chooses to visualize alerts from different source IPs attached to the target destination IP. He uses destination port to analyze the correlation between source and destination through the use of a scatterplot. Fig. 11a shows there is only one source IP with alerts related to the
Figure 10: Aggregated results visualized as a pie chart and horizontal and vertical bar charts
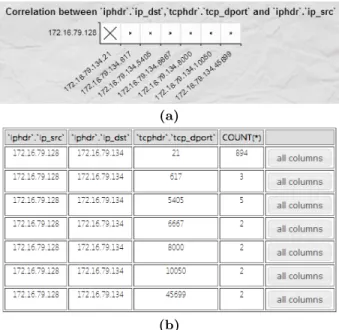
(a)
(b)
Figure 11: Detail analysis: (a) scatterplot of relation-ships between source IP and destination port correlated to destination IP 172.16.79.134; (b) raw data spreadsheet
target destination IP, and that most alerts are sent to port 21, shown in the spreadsheet in Fig. 11b.
The analyst looks more closely at traffic related to the target destination IP on port 21 by visualizing netflows and their associated alerts in a Gantt chart. Collections of over-lapping flows are drawn in red with endpoints at the flow set’s start and end times. Alerts appear as black vertical bars overlaid on top of the flows at the time the alert was detected. Fig. 12a shows most of the flows are distributed over two time ranges. By zooming in on each flow separately
(a)
(b)
(c)
Figure 12: Gantt chart with alerts for network flows at the destination IP and port of interest; (a) two flows; (b) zoom on the left flow, showing numerous alerts; (c) zoom on the right flow, showing one alert
(Fig. 12b, c), the analyst realizes that the vast majority of the alerts occur in the left flow (Fig. 12b). The alerts in this flow are considered suspicious, and are flagged for more detailed investigation.
This example demonstrates how our system allows an an-alyst to follow a sequence of steps based on their own strate-gies and preferences to investigate alerts. Although it is pos-sible to filter the raw data to “highlight” this result directly, our colleagues suggested it might be difficult to recognize that the majority of the alerts occur for a specific destina-tion IP, source IP, port, and time range from a 910-line alert spreadsheet. The visualizations allow an analyst to follow this pattern step-by-step, uncovering more detailed informa-tion as they progress.
Our system attempts to be more accessible and more flex-ible than existing systems that use pre-selected data and predefined visualization techniques. Our web-based visuizations are recognized and understood by the analysts, al-lowing them to focus on the data they are most interested in at a given point in an investigation. They can easily request follow-on visualizations and modify them to pursue new hy-potheses and investigate new findings as they are uncovered. We believe our system meets all of the analysts’ original re-quirements, and forms a good starting point for a set of visualizations that will augment our analysts’ capabilities.
6.
FUTURE WORK
Future work focuses on three areas: (1) an analysis sand-box to augment an analyst’s working memory, (2) identify-ing preferences for individual analysts, and (3) askidentify-ing net-work security analysts to evaluate our visualizations.
Analysis Sandbox. Our analysts described how they examine a set of Snort alerts, normally over a short time win-dow (e.g., five minutes), then choose any suspicious alerts for further examination. When this happens, they request data from additional data sources, analyze the data, and con-struct hypotheses about how the data might be related, and how those relationships either support or refute the likeli-hood of an attack on their systems. Currently, each analysis is conducted independently, forcing analysts to track and correlate information manually by remembering the data they’ve seen and the relationships the data form across the different sources. One very useful opportunity is the ability to build a sandbox-like environment, where the individual analyses can be performed, stored, reviewed, and compared. This could significantly improve an analyst’s “working mem-ory” capacity, allowing them to focus more on specific de-tails of each analysis, and less on remembering the results
customized scripts to extract and aggregate raw alert data). We anticipate these analyst-level preferences will extend to a visualization system. To support this, the system should, at a minimum, allow analysts to define individual preferences. A better solution would be to track an analyst’s actions to better anticipate their strategies for specific types of tasks, for example, what types of data are they likely to request, how do they prefer that data to be visualized, and so on. We have previously used preference elicitation algorithms from artificial intelligence to track an analyst’s interests within a visualization session [6]. We believe a similar approach can be used to determine analysts’ preferences across multiple sessions. These preferences could have other important ad-vantages, for example, to bootstrap junior analysts by pro-viding them with a senior analyst’s “preferred approaches” to investigating specific types of potential network attacks.
Real-World Integration. In order to properly evaluate our system, we need network analysts to provide feedback on its strengths and limitations. This is critically important in our domain, where analysts demand that a visualization tool “fit” their environment and analysis strategies. Unfor-tunately, it is also particularly difficult for us to complete this evaluation, since security restrictions do not allow us to speak directly with the analysts. Instead, we will coordinate with IT staff who support the analysts. These individuals are excellent collaborators, since they understand the ana-lysts and how they work, and are themselves computer ex-perts who know what a visualization system is reasonably capable of supporting. We will improve our system based on IT staff feedback, have them present it to the analysts, then use anonymized analyst comments to further enhance our visualizations.
7.
ACKNOWLEDGMENTS
This work was supported by an ARO MURI on Computer-Aided Human Centric Cyber Situation Awareness.
8.
REFERENCES
[1] Applied Visions. Code DX: Software assurance visual analysis tool.
[2] T. K. Dang and T. T. Dang. A survey on security visualization techniques for web information systems.
International Journal of Web Information Systems, 9(1):6–31, 2013.
[3] F. Fischer, F. Mansmann, D. A. Keim, S. Pietzko, and M. Waldvogel. Large-scale network monitoring for visual analysis of attacks. In5th International Workshop on Visualization for Cyber Security (VizSec 2008), pages 111–118, Cambridge, MA, 2008.
[4] D. Fisher, D. Maltz, A. Greenberg, X. Wang,
H. Warncke, G. Robertson, and M. Czerwinski. Using visualization to support network and application management in a data center. InInternet Network
18(10):1744–1756, 2012.
[7] R. Heyes. RGraph: HTML5 and JavaScript charts. [8] K. Lakkaraju, W. Yurcik, and A. J. Lee. NVisionIP:
NetFlow visualizations of system state for security situational awareness. InWorkshop on Visualization and Data Mining for Computer Security
(VizSEC/DMSEC ’04), pages 65–72, Washington, DC, 2004.
[9] R. Marty.Applied security visualization. Addison-Wesley, Upper Saddle River, NJ, 2009. [10] J. McPherson, K. Ma, P. Krystosk, T. Bartoletti, and
M. Christensen. PortVis: A tool for port-based detection of security events. InWorkshop on
Visualization and Data Mining for Computer Security (VizSEC/DMSEC ’04), pages 73–81, Washington, DC, 2004.
[11] P. Minarik and T. Dymacek. NetFlow data visualization based on graphs. InVisualization for Computer Security, pages 144–151. Springer, 2008. [12] D. Phan, J. Gerth, M. Lee, A. Paepcke, and
T. Winograd. Visual analysis of network flow data with timelines and event plots. In4th International Workshop on Visualization for Cyber Security (VizSec 2007), pages 85–99, Sacramento, CA, 2007.
[13] H. Shiravi, A. Shiravi, and A. Ghorbani. A survey of visualization systems for network security.IEEE Transactions on Visualization and Computer Graphics, 18(8):1313–1329, 2012.
[14] R. Tamassia, B. Palazzi, and C. Papamanthou. Graph drawing for security visualization. InGraph Drawing, pages 2–13, 2009.
[15] Threat Stack, Inc. Snorby.
[16] S. Tricaud, K. Nance, and P. Saad´e. Visualizing network activity using parallel coordinates. In44th Hawaii International Conference on System Sciences (HICSS 2011), pages 1–8, Poipu, HI, 2011.
[17] J.-P. van Riel and B. Irwin. INetVis, a visual tool for network telescope traffic analysis. In4th International Conference on Computer Graphics, Virtual Reality, Visualisation and Interaction in Africa (AFRIGRAPH ’06), pages 85–89, Cape Town, South Africa, 2006. [18] VisiTrend. NDVis.
[19] X. Yin, W. Yurcik, Y. Li, K. Lakkaraju, and C. Abad. VisFlowConnect: Providing security situational awareness by visualizing network traffic flows. In23rd IEEE International Performance, Computing, and Communications Conference (IPCCC 2004), pages 601–607, Phoenix, AZ, 2004.
[20] Y. Zhang, Y. Xiao, M. Chen, J. Zhang, and H. Deng. A survey of security visualization for computer network logs.Security and Communication Networks, 5(4):404–421, 2012.