Network Traffic Flow for Botnet Detection
Muhammad Khairul Rijal Muhammad1, Nurulhuda Firdaus Mohd Azmi1 2,Nilam Nur Amir Sjarif1 2, Saiful Adli Ismail1 2, Suraya Ya’acob1, Rasimah Che Mohd Yusof1
1 Advanced Informatics Department (AID)
Razak Faculty of Technology and Informatics, Universiti Teknologi Malaysia, Jln Sultan Yahya Petra, 54100 Kuala Lumpur
e-mail: [email protected] ,[email protected] , [email protected] , [email protected], [email protected] , [email protected]
2 Machine Learning for Data Science (MLDS) Interest Group, Jln Sultan Yahya
Petra, 54100 Kuala Lumpur
Visual analytics (VA) is an integral approach combining visualization, human factors, and data analysis. VA can synthesize information and derive insight from massive, dynamic, ambiguous and often conflicting data. Thus, help discover the expected and unexpected information. Moreover, the visualization could support the assessment in a timely period on which pre-emptive action can be taken. This paper discusses the implementation of visual analytics with decision tree model on network traffic flow for botnet detection. The discussion covers scenarios based on workstation, network traffic ranges and times. The experiment consists of data modeling, analytics and visualization using Microsoft PowerBI platform. Five different VA with different scenario for botnet detection is examined and analysis. From the studies, it may provide visual analytics as flexible approach for botnet detection on network traffic flow by being able to add more information related to botnet, increase path for data exploration and increase the effectiveness of analytics tool. Moreover, learning the pattern of communication and identified which is a normal behavior and abnormal behavior will be vital for security visual analyst as a future reference. Keywords: Visual Analytics, Decision Tree, Data Visualization, Botnet Detection, Classification
73 Visual Analytics with Decision Tree on
1 Introduction
Botnet is a network of compromised computers under the control of a malicious actor. The individual device in the botnet is referring to as a bot (in this situation means a computer) that already infected by malware and control by the third party. The bots are also known as “zombie” due to the control can be remotely done by third party without the knowledge of owner. The third parties that control the botnet are called “bot herders” or “bot masters”. Botnet becomes a big threat as it can sneak inside and do the damage without the knowledge of users. One way to detect this type of threat is by observing the communication pattern of computers based on two features of network communication, which are, communication or network traffic is always legal and secondly, there are no rules to stop the communication especially if it is using the right protocol. There exist three (3) approaches in detecting botnet; firstly, detection at client level to find any suspicious activity in the compromised computer [24, 18]. The detection is done by examining application and system log, active processes, key-logs and usage of resources. Secondly, detection at network level where observation is done on the firewall or router [18, 1]. The prominent device for this approach is intrusion detection system (IDS) and intrusion prevention system (IPS). The third approach is hybrid detection [18, 8] whereby it is a combination of client based and network based where the aim is to correlate finding on independent client and network-based detection system. The main challenge of detecting botnet is the bots could change in due time. With this possibility, attackers might find a way to utilize the weakness of detection system which outdated or having security features known. Therefore, there is a needed an approach for detection for new or unknown bots and at the same time can protect the system from any threats that already around. This paper is concerned with a study of visual analytics with decision tree model on network traffic flow for botnet detection. Decision tree model is chosen as a model to classify the detection due to its ability to do classification for botnet detection [17, 18]. To maximize the use of Decision Tree, finding the characteristics of botnet on network traffic flow is imperative. One way to overcome the challenge of finding botnet characteristics is to use visual analytics model. In addition, data visualization in visual analytics will allow digesting a large amount of data in a comprehensive and understandable way, visual analytics on the other hand could facilitates reasoning and decision-making based on large and complex data sets and makes understanding complex data easier. Moreover, botnet detection based on network traffic normally need human analyst as it always varies over time and automated system might not efficiently functioning in this area. Learning the pattern of communication and identified which is a normal behavior and abnormal behavior will be vital for security analyst for future reference. In addition to that, visual analytics product for botnet detection may provide a flexible and scalable detection system based on security demands.
The organization of this paper is as follows: Section 1 briefly described about the work presented in the paper. Detail explanation about visual analytics and its application in security domain is presented in Section 2. Next, Section 3 describes the implementation of visual analytics based on decision tree model in network flow for botnet detection. The discussion covers the methodology of the experiment setup, the data set and the evaluation of the experiment. Later, Section 4 discuss about the experiment findings based on different scenario setup. Finally, the conclusion concludes the paper with emphasized on the future work and recommendation.
2 Visual Analytics (VA) and the Related Work
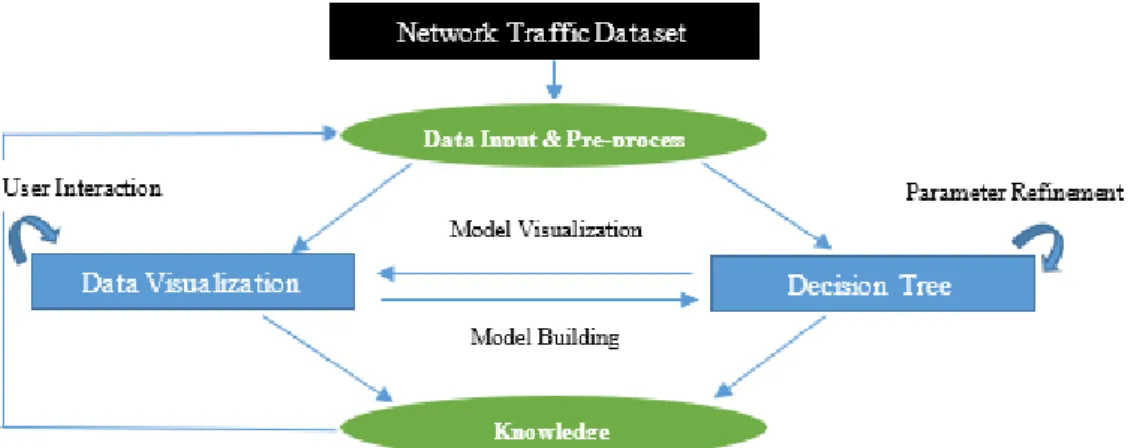
Visual analytics (VA) is an integral approach combining visualization, human factors, and data analysis. The main goal of VA is to synthesize information and derive perception from big, dynamic, ambiguous, and frequently conflicting statistics, detect the expected and discover the unexpected while providing timely, defensible, and understandable assessments, thus the assessment can successfully done for action [2]. Visual analytics aim is to enhance the effectiveness of the overall data mining life cycle process, namely, data preparation, derivation of the analytics model and validation stage. The visual analytics process can be illustrated as in Fig.1. From the Fig.1, the VA process consists of four (4) components namely Data, Model, Visualization and Knowledge. Data represent the data from dataset that is the basis of calculation or reasoning. Visualization is the process to look for structure, features, patterns, trends, anomalies and relationship in data. Models are involves with building the analytic model where the purpose is to extract information, recognize pattern and making prediction. Findings from visualization and models form a knowledge which then can be utilized for the next visual analytics process for improvement and decision making.
75 Visual Analytics with Decision Tree on
Fig. 1 Visual Analytics Process[3]
Research studies in visual analytics for security domain have become an attention among the researchers due to the challenge in collecting and analyzing security data. Some existing works are, Fischer et al.[10] used VisTracer as a tool to investigate routing anomalies in traceroutes. Their work propose visualizing data from the observation on routes to spam sources over several consecutive days after having received a spam message from such a source which distinguish between legitimate routing changes and those ones that are related to systematic misuse in so-called spam campaigns. Others, Marty[11] address the issue of the challenges in adopting data mining algorithm on security domain by discussing topics concern on situational awareness, large-scale, data exploration, knowledge capture, and forensic investigations by using visual analytics on security data. Kao et al.[12] propose awareness tool for potential cloud threats hiding in data. This tool support analyst in term of awareness by identifying high risk access behavior locality from abnormal cloud resource access and drill-down the unusual patterns and access behavior. In an attempt to nullify malware threat, Angelini et al. [13] introduce visual analytics prototype that provide a user with a better understanding on malware classification and also the possibility of changing the classification result. Yoo et al.[14] propose work on prototype that can detect anomalous behaviors from a large dataset. The dataset consist audit logs data which increase in real time. These existing studies shows that there is an interest to use visualization to support finding for a better algorithm to be applied on security data for enhancement in security system while on other hand highlighted the importance of human role to do the analysis.
3 Implementation of Visual Analytics with Decision Tree
Model for Botnet Detection
To implement VA for botnet detection on network traffic prototype based on decision tree model, two elements involve which is data visualization and decision tree model. The goal of data visualization is to identify pattern or trends on network traffic flow for botnet detection that can be utilized in constructing the Decision Tree model. Decision Tree is selected as the algorithm for botnet detection on network traffic flow due to high accuracy result from existing study on network traffic flow for botnet detection [15–19]. Finding from this VA will form the knowledge that could be utilized for decision making process. This section will discuss in detail the methodology used in the study, the data set used as the experiment on VA, the scenario based from the dataset and the evaluation for the VA.
3.1 The methodology
The methodology of this study is based on visual analytics process introduced by Kohlhammer et al.[3] as described in Fig.2. The process flow is described as in Figure 2 whereby, two elements involve in constructing botnet detection on network traffic prototype; Data Visualization and Decision Tree. Detail description is explained below.
Fig. 2 Visual Analytics on Network Traffic Flow for Botnet Detection
In Data Visualization, data exploration will be done by user to provide insight for model building. User interaction is based on analyse first, show the important, zoom/filter, analyse further, details on demand. Demands on other hand is based on the scenarios within the research scope which is computers, times and network traffic ranges.
77 Visual Analytics with Decision Tree on
While, for Decision Tree model, the process begins with data input and end with classification of Botnet and Normal. Normal means communication between workstation and remote computer has normal network traffic flow while botnet means anomaly communication between workstation and remote computer due to bot’s communication. In between dataset and classification, there is activity for attribute selection and filtering. Attribute Selection and filtering are done based on findings from Data Visualization. Decision rules of the Decision Tree model will be refined based on Knowledge after each completed visual analytics process.
3.2 Dataset
The dataset used in this study is an open data set obtained from University of Stanford (http://statweb.stanford.edu/~sabatti/data.html). The data is a collection of observe network traffic flow which consists about 21,000 rows of network traffic data from ten workstation computers for over three months period. Table 1 provides the data description of these network traffic dataset.
Table 1: Computer Network Traffic Dataset Column
Name
Type Description
date Date Date of traffic flow
l_ipn Whole Number Local computer (coded as integer from 0-9)
r_asn Whole Number Remote ASN (coded in integer form)
f Whole Number Network traffic frequency
3.3 Experiment Scenario
In overall, three (3) scenarios namely workstation, network traffic range and time is identified as the experiment scenario in the study. These three scenarios are dispensing into five (5) scenarios ID known as VA (id_number). Detail description for these experiment scenarios is described in Table 2.
Table 2: List of the Experiment Scenario and Its Description Scenario ID Experiment Scenario Purpose of Experiment
VA (1) - To identify compromise workstation
in network traffic dataset VA (2) Network Traffic
Range
To identify network traffic range that could differentiate abnormal network traffic flow and normal network traffic flow
VA (3) Workstation To identify abnormal network traffic flow between compromise
VA (4) Time To identify abnormal network traffic flow between workstation and remote computer in network traffic data for the first 46 days
VA (5) Time To identify abnormal network traffic flow between workstation and remote computer in network traffic data for the second 46 days
3.3 Measurement for Evaluation
In this study, two (2) type of evaluation is conducted. Firstly, the evaluation on the VA and secondly, the evaluation on the classification based from decision tree model.
The evaluation on the constructed visual analytics is conducted based from Scholtz, J. [20] approach which are the awareness situation, collaboration, interaction, creativity and utility; depending on the need of the studies [20]. In this study, the VA evaluation is emphasized on situation awareness, interaction and utility due to system is for security analyst. Detail of the evaluation is described in Table 3.
Table 3: Visual Analytics Evaluation
Hypothesis Possible Measure Contributing
Evaluation Area Visual Analytics should
increase the amount of information or data about botnet detection on network traffic flow
1) Number of anomalies found on network traffic flow
2) Number of entities considered (some notion of relationships,
attributes).
Interaction and utility
Visual Analytics should increase the number of paths that analysts are able to explore on network traffic for botnet detection
1) Numbers of path to explore the anomaly. 2) Numbers of decision
rules.
Interaction and utility
Visual Analytics should increase the efficiency and effectiveness of analytic on network traffic for botnet detection
1) Classification result 2) Error rate of Decision
Tree model
Situation awareness
Microsoft PowerBI platfrom is the tool chosen to construct visual analytics. The recursive Decision Tree is developed using R-language code in the platform.
79 Visual Analytics with Decision Tree on
In addition, the evaluation of the decision tree model for the classification result is based on four types of measurement: Rel error is a measurement to measure the estimated of the model developed, secondly, the CVal error to measure the observation from cross validation data, thirdly, Root_error measures the misclassification error at the beginning before adding any nodes and finally cp
measures the complexity value to control the size of the Decision Tree and selecting the optimal tree size.
4 Experiment Findings and Discussion
This section discussed the experiment findings on visual analytics with decision tree model on network traffic flow for botnet detection. The discussion is divided into two (2) parts; firstly, it discussed the findings according to five (5) visual analytics scenario identified in Table 2 and secondly, it discussed the summary of the experiment findings including the evaluation according to the hypothesis identified in Table 3.
4.1 Visual Analytics Prototype on Network Traffic Flow for Botnet Detection
Five (5) visual analytics scenario have been identified in the experiment and it is discussed below:
4.1.1 VA (1)
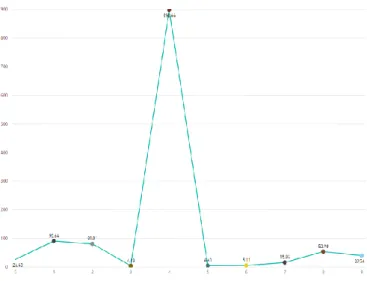
VA (1) is developed on the basis to identify compromised workstation that could be part of botnet. Therefore, this experiment is to identify attribute that can be manipulate for botnet detection on network traffic flow. Figure 3 below illustrates the network traffic frequency according to different workstation. To summarize the network traffic dataset, there are 20,803 of network traffic frequency with the total of 1,953,698. The average of network traffic frequency is 93.91; however the median is 2 which mean half of the network traffic frequency is either 2 or 1. The standard deviation of network traffic frequency in dataset is 5,764.86 which can be concluded that the data spread far from it means. This is supported by the range of max and lowest value of network traffic frequency which is between 784,234 and 1 respectively. Workstation 4 is considered part of botnet due to high number of abnormal value as shown in Fig. 3, thus, the decision tree model is developed.
Fig. 3 Average of Network Traffic Frequency by Workstation
From the decision tree model developed as illustrate in Fig. 4, it shows that there are 6% of botnet which represent the whole network traffic frequency in workstation 4. In contrary, other workstation constitutes 94% of network traffic frequency from the whole dataset. The model also has a low error rate with the value of 0.06.
Fig. 4 Decision Tree Model for VA (1) 4.1.2 VA (2)
Experiment on VA (2) focus on network traffic range due to bot’s attack is associated with high frequency network. Hence, network traffic frequency need to be divided into groups; one is for regular network traffic frequency and the others is for irregular network traffic frequency. At this stage, it is already known that half of network traffic frequency is at the level below 2 but the average is 93.91. Thus, 93.91 are selected as splitting point for the group. The result is shown in Figure 5.
81 Visual Analytics with Decision Tree on
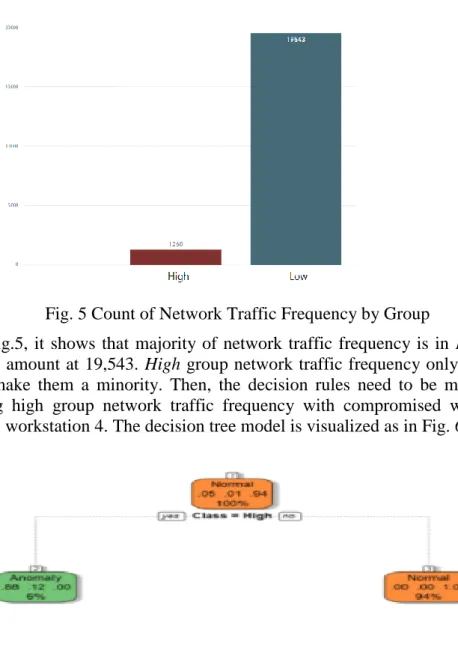
Fig. 5 Count of Network Traffic Frequency by Group
From Fig.5, it shows that majority of network traffic frequency is in Low group with the amount at 19,543. High group network traffic frequency only has 1,260 which make them a minority. Then, the decision rules need to be modified by inserting high group network traffic frequency with compromised workstation which is workstation 4. The decision tree model is visualized as in Fig. 6.
Fig. 6: Decision Tree Model in VA (2)
From the decision tree model as shown in Fig. 6, there is Anomaly class that represent High group network traffic frequency, which shows the value of .88 .12 .00. These value describe the portion of others workstation and workstation 4 for High group network traffic frequency. It shows that there is more High group network traffic frequency in others workstation than in workstation 4. Moreover, the decision tree model in VA (2) has more error compare to the decision tree model in VA (1).
4.1.3 VA (3)
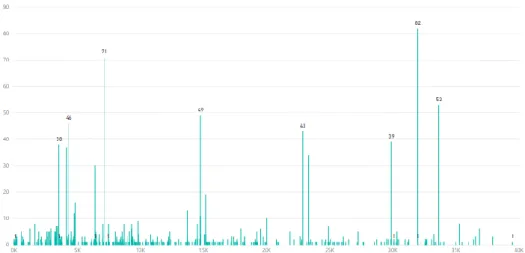
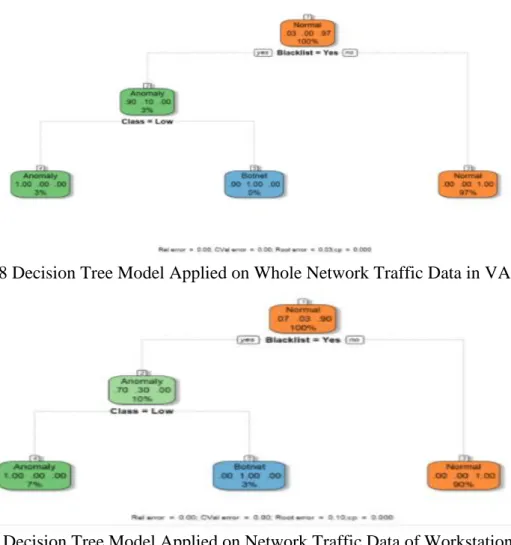
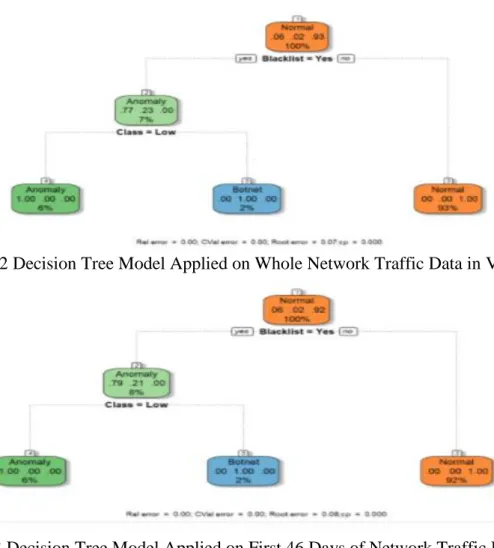
Experiment for VA (3), investigate further the network traffic data in workstation 4. The analysis is conducted on network traffic frequency between workstation 4 and remote computer as shown in Fig. 7. The graph in these figure, points to several remote computer with abnormal frequency when communicate with workstation 4. Those remote computer is identified as 3671, 4677, 9316, 12322, 684, 7132 and 33651 which is based on their ASN number. Due to the abnormal frequency, those remote computer is considered as part of the host being control by botmaster. Therefore, a new attribute is added to dataset to give a status to remote computer. A new attribute is called Blacklist. With this new attribute, remote computer identified of having abnormal frequency value is blacklisted. Thus, decision rules is again updated with the inclusion of blacklist status. Now, workstation 4 condition as botnet is not relevant anymore and being replaced by blacklist status. Decision Tree model in VA (3) is tested on two set of data which one for the whole dataset while another one for data in workstation 4. Furthermore, Figure 8 show that there is 3% Anomaly, 0% Botnet and 97% anomaly in workstation 4. The error rate of this model is the lowest if compare to error rate of Decision Tree model in VA (1) and VA (2).
83 Visual Analytics with Decision Tree on
Fig. 8 Decision Tree Model Applied on Whole Network Traffic Data in VA (3)
Fig. 9 Decision Tree Model Applied on Network Traffic Data of Workstation 4 in VA (3)
In Fig.9, the classification result is 7% Anomaly, 3% Botnet and 90% Normal. The root error of this model is also bigger than the one in Fig. 8 due smaller sample used. Fig.9 also show there is botnet in workstation 4 but due to small percentage the result is 0% as in Fig. 8.
4.1.4 VA (4)
In this experiment, the dataset is split into two samples. As the data is collected for 3 months (92 days), then it is divided at the day of 46th. VA (4) is conducted on network traffic data for the first 46 days. The total of network traffic frequency for this set of data is 425,888 with the average is 37.43 and 227.22 standard deviation value. The highest network traffic frequency during this period is 4,701 while the lowest is 1 and the median is 2. Due to high value of highest network traffic frequency in this period, further investigation is conducted on communication with remote computer by using sum of network traffic frequency.
Fig. 10 Sum of Network Traffic Frequency for The First 46 Days
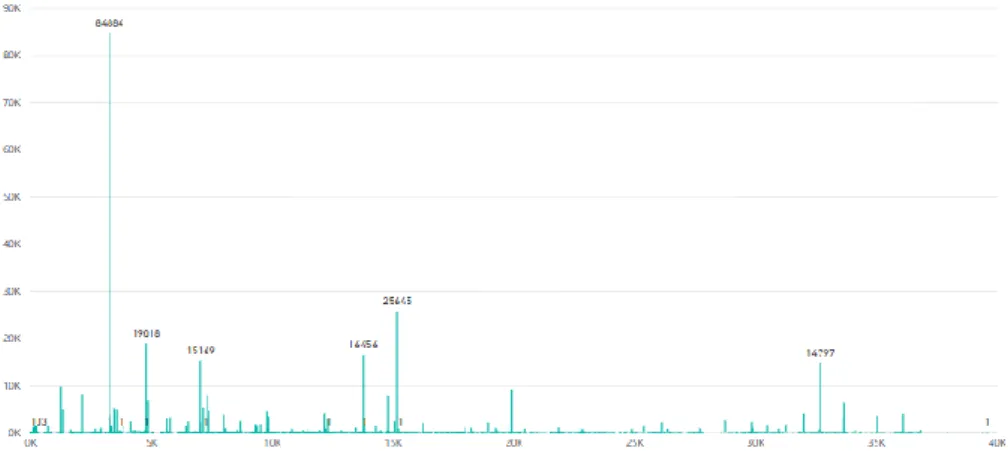
From Fig.10, six (6) of the network traffic frequency is identified having very high sum of network traffic frequency. Remote computer involves in those communication is 84884, 25645, 19018, 16456, 15169 and 14797. Further information on those remote computers is show in Fig.11.
Fig. 11 Details of Identified High Sum of Network Traffic Frequency in the First 46 Days
In Fig.10, it can be concluded that all identified remote computers have max value in the range of thousand. In the first 46 days, the average is 37, 43 and the standard deviation is 227.22, which means the possibility of data to spread into thousands is low. Therefore, the entire listed remote computer is blacklisted for precaution. The updated list of blacklisted remote computer is passed on to decision rules for decision tree model.
While, for the decision tree model ass illustrate in Fig.12, 6% of network traffic frequency is classified as Anomaly, 2% for Botnet and 93% is Normal. Based on this classification result, there is 1% of error if all class is totaled. Despite of that, root error is recorded to be 0.07.
85 Visual Analytics with Decision Tree on
Fig. 12 Decision Tree Model Applied on Whole Network Traffic Data in VA (4)
Fig. 13 Decision Tree Model Applied on First 46 Days of Network Traffic Data in VA (4)
For Fig.13, it shows that the result is 6% for Anomaly, 2% for Botnet and 92% for Normal. This classification produces more accurate portion and at the same time is applied on smaller sample. However, the root errors increase into 0.08.
4.1.5 VA (5)
VA (5) is contrasted using network traffic data for the second 46 days. Similar to method in VA (4), the first task is to summarize network traffic frequency during this period. For the second period of 46 days, there is 9,426 network traffic frequencies with total at 1,527,810. The average is 162.08 while the standard deviation is 8,560.08 which are far higher than the standard deviation for network traffic frequency in dataset. The highest network traffic frequency is similar to the one in workstation 4 (784,234) while the median is 2 and the lowest is 1. It can be concluded that workstation 4 is being attacked by bot’s during this period. Similar to VA (4), the investigation is conducted on network traffic frequency by remote
computer to find abnormal network traffic frequency. There are seven identified high sum of network traffic frequency in the second 46 days. However, four of the remote computer (3671, 9316, 3265, 15169) is already blacklisted in VA (3), thus only three (31983, 33070, 19916) remote computer is added into blacklist list. The updated Blacklist is then pass to decision rules. The result is shown as in Fig. 15.
Fig. 15 Details of Identified High Sum of Network Traffic Frequency in the Second 46 Days
Fig. 16 Decision Tree Model Applied on Whole Network Traffic Data in VA (5) For the decision tree model in scenario VA (5), Fig.16 show the result of classification is 6% for Anomaly, 2% for Botnet and 92% for Normal.
87 Visual Analytics with Decision Tree on
Fig. 17 Decision Tree Model Applied on Second 46 Days of Network Traffic Data in VA (5)
In Fig. 17, 6% of network traffic frequency is classified as Anomaly, 2% for Botnet and 93% is Normal. Based on this classification result, there is 1% of error if all class is totaled. Despite of that, root error is decreasing into 0.07. Interestingly, this is similar to the one in VA (4) when it is applied on whole network traffic data.
4.2 Summary of the Experiment Findings
This section summarizes the experiment result for each of the scenarios based on the hypotheses discussed in Table 3. The findings are shown in Table 4 to Table 6.
Table 4: Findings for H1 (Visual Analytics should increase the amount of information or data about botnet detection on network traffic flow) Measure VA (1) VA (2) VA (3) VA (4) VA (5) Number of anomalies found on network traffic flow 1 anomaly 1 anomaly 1 anomaly 2 anomalies 2 anomalies Number of entities considered 1 attribute 2 attributes 1 attribute 1 attribute 1 attribute From Table 4 it shows that each visual analytics consists of 1 or 2 anomalies and attributes. This show there is always a new finding after visual analytics process is completed. It can be concluded that there is an increase of information in each of constructed visual analytics prototype. While in Table 5 it shows that all
constructed visual analytics prototype has two paths to explore the anomaly found. VA (1) has one decision rules while the others VA have two decision rules. It can be concluded that VA (1) – (5) have increase the number of paths through visualization and decision tree model.
Table 5: Findings for H2 (Visual Analytics should increase the number of paths that analysts are able to explore on network traffic for botnet detection)
Measure VA (1) VA (2) VA (3) VA (4) VA (5) Numbers of path to
explore the anomaly.
2 paths 2 paths 2 paths 2 paths 2 paths
Numbers of decision rules 1 decision rules 2 decision rules 2 decision rules 2 decision rules 2 decision rules The efficiency and effectiveness of analytic is depending on the accuracy, specificity and sensitivity of decision tree model. This is measure by classification result and the error rate of the model as described in Table 6.
Table 6: Findings for H3 (Visual Analytics should increase the efficiency and effectiveness of analytic on network traffic for botnet detection)
Scenario Sample Classification Error
VA (1) Whole Data 94% Normal, 6% Botnet
0.06 Root error
VA (2)
Whole Data 94% Normal, 6% Anomaly
0.01 Rel error, 0.01 CVal error, 0.06 Root error
VA (3)
Whole Data 97% Normal, 0% Botnet, 3% Anomaly
0.03 Root error
Workstation 4 Data 90% Normal, 3% Botnet, 7% Anomaly
0.10 Root error
VA (4)
Whole Data 93% Normal,
2%Botnet, 7% Anomaly
0.07 Root error
First 46 Days Data 92% Normal, 2% Botnet, 6% Anomaly
0.08 Root error
VA (5)
Whole Data 92% Normal, 2% Botnet, 6% Anomaly
0.08 Root error
Second 46 Days Data 93% Normal, 2%Botnet, 7% Anomaly
89 Visual Analytics with Decision Tree on
From Table 6 it shows that 90% of normal network traffic frequency and less than 10% for anomaly and botnet depending on the sample. The error rate also quite low for all Decision Tree with the most recorded error is on Decision Tree model in VA (2). It can be concluded that visual analytics process helps to produce classification with low error rate.
5 Conclusion
In summary, this study has fulfilled the requirement to make visual analytics as flexible approach for botnet detection on network traffic flow by being able to add more information related to botnet, increase path for data exploration and increase the effectiveness of analytics tool. However, there is a limitation on dataset used as only network traffic frequency attribute can be manipulated. In future, the approach needs to be conducted on more complete network traffic dataset where more unique characteristics of botnet can be found.
ACKNOWLEDGEMENTS
The authors would like to thank Advanced Informatics School (UTM AIS), Universiti Teknologi Malaysia for the support of the resources. This work is currently funded by UTM with vot. Number:14H08.
References
[1] Eslahi, M., Salleh, R., and Anuar, N.B. (2012) Bots and botnets: An overview of characteristics, detection and challenges. in: 2012 IEEE Int. Conf. Control Syst. Comput. Eng., pp. 349–354.
[2] Keim, D., Kohlhammer, J., Ellis, G., and Mansmann, F. (2010) Mastering the Information Age Solving Problems with Visual Analytics. Eurographics Association, .
[3] Kohlhammer, J., Keim, D., Pohl, M., Santucci, G., and Andrienko, G. (2011) Solving Problems with Visual Analytics. Procedia Computer Science. 7 117–120.
[4] Jignesh Vania, Meniya, Arvind, and H. B. Jethva (2013) IJCTT - A Review on Botnet and Detection Technique. International Journal of Computer Trends and Technology.
[5] Feily, M., Shahrestani, A., and Ramadass, S. (2009) A Survey of Botnet and Botnet Detection. in: 2009 Third Int. Conf. Emerg. Secur. Inf. Syst. Technol., pp. 268–273.
[6] Asha, S., Harsha, T., and Soniya, B. (2016) Analysis on botnet detection techniques. in: 2016 Int. Conf. Res. Adv. Integr. Navig. Syst. RAINS, pp. 1–4.
[7] Karim, A., Salleh, R.B., Shiraz, M., Shah, S.A.A., Awan, I., and Anuar, N.B. (2014) Botnet detection techniques: review, future trends, and issues.
Journal of Zhejiang University SCIENCE C. 15 (11), 943–983.
[8] Zhang, L., Yu, S., Wu, D., and Watters, P. (2011) A Survey on Latest Botnet Attack and Defense. in: 2011IEEE 10th Int. Conf. Trust Secur. Priv. Comput. Commun., pp. 53–60.
[9] Alparslan, E., Karahoca, A., and Karahoca, D. (2012) BotNet Detection: Enhancing Analysis by Using Data Mining Techniques.
[10] Fischer, F., Fuchs, J., Vervier, P.-A., Mansmann, F., and Thonnard, O. (2012) VisTracer: A Visual Analytics Tool to Investigate Routing Anomalies in Traceroutes. in: Proc. Ninth Int. Symp. Vis. Cyber Secur., ACM, New York, NY, USApp. 80–87.
[11] Marty, R. (2013) Cyber Security: How Visual Analytics Unlock Insight. in: Proc. 19th ACM SIGKDD Int. Conf. Knowl. Discov. Data Min., ACM, New York, NY, USApp. 1139–1139.
[12] Kao, C.H., Dai, J.H., Ko, R., Kuang, Y.T., Lai, C.P., and Mao, C.H. (2016) MITC Viz: Visual Analytics for Man-in-the-Cloud Threats Awareness. in: 2016 Int. Comput. Symp. ICS, pp. 306–311.
[13] Angelini, M., Aniello, L., Lenti, S., Santucci, G., and Ucci, D. (2017) The goods, the bads and the uglies: Supporting decisions in malware detection through visual analytics. in: 2017 IEEE Symp. Vis. Cyber Secur. VizSec, pp. 1–8.
[14] Yoo, S., Jo, J., Kim, B., and Seo, J. (2018) LongLine: Visual Analytics System for Large-scale Audit Logs. Visual Informatics. 2 (1), 82–97. [15] Zhao, D., Traore, I., Sayed, B., Lu, W., Saad, S., Ghorbani, A., et al. (2013)
Botnet detection based on traffic behavior analysis and flow intervals.
Computers & Security. 39 (Part A), 2–16.
[16] Saad, S., Traore, I., Ghorbani, A., Sayed, B., Zhao, D., Lu, W., et al. (2011) Detecting P2P botnets through network behavior analysis and machine learning. in: 2011 Ninth Annu. Int. Conf. Priv. Secur. Trust, pp. 174–180. [17] Zhao, D., Traore, I., Ghorbani, A., Sayed, B., Saad, S., and Lu, W. (2012)
Peer to Peer Botnet Detection Based on Flow Intervals. in: Inf. Secur. Priv. Res., Springer, Berlin, Heidelberg, pp. 87–102.
[18] Stevanovic, M. and Pedersen, J.M. (2013) Machine learning for identifying botnet network traffic.
[19] Stevanovic, M. and Pedersen, J.M. (2014) An efficient flow-based botnet detection using supervised machine learning. in: 2014 Int. Conf. Comput. Netw. Commun. ICNC, pp. 797–801.
[20] Scholtz, J. (2006) Beyond Usability: Evaluation Aspects of Visual Analytic Environments. in: 2006 IEEE Symp. Vis. Anal. Sci. Technol., pp. 145–150. [21] Rokach, L. and Maimon, O. (2005) Top-down induction of decision trees classifiers - a survey. IEEE Transactions on Systems, Man, and Cybernetics, Part C (Applications and Reviews). 35 (4), 476–487.
91 Visual Analytics with Decision Tree on
[22] Somvanshi, M. and Chavan, P. (2016) A review of machine learning techniques using decision tree and support vector machine. in: 2016 Int. Conf. Comput. Commun. Control Autom. ICCUBEA, pp. 1–7.
[23] Navada, A., Ansari, A.N., Patil, S., and Sonkamble, B.A. (2011) Overview of use of decision tree algorithms in machine learning. in: 2011 IEEE Control Syst. Grad. Res. Colloq., pp. 37–42.
[24] Egele, M., Scholte, T., Kirda, E. and Kruegel, C., 2008. A Survey on Automated Dynamic Malware-analysis Techniques and Tools. ACM Comput. Surv., 44(2), p.6:1–6:42.
![Fig. 1 Visual Analytics Process[3]](https://thumb-us.123doks.com/thumbv2/123dok_us/500634.2559128/4.892.174.705.170.468/fig-visual-analytics-process.webp)