ADVERTIMENT. La consulta d’aquesta tesi queda condicionada a l’acceptació de les següents condicions d'ús: La difusió d’aquesta tesi per mitjà del servei TDX (www.tesisenxarxa.net) ha estat autoritzada pels titulars dels drets de propietat intel·lectual únicament per a usos privats emmarcats en activitats d’investigació i docència. No s’autoritza la seva reproducció amb finalitats de lucre ni la seva difusió i posada a disposició des d’un lloc aliè al servei TDX. No s’autoritza la presentació del seu contingut en una finestra o marc aliè a TDX (framing). Aquesta reserva de drets afecta tant al resum de presentació de la tesi com als seus continguts. En la utilització o cita de parts de la tesi és obligat indicar el nom de la persona autora.
ADVERTENCIA. La consulta de esta tesis queda condicionada a la aceptación de las siguientes condiciones de uso: La difusión de esta tesis por medio del servicio TDR (www.tesisenred.net) ha sido autorizada por los titulares de los derechos de propiedad intelectual únicamente para usos privados enmarcados en actividades de investigación y docencia. No se autoriza su reproducción con finalidades de lucro ni su difusión y puesta a disposición desde un sitio ajeno al servicio TDR. No se autoriza la presentación de su contenido en una ventana o marco ajeno a TDR (framing). Esta reserva de derechos afecta tanto al resumen de presentación de la tesis como a sus contenidos. En la utilización o cita de partes de la tesis es obligado indicar el nombre de la persona autora.
WARNING. On having consulted this thesis you’re accepting the following use conditions: Spreading this thesis by the TDX (www.tesisenxarxa.net) service has been authorized by the titular of the intellectual property rights only for private uses placed in investigation and teaching activities. Reproduction with lucrative aims is not authorized neither its spreading and availability from a site foreign to the TDX service. Introducing its content in a window or frame foreign to the TDX service is not authorized (framing). This rights affect to the presentation summary of the thesis as well as to its contents. In the using or citation of parts of the thesis it’s obliged to indicate the name of the author
3
Universitat Politècnica de Catalunya
Optical Communications Group
Orchestrating Datacenters and
Networks to Facilitate the
Telecom Cloud
Adrián Asensio García
A thesis presented in partial fulfillment of the
requirements for the degree of
Philosophy Doctor
Advisor:
Dr. Luis Velasco Esteban
© 2016 by Adrián Asensio García
All rights reserved. No part of this book may be reproduced, in any form or by any means, without permission in writing from the Author.
ISBN 978-84-608-7287-0
Optical Communications Group (GCO) Universitat Politècnica de Catalunya (UPC) C/ Jordi Girona, 1-3
Campus Nord, D4-213 08034 Barcelona, Spain
Assessment results for the doctoral thesis
Academic year: Full nameDoctoral programme
Structural unit in charge of the programme
Decision of the committee
In a meeting with the examination committee convened for this purpose, the doctoral candidate presented the topic of his/her doctoral thesis entitled
__________________________________________________________________________________________ _________________________________________________________________________________________. Once the candidate had defended the thesis and answered the questions put to him/her, the examiners decided to award a mark of:
UNSATISFACTORY SATISFACTORY GOOD VERY GOOD (Full name and signature)
Chairperson
(Full name and signature)
Secretary (Full name and signature)
Member
(Full name and signature)
Member
(Full name and signature)
Member
______________________, _____________________________________________
The votes of the members of the examination committee were counted by the Doctoral School at the behest of the Doctoral Studies Committee of the UPC, and the result is to award the CUM LAUDE DISTINCTION:
YES NO
(Full name and signature)
Chair of the Standing Committee of the Doctoral School
(Full name and signature)
Secretary of the Standing Committee of the Doctoral School
Barcelona, _________
International doctoral degree statement
As the secretary of the examination committee, I hereby state that the thesis was partly (at least the abstract and the conclusions) defended in a language commonly used in scientific communication in the field that is not an official language of Spain. This does not apply if the stay, report or expert is from a Spanish-speaking country.
(Nom, cognoms i signatura)
3
Agradecimientos
Esta tesis no habría sido posible sin la confianza y el apoyo de todas aquellas personas que han estado junto a mí a lo largo de estos últimos años.
Quiero agradecer especialmente a Luis Velasco, director de esta tesis, su impecable dirección y profesionalidad en todo momento. Gracias a su dedicación, apoyo y guía ha hecho de esta tesis un trabajo apasionante para mí, así como una de las experiencias más gratificantes tanto a nivel académico como personal.
También quiero agradecer la confianza y ayuda que me han brindado Gabriel Junyent, Jaume Comellas y Marc Ruiz, así como el resto de compañeros del GCO de la UPC, quienes me han acogido desde el primer momento.
Finalmente, quiero agradecer a mis padres, Dani y Montse, y mi hermano, Martí, su generosidad y apoyo, así como dedicar esta tesis a Leila y Eric.
3
Abstract
In the Internet of services, information technology (IT) infrastructure providers play a critical role in making the services accessible to end-users. IT infrastructure providers host platforms and services in their datacenters (DCs). The cloud initiative has been accompanied by the introduction of new computing paradigms, such as Infrastructure as a Service (IaaS) and Software as a Service (SaaS), which have dramatically reduced the time and costs required to develop and deploy a service.
However, transport networks become crucial to make services accessible to the user and to operate DCs. Transport networks are currently configured with big static fat pipes based on capacity over-provisioning aiming at guaranteeing traffic demand and other parameters committed in Service Level Agreement (SLA) contracts. Notwithstanding, such over-dimensioning adds high operational costs for DC operators and service providers. Therefore, new mechanisms to provide reconfiguration and adaptability of the transport network to reduce the amount of over-provisioned bandwidth are required. Although cloud-ready transport network architecture was introduced to handle the dynamic cloud and network interaction and Elastic Optical Networks (EONs) can facilitate elastic network operations, orchestration between the cloud and the interconnection network is eventually required to coordinate resources in both strata in a coherent manner.
In addition, the explosion of Internet Protocol (IP)-based services requiring not only dynamic cloud and network interaction, but also additional service-specific SLA parameters and the expected benefits of Network Functions Virtualization (NFV), open the opportunity to telecom operators to exploit that cloud-ready transport network and their current infrastructure, to efficiently satisfy network requirements from the services. In the telecom cloud, a pay-per-use model can be offered to support services requiring resources from the transport network and its infrastructure.
In this thesis, we study connectivity requirements from representative cloud-based services and explore connectivity models, architectures and orchestration schemes to satisfy them aiming at facilitating the telecom cloud.
and simulation, the viability of orchestrating DCs and networks to facilitate the telecom cloud.
To achieve the main goal we first study the connectivity requirements for DC interconnection and services on a number of scenarios that require connectivity from the transport network. Specifically, we focus on studying DC federations, live-TV distribution, and 5G mobile networks. Next, we study different connectivity schemes, algorithms, and architectures aiming at satisfying those connectivity requirements. In particular, we study polling-based models for dynamic inter-DC connectivity and propose a novel notification-based connectivity scheme where inter-DC connectivity can be delegated to the network operator. Additionally, we explore virtual network topology provisioning models to support services that require service-specific SLA parameters on the telecom cloud. Finally, we focus on studying DC and network orchestration to fulfill simultaneously SLA contracts for a set of customers requiring connectivity from the transport network.
It shall be mentioned that part of the work reported in this thesis has been done within the framework of European and National projects, namely IDEALIST (FP7-ICT-2011-8), funded by the European Commission, and ELASTIC (TEC2011-27310) and SYNERGY (TEC2014-59995-R) funded by the Spanish Science Ministry.
3
Resumen
En la Internet de los servicios, los proveedores de recursos relacionados con tecnologías de la información juegan un papel crítico haciéndolos accesibles a los usuarios como servicios. Dichos proveedores, hospedan plataformas y servicios en centros de datos. La oferta plataformas y servicios en la nube ha introducido nuevos paradigmas de computación tales como ofrecer la infraestructura como servicio, conocido como IaaS de sus siglas en inglés, y el software como servicio, SaaS. La disponibilidad de recursos en la nube, ha contribuido a la reducción de tiempos y costes para desarrollar y desplegar un servicio.
Sin embargo, para permitir el acceso de los usuarios a los servicios así como para operar los centros de datos, las redes de transporte resultan imprescindibles. Actualmente, las redes de transporte están configuradas con conexiones estáticas y su capacidad sobredimensionada para garantizar la demanda de tráfico así como los distintos parámetros relacionados con el nivel de servicio acordado. No obstante, debido a que el exceso de capacidad en las conexiones se traduce en un elevado coste tanto para los operadores de los centros de datos como para los proveedores de servicios, son necesarios nuevos mecanismos que permitan adaptar y reconfigurar la red de forma eficiente de acuerdo a las nuevas necesidades de los servicios a los que dan soporte. A pesar de la introducción de arquitecturas que permiten la gestión de redes de transporte y su interacción con los servicios en la nube de forma dinámica, y de la irrupción de las redes ópticas elásticas, la orquestación entre la nube y la red es necesaria para coordinar de forma coherente los recursos en los distintos estratos.
Además, la explosión de servicios basados el Protocolo de Internet, IP, que requieren tanto interacción dinámica con la red como parámetros particulares en los niveles de servicio además de los habituales, así como los beneficios que se esperan de la virtualización de funciones de red, representan una oportunidad para los operadores de red para explotar sus recursos y su infraestructura. La nube de operador permite ofrecer recursos del operador de red a los servicios, de forma similar a un sistema basado en pago por uso.
nube y se exploran modelos de conectividad, arquitecturas y modelos de orquestación que contribuyan a la realización de la nube de operador.
El objetivo principal de esta Tesis es demostrar la viabilidad de la orquestación de centros de datos y redes para facilitar la nube de operador, mediante modelos analíticos y simulaciones.
Con el fin de cumplir dicho objetivo, primero estudiamos los requisitos de conectividad para la interconexión de centros de datos y servicios en distintos escenarios que requieren conectividad en la red de transporte. En particular, nos centramos en el estudio de escenarios basados en federaciones de centros de datos, distribución de televisión en directo y la evolución de las redes móviles hacia 5G. A continuación, estudiamos distintos modelos de conectividad, algoritmos y arquitecturas para satisfacer los requisitos de conectividad. Estudiamos modelos de conectividad basados en sondeos para la interconexión de centros de datos y proponemos un modelo basado en notificaciones donde la gestión de la conectividad entre centros de datos se delega al operador de red. Estudiamos la provisión de redes virtuales para soportar en la nube de operador servicios que requieren parámetros específicos en los acuerdos de nivel de servicio además de los habituales. Finalmente, nos centramos en el estudio de la orquestación de centros de datos y redes con el objetivo de satisfacer de forma simultánea requisitos para distintos servicios.
Parte del trabajo realizado durante el desarrollo de esta Tesis ha sido financiado por el proyecto Europeo IDEALIST (FP7-ICT-2011-8), y los proyectos nacionales ELASTIC (TEC2011-27310) y SYNERGY (TEC2014-59995-R).
3
Table of Contents
PageIntroduction ... 1
Chapter 1.
1.1 Motivation ... 11.2 Goals of the thesis ... 2
1.3 Methodology ... 4 1.4 Thesis outline ... 5
Background ... 7
Chapter 2.
2.1 Cloud computing ... 7 2.1.1 Virtualization ... 8 2.1.2 DC federations ... 8 2.1.3 DC architecture ... 8 2.1.4 DC power model ... 92.2 Elastic optical networks ... 10
2.2.1 Flexgrid technology ... 10
2.2.2 Provisioning ... 12
2.2.3 Recovery ... 13
2.2.4 Multilayer networks ... 13
2.3 Control and management architecture ... 14
2.3.1 Transport networks ... 14
2.4 Telecom cloud ... 15
2.4.2 Radio access networks to support 5G networks... 17
2.5 Network functions virtualization ... 19
2.6 Conclusions ... 19
Review of the State-of-the-Art ... 21
Chapter 3.
3.1 Connectivity requirements for DC interconnection, live-TV distribution and 5G mobile networks ... 213.1.1 Elastic operations in DC federations ... 21
3.1.2 Live-TV distribution on the telecom cloud ... 23
3.1.3 5G mobile networks ... 23
3.2 Connectivity schemes ... 25
3.2.1 Dynamic and elastic connections ... 25
3.2.2 Transfer-based DC connections ... 26
3.2.3 Virtual network topology provisioning... 27
3.3 Cross-stratum orchestration ... 28
3.4 Conclusions ... 28
Elastic operations in DC federations... 31
Chapter 4.
4.1 Elastic Operations in Federated DCs for Performance and Cost Optimization (ELFADO) problem ... 324.2 Mathematical formulation ... 35
4.2.1 ELFADO Problem statement ... 35
4.2.2 Mathematical model ... 36 4.2.3 Complexity analysis ... 39 4.3 Heuristic algorithms ... 40 4.4 Performance evaluation ... 43 4.4.1 Scenario ... 43 4.4.2 Illustrative results ... 45 4.5 Conclusions ... 49
Telecom cloud-based services ... 51
Chapter 5.
5.1 Live-TV distribution on telecom cloud ... 51Table of Contents III
5.1.2 Planning procedure ... 54
5.1.3 Illustrative results ... 55
5.2 Study of the centralization level of C-RAN ... 59
5.2.1 C-RAN architecture model ... 59
5.2.2 The C-RAN CAPEX Minimization (CRAM) problem... 60
5.2.3 Mathematical formulation ... 61
5.2.4 Illustrative results ... 65
5.3 Connectivity requirements... 70
5.4 Conclusions ... 71
Dynamic and elastic connections ... 73
Chapter 6.
6.1 Dynamic connectivity models ... 746.2 Using connectivity models for elastic operations ... 75
6.2.1 Performance evaluation ... 77
6.3 Adaptive spectrum allocation ... 82
6.3.1 Spectrum allocation policies ... 83
6.3.2 Problem statement ... 84
6.3.3 Spectrum adaptation algorithms ... 85
6.3.4 Illustrative results ... 86
6.4 Conclusions ... 91
Polling-based and notification-based connectivity
Chapter 7.
models ... 93
7.1 Statistical model for green solar energy availability estimation ... 93
7.2 Stochastic ELFADO formulation ... 97
7.3 DC and network orchestration ... 100
7.4 Illustrative results ... 101
7.5 Conclusions ... 108
Application service orchestrator for transfer-based DC
Chapter 8.
interconnection. ... 109
8.1 Application Service Orchestrator (ASO) ... 110
8.1.2 Illustrative results ... 113
8.2 Routing and Scheduled Spectrum Allocation ... 116
8.2.1 Managing transfer-based connections ... 117
8.2.2 The RSSA Problem ... 118
8.2.3 Mathematical formulation ... 119
8.2.4 Complexity analysis ... 123
8.2.5 Algorithms to manage transfer-based connection requests ... 123
8.2.6 Illustrative results ... 125
8.3 Conclusions ... 132
On-demand customer virtual network provisioning . 135
Chapter 9.
9.1 CVN reconfiguration ... 1369.2 CVN reconfiguration with QoS constraints and bitrate guarantees ... 138
9.2.1 CVN-QBG problem ... 138
9.2.2 Illustrative results ... 140
9.3 Study of bitrate guarantees strategies ... 142
9.3.1 CVN service reconfiguration with QoS constraints and bitrate guarantees (SQUBA) ... 144 9.3.2 Illustrative results ... 150 9.4 Conclusions ... 154
Closing Discussion ... 157
Chapter 10.
10.1 Main contributions ... 157 10.2 List of Publications... 159 10.2.1 Publications in Journals ... 159 10.2.2 Publications in Conferences ... 159 10.2.3 Other publications ... 16010.3 List of Research Projects ... 160
10.3.1 European funded projects ... 161
10.3.2 Spanish funded projects ... 161
10.4 Research stay ... 161
Table of Contents V
List of Acronyms ... 163
References ... 167
3
List of Figures
Page
Fig. 1-1 Methodology. ... 5
Fig. 2-1 Example of fat-tree DC architecture (M = 4). ... 9
Fig. 2-2 Example of flexible and elastic spectrum allocation. ... 11
Fig. 2-3 Example of flexgrid-based network with three lightpaths established. ... 12
Fig. 2-4 Example of SRLG-disjoint paths under partial protection and diversity. .. 13
Fig. 2-5 Multilayer network. ... 14
Fig. 2-6 Example of PCE-based control architectures. ... 15
Fig. 2-7 Architecture to support cloud-ready transport networks. Reproduced from [Co12]. ... 16
Fig. 2-8 Distributed and centralized RAN architectures. ... 18
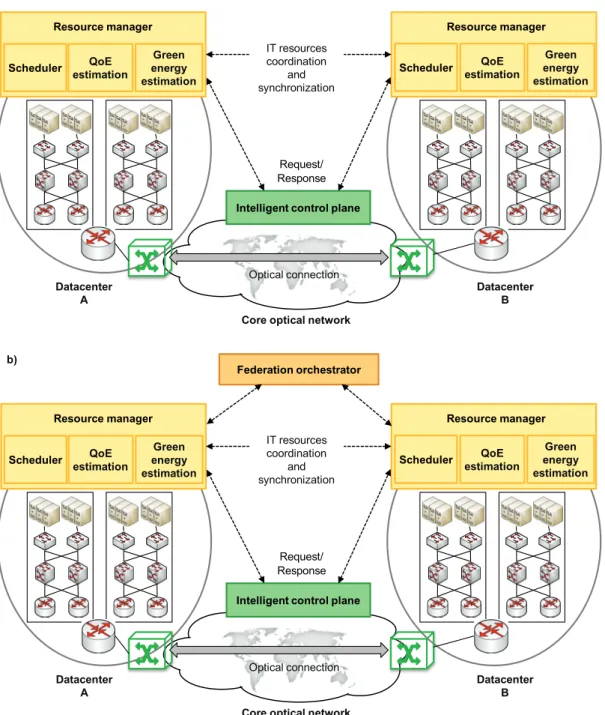
Fig. 4-1 Distributed (a) and centralized (b) federated DCs orchestration. ... 33
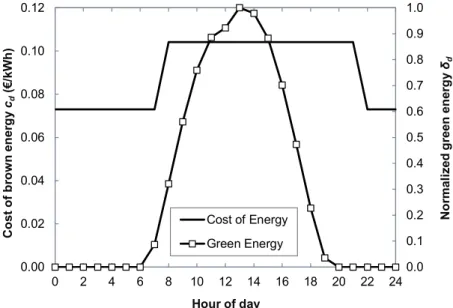
Fig. 4-2 Unit cost of brown energy and normalized availability of green energy against the time of day. ... 34
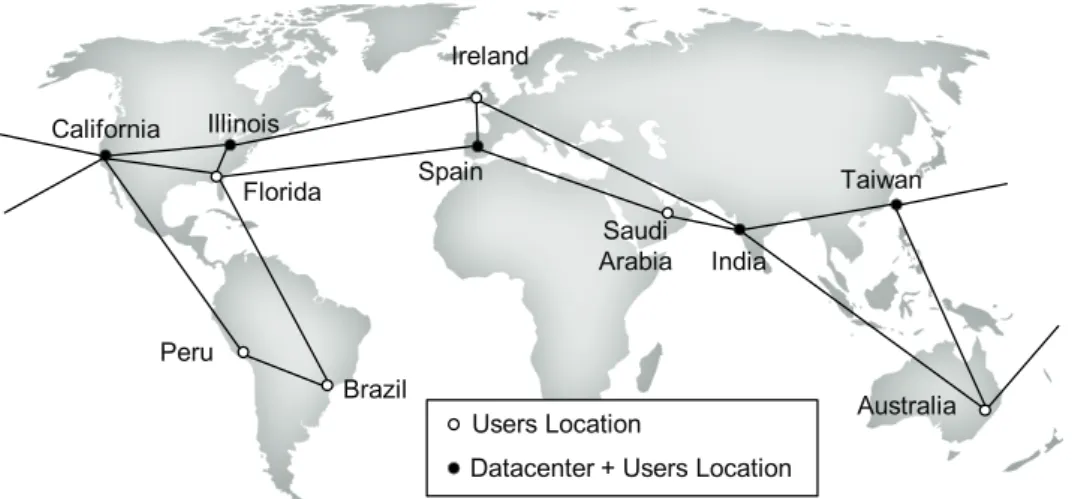
Fig. 4-3 Considered scenario: federated DCs, locations and inter-DC network. ... 43
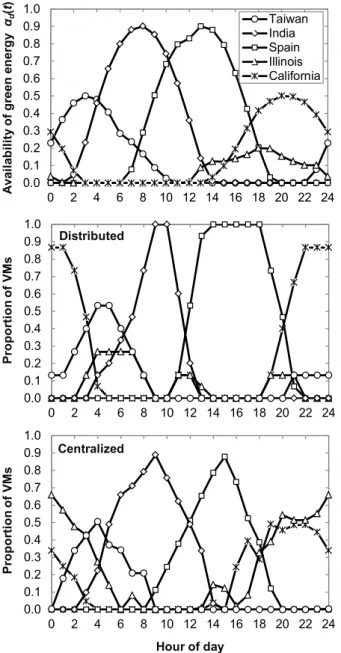
Fig. 4-4 Availability of green energy vs. time in all DCs (top). Percentage of VMs in each DC when the distributed (middle) and the centralized (bottom) approaches are applied. ... 45
Fig. 4-5 Energy (top) and communication (middle) cost per hour against time. Latency vs. time (bottom). ... 46
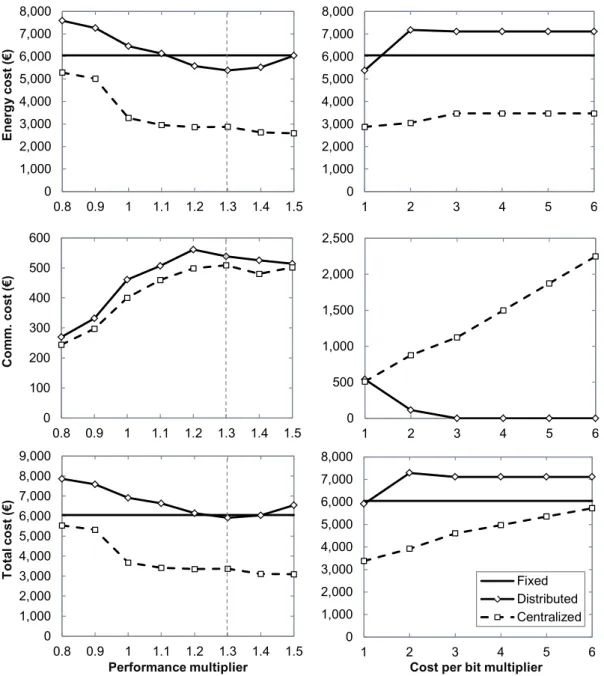
Fig. 4-6 Cost per day against performance threshold (left) and cost per day against cost per bit (right). ... 48
Fig. 5-2 Architecture details. ... 54
Fig. 5-3 Average switching capacity. ... 58
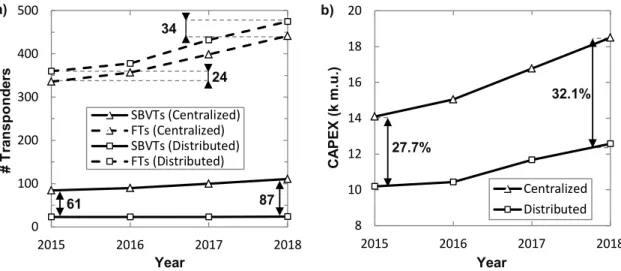
Fig. 5-4 Total number of FTs and SBVTs installed (a) and network CAPEX (b). ... 58
Fig. 5-5 Example of C-RAN architecture. ... 60
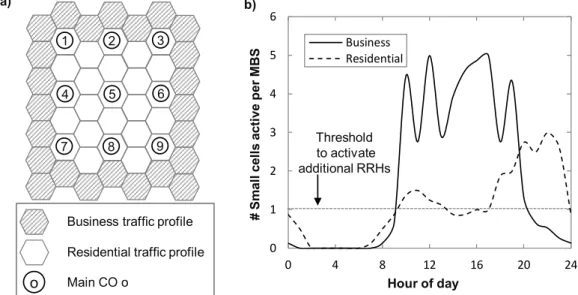
Fig. 5-6 Cells and main CO placement (a) and number of small cells active, per MBS, against the daytime (b). ... 66
Fig. 5-7 Cost evolution against the number of main COs to equip for two different LTE-A configurations at 12 p.m. and 10 p.m. ... 67
Fig. 5-8 Main COs to equip against daytime hours. ... 68
Fig. 5-9 Power consumption of transponders (a) and total equipment (b). ... 69
Fig. 6-1 Example of connection’s bitrate against time for the static and dynamic connectivity models. ... 74
Fig. 6-2 Example of connection’s bitrate against time for the static and dynamic connectivity models. ... 75
Fig. 6-3 Architecture considered with cross-stratum orchestrator. ... 76
Fig. 6-4 Dynamic and dynamic elastic connectivity models. ... 77
Fig. 6-5 Network scenario ... 78
Fig. 6-6 Connections dimensioning for static connectivity. ... 79
Fig. 6-7 Static connectivity. ... 79
Fig. 6-8 Dynamic connectivity. Low U2DC traffic. ... 80
Fig. 6-9 Dynamic connectivity. High U2DC traffic... 81
Fig. 6-10 Three SA policies for time-varying traffic in a flexgrid network. Two time intervals are observed: t before and t+1 after spectrum adaptation has been performed. ... 84
Fig. 6-11 TEL21 network topology. ... 86
Fig. 6-12 Percentage of unserved bitrate against the traffic load for TEL21 (top), TEL60 (middle) and TEL100 (bottom) networks when the capacity of the lightpaths is limited to 100 Gb/s (left) and 400 Gb/s (right). ... 89
Fig. 7-1 d(t) as a function of the day for two different weeks. ... 95
Fig. 7-2 d as a function of the day (at 2 p.m.) (a) and d’ for k=3 (b). ... 95
List of Figures IX
Fig. 7-4 Energy cost increment w.r.t. EVPI: relative per hour (a), cumulated per
day (b). ... 104
Fig. 7-5 Worldwide scenario considered in our experiments. ... 104
Fig. 7-6 Daily energy cost (a) and communications cost (b). ... 106
Fig. 7-7 Percentage of VMs not moved as first scheduled (a), number of connection requests (b), and latency experienced by users (c). ... 106
Fig. 7-8 Hourly costs for several background traffic intensities. ... 107
Fig. 8-1 Control architecture where the ABNO interfaces resource managers (a). Proposed architecture where the ASO offers an application-oriented semantic interface (b). ... 110
Fig. 8-2 ASO implementing transfer-based operations. ... 111
Fig. 8-3 Polling-based (a) and notification-based (b) models for transfer-based connections. ... 112
Fig. 8-4 Global inter-DC topology. ... 114
Fig. 8-5. Req. bitrate in a day... 114
Fig. 8-6 DC2DC connection bitrate vs. time. ... 115
Fig. 8-7 Control architecture scheme (a). Example of messages exchanged to request connection operations (b). ... 117
Fig. 8-8 Scheduling schemes for SA. a) Bitrate squeezing only and b) with scheduled resource reservation. ... 118
Fig. 8-9 Three feasible re-scheduling for a given transference. ... 120
Fig. 8-10 The Telefonica (TEL), British Telecom (BT), and Deutsche Telekom (DT) network topologies used in this section. ... 127
Fig. 8-11 Unserved bitrate and transference completion time vs. load (in terms of number of VMs). Only transfer-mode requests are considered. ... 128
Fig. 8-12 Unserved bitrate and transference completion time vs. VMs’ size. Only transfer-mode requests are considered. ... 130
Fig. 8-13 Unserved bitrate of transfer-mode requests and transference completion time vs. offered load of fixed-bitrate traffic. ... 131
Fig. 9-1 3-layered network topology ... 136
Fig. 9-2 Management architecture ... 137
Fig. 9-4 Service blocking (a), end-to-end delay (b), and total number of BVTs (c)
against number of clients ... 141
Fig. 9-5 Example of CVN based on protection and diversity schemes to support CVN links. ... 143
Fig. 9-6 Network topologies considered in the study. ... 150
Fig. 9-7 Performance (a), total number of transponders (b), and e2e delay (c). ... 151
3
List of Tables
Page Table 1-1 Thesis goals ... 4 Table 3-1 State-of-the-art summary ... 30 Table 4-1 Size of the ELFADO problem... 40 Table 4-2 Heuristic for the distributed ELFADO ... 41 Table 4-3 Heuristic for the centralized ELFADO ... 42 Table 4-4 Value of energy parameters ... 44 Table 4-5 Characteristics of Huawei CloudEngine switches ... 44 Table 4-6 Comparison of daily costs and performance ... 47 Table 5-1 Constructive algorithm ... 55 Table 5-2 Technology adoption scenarios for different years ... 56 Table 5-3 Representative values for the centralized architecture ... 56 Table 5-4 Representative values for the distributed architecture ... 57 Table 5-5 Connectivity requirements for DC interconnection ... 70 Table 6-1. Connectivity models comparison. ... 82 Table 6-2. Elastic operations per period. ... 82 Table 6-3 Semi-elastic SA algorithm ... 85 Table 6-4 Elastic SA algorithm ... 86 Table 6-5 Details of network topologies ... 87 Table 6-6 Gain of adaptive SA policies vs. fixed SA at 1% of unserved bitrate ... 90 Table 6-7 Distribution of lightpaths according to the level of variability ... 91 Table 7-1 Normalization parameters ... 102 Table 7-2 bnk polynomial coefficients ... 103
Table 7-3 Weather probability transitions ( ) ... 103 Table 8-1 Algorithm for transfer-based connection requests ... 113 Table 8-2 Performance results ... 116 Table 8-3 Algorithm for computing rectangle sets ... 120 Table 8-4 Algorithm for the RSSA problem ... 124 Table 8-5 Algorithm for Resource Assignment ... 125 Table 8-6 ILP model vs. heuristic comparison ... 126 Table 8-7 Offered load gain and transference time comparison ... 129 Table 8-8 Elastic operations at 1% of unserved bitrate... 129 Table 9-1 Algorithm for CVN-QBG. ... 139 Table 9-2 setupCVNLink algorithm. ... 140 Table 9-3 Algorithm for the SQUBA Problem ... 149 Table 9-4 setupCVNLink algorithm for the SQUBA Problem ... 149 Table 9-5 Number of Hops in MPLS Paths ... 153
3
Chapter 1
Introduction
1.1
Motivation
In the Internet of services, information technology (IT) infrastructure providers play a critical role in making the services accessible to end-users. IT infrastructure providers host platforms and services in their datacenters (DCs). The cloud initiative has been accompanied by the introduction of new computing paradigms, such as Infrastructure as a Service (IaaS) and Software as a Service (SaaS), which have dramatically reduced the time and costs required to develop and deploy a service [Ar10]. These paradigms are playing a role of paramount importance in the way companies invest their money regarding IT resources: they are moving from a model where large amounts of capital expenditures (CAPEX) are needed to build their own IT infrastructure and additional cost to operate and maintain it (operational expenditures, OPEX), to a pure OPEX model where IT resources are requested to cloud providers in a pay-as-you-go model.
However, that new model and the requirements derived from cloud services are contributing to the increasing amount of data that require connectivity from the transport networks. Cisco global cloud index [GCI12] forecasts DC traffic to reach 554 Exabytes (EB) per month by 2016. Two main components of traffic leaving from/arriving to DCs can be distinguished: traffic among DCs (DC2DC) and traffic between DCs and end-users (referred to as U2DC in this thesis).
From the network point of view, transport networks are currently configured with
big static fat pipes based on capacity over-provisioning aiming at guaranteeing traffic demand and other parameters committed in Service Level Agreement (SLA) contracts. The capacity of optical connections for inter-DC connectivity is dimensioned in advance based on some volume of foreseen data to transfer.
From the cloud perspective, scheduling algorithms inside cloud management run periodically trying to optimize some cost function, such as energy costs, and organize data transferences as a function of the available bitrate. Obviously, this static connectivity configuration adds high costs since large connectivity capacity remains unused during periods where small amount of data needs to be transferred. Thus, cloud connectivity services require new mechanisms to provide reconfiguration and adaptability of the transport network to reduce the amount of over-provisioned bandwidth. Although cloud-ready transport network architecture [Co12] was introduced to handle this dynamic cloud and network interaction allowing on-demand connectivity provisioning, the efficient integration of cloud-based services among distributed DCs, including the interconnecting network, becomes a challenge.
Moreover, the explosion of Internet Protocol (IP)-based services requiring not only dynamic connectivity, but also service-specific SLA parameters and the expected benefits of Network Functions Virtualization (NFV), open the opportunity to telecom operators to exploit that cloud-ready transport network and their current infrastructure to efficiently satisfy network connectivity requirements from the services. This results in the telecom cloud, where a pay-per-use model can be offered to support applications and services requiring connectivity from the transport network.
Evolution towards cloud-ready transport networks, entails dynamically controlling network resources, considering cloud requests in the network configuration process. Hence, that evolution is based on elastic data and control planes, which can interact with multiple network technologies and cloud services. Although Elastic Optical Networks (EONs) can facilitate elastic network operations, orchestration between the cloud and the interconnection network is eventually required to coordinate resources in both strata in a coherent manner.
In this thesis, we study connectivity requirements from representative cloud-based services and explore connectivity models, architectures and orchestration schemes to satisfy them aiming at facilitating the telecom cloud.
The work here presented has been developed within the Optical Communications Group. This thesis continues, in part, the work developed during the PhD thesis of Dr. Alberto Castro.
1.2
Goals of the thesis
The main objective of this thesis is demonstrating, by means of analytical models and simulation, the viability of orchestrating DCs and networks to facilitate the telecom cloud.
Chapter 1- Introduction 3 G1 – Connectivity requirements for DC interconnection and services
This goal focuses on the study of a number of scenarios that require connectivity from the transport network. Specifically, we focus on studying DC federations, live-TV distribution, and 5G mobile networks.
G1.1 – Elastic operations in DC federations
This sub-goal focuses on the study of the connectivity requirements for elastic operations among DCs in DC federations, requiring huge capacity on-demand.
G1.2 – Services on the telecom cloud
This sub-goal is oriented to study services that can take advantage of telecom cloud and require stringent Quality of Service (QoS) requirements.
G1.3 – 5G mobile networks
This sub-goal focuses on the study of optical network-supported Cloud-Radio Access Network (C-RAN), where requirements in terms of QoS and bitrate guarantees are critical to ensure service.
G2 –Connectivity schemes
This goal focuses on studying different connectivity schemes, algorithms, and architectures aiming at satisfying the connectivity requirements from goal G1.
G2.1 – Dynamic and elastic connections
The objective of this sub-goal is to study polling-based models for dynamic inter-DC connectivity to facilitate elastic operations among federated DCs.
G2.2 – Transfer-based DC connections
This sub-goal focuses on studying a novel connectivity scheme where inter-DC connectivity can be delegated to the network operator.
G2.3 – Virtual network topology provisioning
The objective of sub-goal G2.3 is studying virtual network topology provisioning models to support services on telecom cloud requiring service-specific SLA parameters in terms of QoS.
G3 – Cross-stratum orchestration schemes
Goal G3 focuses on studying DC and network orchestration for a set of customers, each with its own SLA parameters, and requiring connectivity from the interconnection network.
Table 1-1 Thesis goals Goals
G1
Connectivity requirements for DC interconnection and services
G1.1
Elastic operations in DC federations
G1.2
Services on the telecom cloud G1.3 5G mobile networks G2 Connectivity schemes G2.1
Dynamic and elastic connections
G2.2 Transfer-based DC
connections G2.3
Virtual network topology provisioning G3
Cross-stratum orchestration schemes
1.3
Methodology
To carry out the studies presented in this thesis, the methodology illustrated in Fig. 1-1 was followed.
As the starting point of each study, an idea related to a thesis objective, is conceived. Then, due to the nature of this thesis’ goals, an optimization problem is devised and formally stated, i.e., mathematically formulated as a Mixed Integer Linear Programming (MILP). The mathematical model is then implemented in Matlab [MATLAB] and problem instances solved using IBM’s commercial solver CPLEX [CPLEX]. Because the realistic scenarios tackled in this thesis lead to large problem sizes in most of the studies, MILP formulations require long computation times; therefore, for those scenarios requiring very short computation times (e.g., once in operation or to manage dynamic connection requests) heuristic algorithms are required. To that end, once a MILP formulation is validated, an algorithm is designed. To run simulations, the algorithm is implemented in the event-driven
Chapter 1- Introduction 5
OMNeT++ [OMNETPP] simulator. Some works used the cloud management OpenNebula [ONEBULA] framework.
Next, the performance of the algorithm is evaluated as follows: first, its performance is compared against that of solving the MILP, and, if required, the algorithm is revised; then the performance of the algorithm is compared against a certain benchmark (e.g., other algorithms or the optimal solutions). Finally, relevant results are disseminated and considered as the conception of a new idea requiring further research.
Problem statement MILP formulation
(Matlab and CPLEX)
Algorithm design Algorithm implementation(C++)
Performance evaluation
Simulation (OMNeT++, OpenNebula)
Idea
Results analysis Dissemination
Fig. 1-1 Methodology.
1.4
Thesis outline
The remainder of this thesis is as follows:
Chapter 2 briefly introduces the main background related to EON, cloud computing, including DC federations and telecom cloud, as well as the basics on live-TV distribution, Radio Access Networks (RAN) and NFV.
Chapter 3 explores the related works relevant to the thesis objectives, such as elastic operations in DC federations, inter-DC connectivity, DC and networks orchestration, live-TV distribution, C-RAN, and virtual networks.
Chapter 4 studies elastic operations in DC federations (goal G1.1). To that end, this chapter presents the Elastic Operations in Federated DCs for Performance and Cost Optimization (ELFADO) problem, where federated DCs are orchestrated and workload in each DC is scheduled taking into account not only energy costs but also communication costs related to data migration among them. This chapter is based on the already published work [Ve14.1].
Chapter 5 studies live-TV distribution (goal G1.2) and C-RAN (goal G1.3) as services that can be deployed on telecom cloud. We explore architectures with different centralization levels and their impact on CAPEX for these services. In addition, this chapter summarizes connectivity requirements for DC interconnection resulting from these studies and the study in the previous chapter. This chapter is based on the already published work [As15.4] and the accepted paper [As16.3].
Chapter 6 proposes a cross-stratum orchestrator (CSO) (goal G3) and studies two dynamic connectivity models (dynamic and dynamic elastic) that allow DC operators to manage connection requests to Application-Based Network Operations (ABNO) architecture in charge of the interconnection network (goal G2.1). In addition, network capabilities to implement elastic operations on already established connections are analyzed. This chapter is based on the already published works [Ve13.1] and [As13.2]
Chapter 7 studies polling-based and notification-based models and motivates the need of transfer- based connections (goals G2.1 and G2.2). The Stochastic-ELFADO (STC-ELFADO) problem is presented and polling-based and notification-based models are studied to solve it. This chapter is based on the already published work [As15.1].
Chapter 8 proposes an Application Service Orchestrator (ASO) on top of ABNO (goal G3) and transfer-based operations for inter-DC connectivity (goal G2.2). Both ASO and transfer-based operations are studied in scenarios where the network operator is responsible for managing the interconnection between DCs while simultaneously fulfilling SLA of a set of customers. This chapter is based on the already published works [Ve14.2] and [As14.1].
Chapter 9 takes advantage of ASO on top of ABNO to study virtual network provisioning to support service-specific SLA parameters (goal G2.3 and G3). This chapter is based on the already published works [As15.2] and [As16.4].
3
Chapter 2
Background
In this chapter, we introduce the main concepts and technologies that serve as a starting point for the research work described in this thesis. Firstly, concepts related to cloud computing, such as virtualization, DC federations and DC architecture, and power model are reviewed. Then, the main concepts related to EON, flexgrid technology, provisioning, recovery and multilayer networks are introduced. Next, control and management architectures for DCs and optical networks are described. After that, the telecom cloud is introduced and the basics on live-TV distribution, future RAN to support 5G networks, and NFV-related concepts are presented.
2.1
Cloud computing
Cloud computing has transformed the IT industry shaping the way IT hardware is designed and purchased [Ar10]. DCs contain hardware and software to provide services over the Internet. Such services result in extremely dynamic workload mixes and intensities; therefore, dimensioning DCs is a challenging task: dimensioning DCs for the peak load can be extremely inefficient, whereas reducing its capacity might result in a poor QoS causing SLA breaches. In addition, the huge energy consumption of DCs requires an elastic resource management, e.g., by turning off physical machines (PMs) when they are not used or turning them on to satisfy increments in the demand.
In this section, background related to cloud computing and energy consumption in DCs is presented.
2.1.1
Virtualization
Thanks to virtualization, mixed workloads (e.g., web applications and high performance computing jobs) can be easily consolidated and performance isolated, their consumptions tailored and placed in the most proper PM according to its performance goals. By encapsulating jobs in Virtual Machines (VMs), a cloud resource manager can migrate jobs from one PM to another looking for reducing energy consumption (or some other OPEX objective) while ensuring the committed Quality of Experience (QoE). In addition, some web applications are encapsulated into VMs and replicated across DCs to keep services close to their users and for load balancing purposes; each replica generates some amount of data that need to be propagated to other replicas.
2.1.2
DC federations
Large Internet companies, such as Google or Microsoft, own their infrastructures that usually consist in a number of large DCs. These DCs, placed in geographically diverse locations, guarantee good QoE to users and are interconnected through a wide area network (WAN) [ZhVu13]. Using that scheme, those companies can move workloads among DCs to take advantage of reduced energy cost during off-peak energy periods in some locations (in addition to load balancing) while using green energy when is available in some other locations and turning off PMs when they are not used; thus, minimizing their energy expenditure.
Nonetheless, there exist a large number of smaller independently operated infrastructures, which cannot perform such elastic operations. Notwithstanding, those medium-size DCs can cooperate by creating DC federations [Go10] to increase their revenue from using IT resources that would otherwise be under-utilized, and to expand their geographic coverage without building new DCs.
2.1.3
DC architecture
The internal DC architecture has become crucial to deploy energy-efficient infrastructures. A certain number of switches is necessary to provide connectivity among servers in the DC and to interface the DC with the Internet. Consequently, according to the DC architecture being adopted, a corresponding power is consumed, basically dependent on the number and type of switches used. Among the various intra-DC architectures studied in literature (see [ZhAn13] for a detailed survey), the so-called flattened butterfly architecture has been identified as the most power-efficient DC architecture thanks to its power-proportional behavior, i.e., its power consumption is proportional to the number of currently used PMs. However, the most widely-deployed architecture for DC is the so-called
fat-tree topology [Fa08], which is based on a hierarchical structure, where large higher-order switches represent the interface of the DC towards the network
Chapter 2- Background 9
infrastructure and are connected to the servers via a series of lower-order switches providing the intra-DC connectivity.
In this thesis, we assume the fat-tree architecture (Fig. 2-1), which consists of three switching layers; from top to bottom: Core, Aggregation, and Edge.
Edge Switches Aggregation Switches Core Switches Servers
Cluster 1 Cluster 2 Cluster 3 Cluster 4
Fig. 2-1 Example of fat-tree DC architecture (M = 4).
The lower layers, aggregation and edge, together with the servers are organized in a number of clusters M. In each of these clusters, switches have M interfaces operating at the same bitrate. Each cluster has M/2 edge switches and M/2 aggregation switches, all with M ports; it constitutes a bipartite graph by connecting each edge to every aggregation switch. In each edge switch, M/2 ports are connected directly to servers and the other M/2 ports are connected to the aggregation switches. Thus, each cluster has M2/4 servers and there are M3/4
servers in total in the DC. In addition, there are (M/2)2M-port core switches, each
having one port connected to each cluster, whilst each cluster is connected to every core switch.
2.1.4
DC power model
Two main contributions to the power consumption of a DC can be distinguished: i) the power consumed by IT devices, PIT, which comprises both the servers located in the DC, as well as the switches employed to interconnect those servers; ii) the power consumption of the non-IT equipment, Pnon-IT, such as cooling, power supplies, and power distribution systems. Thus, total power consumption of a DC can be computed as PDC = PIT + Pnon-IT. PIT can be easily estimated by counting the number of servers and switches of a DC and computing their energy consumption according to their load. However, it is difficult to evaluate the power consumption of non-IT devices since it depends on several details and factors which cannot be easily estimated. For instance, the power consumption of the cooling system strongly depends on the geographical location of the DC and on the building hosting that DC.
An indirect way to estimate a numerical value for Pnon-IT is to consider the Power Usage Effectiveness (PUE) metric [GreenGrid]. PUE can be used as a measure of
the energy efficiency of a DC and quantifies the amount of power consumed by non-IT equipment in that DC: PUE = PDC / PIT. Therefore, if PIT and PUE can be estimated for a given DC, the total power consumed in a DC can be computed as
PDC=PUE·PIT.
Regarding PIT, we can distinguish between the power consumed by the servers and by network equipment. The power consumed by a server, Pserver(k), depends mainly on the CPU load (k) utilization, expressed as the ratio between the current load and the maximum capacity of the server. According to [Fa07], the power consumption of a server can be estimated as Pserver(k) = Pserver-idle + (Pserver-max - Pserver-idle)·k, where Pserver-idle and Pserver-max represent the power consumed by the server
when it is idle and when it operates at its maximum capacity, respectively. The power consumed by network equipment depends on the specific architecture of the DC.
We consider that clusters are active when one or more servers are loaded; otherwise the complete cluster is turned-off. Then, the power consumption of cluster i, Picluster, can be estimated as,
4 1 2 ) ( 2 M s i s server edge agg i i cluster P P P k M a P , (2.1)
where ai indicates whether the cluster is active and Pagg and Pedge denote the power
consumption of aggregation and edge switches. The power consumption of the IT devices in the DC can eventually be computed as follows, where Pcore denote the power consumption of core switches.
M i i cluster core IT
P
P
M
P
1 24
(2.2)2.2
Elastic optical networks
On the contrary to wavelength division multiplexing (WDM) fixed-grid networks, in which the spectrum width of optical channels is constant and equal for every connection (lightpath), in EON the spectral resources allocated to a connection may be expanded or reduced when the required bitrate of the connection increases or decreases.
2.2.1
Flexgrid technology
Among the technologies facilitating EON, flexgrid [Ji09], [Ji10], [Ge12] highlights as a potential candidate; flexgrid uses the flexible-grid defined in [G694.1]. According to [G694.1], the optical spectrum is divided into equally-sized frequency
Chapter 2- Background 11
frequency slices arbitrary-sized frequency slots can be created and allocated to lightpaths; thus, allowing to elastically adapt the allocated resources to the connections’ capacity requirements.
50 GHz
37.5 GHz 37.5 GHz
Frequency (THz) Frequency slice
(12.5 GHz) 50 GHz 37.5 GHz 75 GHz Frequency slot Allocated spectrum t t+1
Fig. 2-2 Example of flexible and elastic spectrum allocation.
Fig. 2-2 illustrates flexible and elastic spectrum allocation (SA), where resources to support three connections requiring 37.5 GHz, 37.5 GHz, and 50 GHz are allocated at a given time t. In the example, at time t+1, the resources allocated to support the connection in the middle, have been increased, from 37.5 GHz to 75 GHz, to satisfy the demanded capacity at that time.
In [G694.1], the nominal central frequency (CF) granularity, i.e., the spacing between neighboring CFs, is equal to 6.25 GHz.
Additional key technologies that are paving the way to devise novel EON architectures based on the flexgrid technology are:
The availability of flexgrid ready bandwidth-variable wavelength selective switches to build bandwidth-variable optical cross-connects (BV-OXC), in comparison with traditional optical cross-connects (OXC).
The development of advanced modulation formats and techniques, both single-carrier (such as k-PSK, k-QAM) and multi-single-carrier (such as O-OFDM), to increase efficiency and being capable of extending the reach of optical signals avoiding expensive electronic regeneration (known as 3R).
Bandwidth-variable transponders (BVTs) and multi-flow transponders (also known as sliceable BVTs, SBVTs) that are able to deal with several flows in parallel; thus, adding even more flexibility and reducing costs [Ji12].
2.2.2
Provisioning
Aiming at providing end-to-end (e2e) connectivity, connection requests (i.e., demands) to be served in the network need to specify some information such as source and destination nodes and required capacity. Then, similarly to the Routing and Wavelength Assignment (RWA) problem in WDM networks, the Routing and Spectrum Allocation (RSA) problem needs to be solved in flexgrid networks to find lightpaths. The objective of the RSA problem is to find the shortest route between source and destination nodes having a frequency slot with enough spectral resources to serve the required bandwidth to provide the capacity of the traffic demands, while satisfying the contiguity and continuity constraints of the spectrum.
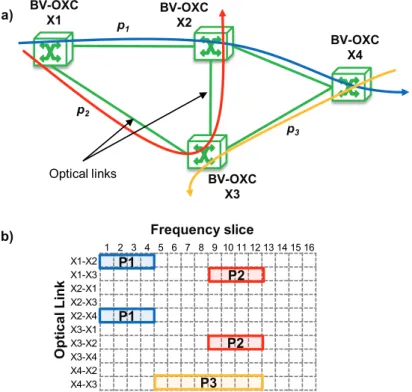
For illustrative purposes, Fig. 2-3 represents a 4-node flexgrid network with three lightpaths (a) and the spectral resources allocated to them (b). Lightpaths p1, blue line in the figure, from X1 to X4, and p2, red line in the figure, from X1 to X2, use 4-slice frequency slots; whereas lightpath p3, yellow line in the figure, from X4 to X3, uses an 8-slice slot. Note that, in all cases, slices are contiguous in a given link and slots remain continuous along links in the path.
BV-OXC X1 BV-OXC X4 BV-OXC X2 BV-OXC X3 1 2 3 4 5 6 7 8 9 10 11 12 13 14 15 16 X1-X2 X1-X3 X2-X1 X2-X3 X2-X4 X3-X1 X3-X2 X3-X4 X4-X2 X4-X3 Frequency slice Op ti c a l L in k p1 p2 P1 P3 p3 a) b) P1 P2 P2 Optical links
Chapter 2- Background 13
2.2.3
Recovery
Once in operation, established lightpaths may be affected by failures in the network’s physical resources. Aiming at reducing network failures’ impact on the service, recovery techniques based on disjoint paths can be applied. To that end, considering shared-risk link groups (SRLGs) [St01], [Li02], [Se01] allows to identify sets of resources that are affected by the failure of a physical resource in the network.
Among the different recovery techniques that are available in the literature, in this thesis we focus on partial protection and diversity techniques to guarantee certain portion of the bitrate in the event of a failure in a link in the network. In partial protection, two SRLG-disjoint paths are established: a working path and a protection path; the latter with enough capacity to satisfy the bitrate to be guaranteed [Gr04]. Another, option is diversity, where two SRLG-disjoint paths are set-up with a combined capacity to satisfy the one requested and being the minimum individual capacity equal to the one to be guaranteed.
Fig. 2-4 illustrates a scenario where lightpaths to support a 10 Gb/s connection are represented considering both partial protection and diversity techniques. In both cases, 5 Gb/s need to be guaranteed in the case of a single failure in any optical link. In the example, each optical link has been arbitrarily assigned to a SRLG; i.e., SRLG = {1}, {2}, {3}, {4} or {5}. When partial protection is considered, a primary path (working path pw) supports the 10 Gb/s connection, whereas a secondary path (backup path pb), SRLG-disjoint with the primary path, supports a 5 Gb/s connection in the event of a failure of a link in the route of the primary path.
When diversity is considered, two primary paths (pw and p’w), SRLG-disjoint between them, support jointly the required 10 Gb/s connection; in the example, each supports 5 Gb/s; thus, guaranteeing a 5 Gb/s connection in the case of a failure of a link in the route of pw or p’w.
{1} {3} Partial protection {2} {4} {5} pw pb 10 Gb/s 5 Gb/s {1} {3} Diversity {2} {4} {5} pw p’w 5 Gb/s 5 Gb/s SRLGs
Fig. 2-4 Example of SRLG-disjoint paths under partial protection and diversity.
2.2.4
Multilayer networks
Optical networks can be deployed to support IP-over- Multi-Protocol Label Switching (MPLS) [RFC3031] networks, referred to as IP/MPLS networks, on top.
A demand in the IP/MPLS layer is routed in the corresponding virtual network topology (VNT). A Label-Switched Path (LSP) between two IP/MPLS routers is set-up using virtual links, which in turn, are sset-upported by the corresponding lightpaths in the underlying optical network. Fig. 2-5 illustrates an IP/MPLS network over an optical network with an MPLS LSP established between IP/MPLS routers R2 and R3. In the figure, three virtual links can be identified in the IP/MPLS layer; i.e., virtual link between R1-R3, between R1-R2 and between R2-R4. In addition, for illustrative purposes, the lightpaths supporting those virtual links are depicted (red lines in the figure). Since routers operate in the electrical domain, transponders need to be used to convert signals from the electrical to the optical domain; BVTs and SBVTs can be considered when the underlying optical network is based on the flexgrid technology.
IP/MPLS Layer R1 R2 R4 IP/MPLS Router X1 X2 X3 X5 X4 R3 MPLS Virtual link MPLS LSP Optical network Lightpath
Fig. 2-5 Multilayer network.
2.3
Control and management architecture
2.3.1
Transport networks
Core network control architectures based on a centralized element such as the Path Computation Element (PCE) [RFC4655] are commonly used to control optical networks’ data planes.
Although in this thesis we assume a PCE on top of the control architecture, a Software Defined Network (SDN) controller would result in similar conclusions. The PCE includes, among others, routing algorithms, the LSP database (LSP-DB) and Traffic Engineering Database (TED). The LSP-DB stores information related to currently established connections, whereas TED stores the state of network resources. Fig. 2-6a represents a generic PCE-based control architecture on top of a transport network.
Chapter 2- Background 15
Among control architectures based on the PCE, the Internet Engineering Task Force (IETF) has recently standardized a centralized architecture referred to as ABNO [RFC7491]. ABNO is defined as an entity in charge of controlling the network in response to requests from the application layer or the Network Management System (NMS). The ABNO architecture consists of a number of functional elements, such as:
The ABNO controller receiving high-level requests and translating them into simpler operations that can be performed by other functional elements.
A policy agent which enforces the set of policies received from an NMS.
A PCE [Cr13] to perform path computation; in particular, an active stateful PCE is able to modify already established LSPs.
The LSP-DB and TED databases.
A provisioning manager, e.g., an SDN controller [ONF], in charge of implementing connections in the network.
An operations, administration, and management (OAM) handler that receives notifications from the network elements.
Databases TED LSP-DB AlgorithmsAlgorithms Algorithms PCEP server PCE Transport network Active Stateful PCE
Controller Policy Agent
Prov. Mngr (SDN controller) OAM Handler
Flexgrid-based network
ABNO
a) b)
Databases
TED LSP-DB
Fig. 2-6 Example of PCE-based control architectures.
Fig. 2-6b illustrates the ABNO architecture, including the elements described above, to control a flexgrid-based network.
2.4
Telecom cloud
Transport networks are currently configured with big static fat pipes based on capacity over-provisioning. The rationality behind that is guaranteeing traffic demand and QoS. The capacity of each inter-DC optical connection is dimensioned in advance based on some volume of foreseen data transference. Once in operation, scheduling algorithms inside cloud management run periodically trying to optimize
some cost function, such as energy costs, and organize data transferences. To avoid transference overlapping, which may eventually lead to performance degradation, some over-dimensioning is needed. Obviously, this static connectivity configuration adds high costs since large part of connectivity capacity remains unused in low periods.
Thus, demands of cloud services require new mechanisms to provide reconfiguration and adaptability of the transport network to reduce the amount of over-provisioned bandwidth; the efficient integration of cloud-based services among distributed DCs, including the interconnecting network, becomes then a challenge.
Cloud-ready transport network [Co12] was introduced as an architecture to handle this dynamic cloud and network interaction allowing on-demand connectivity provisioning.
Metro IP/MPLS Core Metro
Flexgrid Core Network Datacenter Flexgrid Core Network
Cost efficient high speed transmission up to 1Tb/s. Optical Cross-connect (OXC) Interconnection Node 1Tb/s variable transponder SDN (ABNO architecture) Cloud Management (IaaS) IP Network
Separated provisioning and maintenance in different segments (IP & Aggregation).
End-to-end MPLS solution to reduce OPEX
Users
Residential and business
Network-aware control Joint network & datacenter control and planning to optimize network and IT costs
Fig. 2-7 Architecture to support cloud-ready transport networks. Reproduced from [Co12].
Evolution towards cloud-ready transport networks entails dynamically controlling network resources, considering cloud requests in the network configuration process. Hence, that evolution is based on elastic data and control planes, which can interact with multiple network technologies and cloud services. Cross-stratum orchestration between cloud and interconnection network is eventually required to coordinate resources in both strata in a coherent manner. The reference architecture to support cloud-ready transport networks proposed in [Co12] is reproduced in Fig. 2-7. An ABNO architecture interfacing users (e.g., service-layer) and controlling a flexgrid network is assumed and communication between ABNO and the cloud management devised.
Chapter 2- Background 17
In addition to facilitate on-demand connectivity provisioning thanks to the cloud-ready transport network, the telecom cloud concept includes, among others, the ability to provide the infrastructure to deploy a service, e.g., taking advantage of current telecom facilities, such as central offices (COs), which can be used as DCs. Among the wide range of IP-based services requiring resources from the transport network and that could be deployed in a telecom cloud, in this thesis we focus on live-TV distribution and the evolution of Radio Access Network, referred to as RAN, towards a centralized approach to support 5G networks. The next subsections briefly introduce the main concepts related to them.
2.4.1
Live-TV distribution
Video signal distribution is one of the stringent and popular services that telecom networks need to provide. The bandwidth needed to convey a video stream is actually determined by its quality. In the live-TV broadcasting industry, uncompressed video streaming formats are used before the video is produced. Notwithstanding, stringent QoS is required since uncompressed video streaming in the 4K Ultra-High Definition (UHD) TV format ranges from 6 to 48 Gb/s, according to ST 2036-1 [ST2036-1]. In addition, 4K UHD digital cinema has been standardized and commercialized in the movie industry, and 8K quality is in the roadmap of some operators [Na11]; uncompressed real time 8K transmission needs 72 Gb/s connections.
Once the video has been produced, distribution to end-users is based on compressed video, which quality is adapted to the one that fits better the user’s device. Compressed streams for video distribution require up to hundreds Mb/s, depending on its quality, i.e., Standard Definition (SD), High Definition (HD) or UHD. Digital TV and online video are expected to show the higher penetration percentages among the residential services; in fact forecasts show that 79% of the global IP traffic will be related to video traffic by 2018 [VNI14].
2.4.2
Radio access networks to support 5G networks
The growth of mobile devices and the wide variety of services accessing the Internet highly contribute to the explosion of data to be conveyed [VNI13] not only between users’ devices but also between machines. As a result, an ever-increasing Total Cost of Ownership (TCO), which includes CAPEX and OPEX, is expected when traditional RAN architectures are considered. Aiming at reducing TCO, centralized RAN ([Li10], [CMR]) architectures were proposed to support next generation mobile networks.
Among the main factors contributing to CAPEX increase, highlight the new sites building, radio frequency (RF) and baseband hardware, and power and cooling
equipment acquisition. Factors contributing to OPEX increase are, among others, site rental and power consumption.
In traditional distributed RAN architecture, RF and baseband processing hardware is co-located in the cell site and not shared among different sites. In centralized RAN architectures, baseband processing in baseband units (BBUs) is not only separated from RF processing hardware, i.e., remote radio heads (RRHs), but also centralized and can be shared among different sites. Fig. 2-8 illustrates both distributed and centralized RAN architectures, showing that in distributed RAN, RF and baseband hardware are co-located in the site and not shared with other sites; whereas in centralized RAN, BBUs from different sites are co-located in the same BBU pool and can be shared among different RRHs along the time.
Distributed RAN Back haul Centralized RAN RRH RRH RRH Front haul BBU Pool RF Baseband RF Baseband RF Baseband S1/X2 CPRI S1/X2
Fig. 2-8 Distributed and centralized RAN architectures.
According to [Pf15], centralized RAN architectures can be implemented in the cloud, where virtualized BBU pools hosted in different central locations can be flexibly configured and serve RRHs from different virtualized BBU pools each time (in this thesis, we refer to this case as Cloud-Radio Access Network, C-RAN).
From the mobile core network perspective, considering Long-Term Evolution (LTE) or LTE-Advanced (LTE-A) RAN architectures, both distributed and centralized architectures require to interconnect base stations and their peering point through a backhaul network (e.g., and IP/MPLS network supported by WDM). In addition to backhaul connections transporting user and control data (S1 interface), interconnection among neighboring cells’ base stations may also be required (X2 interface). In current LTE RAN architecture, latencies in the order of tens of milliseconds are allowed in S1 interfaces, whereas for tight coordination schemes between base stations, delays below 1 ms are required in X2 interfaces.
Moreover, compared to distributed RAN, centralized RAN architectures require a fronthaul network aiming at providing connectivity between RRHs and BBUs in remote BBU pools and convey radio interface data. Among the different radio
Chapter 2- Background 19
interface protocols, Common Public Radio Interface (CPRI) [CPRI] is widely used. CPRI is a bidirectional protocol and its bitrate is constant and depends on the cell site configuration. Fig. 2-8 illustrates the logical links supporting S1 and X2 interfaces in both distributed and centralized RAN architectures and CPRI in the centralized approach. In LTE and LTE-A architectures, CPRI requires not only huge capacity (in the order of Gb/s and tens of Gb/s), but also strict delay constraints, i.e., round trip time (RTT) delay.
2.5
Network functions virtualization
Among the wide range of services over IP networks, those related to NFV are of particular interest. Expected NFV benefits are leading the research community and industry to explore network architectures and technologies to satisfy new challenges arising (see [GSNFV], [VeCo15]).
Based on the ABNO architecture and aiming at facilitating network resources virtualization to support NFV, the IETF is working on the Abstraction and Control of Transport Networks (ACTN) framework [Ce15]. The business model in the ACTN framework defines three key entities: customers, service providers, and network providers. Customers can request on-demand connectivity between their end-points (EPs) using a Customer Network Controller (CNC) to modify their virtual topology to satisfy service requirements, referred to as customer virtual network (CVN). Since network operators can act both as service and network providers, a generic landscape with two main actors is devised:
network operator, which owns the network infrastructure. Since the network operator controls the network infrastructure, is aware of resource availability, and is able to collect performance monitoring data, such as effective throughput and delay, and correlate them into QoS indicators; set of customers requiring virtual network services to connect EPs in geographically disperse locations, e.g., a Virtual Network Functions (VNFs) orchestrator requiring on-demand connectivity between DCs to implement service chaining among VNFs.
2.6
Conclusions
Relevant background related to cloud computing, EON, telecom cloud, and virtualization has been presented in this chapter. First, cloud computing concepts were introduced as well as architectural and energy consumption aspects related to DCs and DC federations. Next, EON was reviewed. Flexgrid technology was introduced as a promising candidate technology to support EON. Provisioning, recovery basics, and the main concepts related to flexible-grid and multilayer
networks were presented. Next, architectures to manage and control DCs and transport networks were reviewed. The telecom cloud was introduced and main concepts related to live-TV and RAN to support 5G networks were described. Finally, NFV was introduced.
3
Chapter 3
Review of the State-of-the-Art
In this chapter, the state-of-the-art related to the goals of this thesis introduced in Chapter 1 is reviewed. Relevant works that can be found in the literature are described and the niches that motivate the studies in this thesis are clearly identified.
3.1
Connectivity requirements for DC
interconnection, live-TV distribution and 5G
mobile networks
In this section, we describe relevant works related to elastic operation in DCs, approaches for live-TV video signal distribution in the telecom cloud, and recent research studies to facilitate 5G networks.
3.1.1
Elastic operations in DC federations
As described in Chapter 2, consolidation and load balancing techniques in DCs require VM migration among servers hosted within the same DC or in remote DCs. The authors in [Mi12], presented the details of VM migration aiming at providing dynamic resource management considering different goals, including consolidation and load balancing. For each goal, the main questions to address were described: when to migrate, which VMs to migrate and to where VM must be migrated. Among others, a periodic approach was discussed considering that a given DC, placed in certain region of the world, may be highly loaded during daytime hours, whereas during the night hours its load may be considerably lower. In addition, the idea of placing the VMs close to the users depending on the time of the day was
introduced. Consolidation was described as a technique that may result in energy savings. Although VM migration was mainly considered in local area networks (LANs), the authors described issues to be addressed when WANs are considered. Despite the limited bandwidth and high-latency of
![Fig. 2-7 Architecture to support cloud-ready transport networks. Reproduced from [Co12]](https://thumb-us.123doks.com/thumbv2/123dok_us/520628.2561320/39.892.137.756.411.762/fig-architecture-support-cloud-ready-transport-networks-reproduced.webp)