Empirical Data from Mobile and IP Telephony
Poul E. Heegaard
Member, IEEE
Abstract—Over the recent years enormous changes in the
telecommunication services, techniques, regulations and markets have taken place. However, even with many new exciting services the telephony service is still popular. This paper provides em-pirical traffic data and observations of telephony traffic patterns in mobile and IP telephony. They are presented and compared with old telephony patterns from Public Switched Telephone Networks (PSTN). The question is whether the characterization of telephony traffic should be reconsidered because new technology and markets might have changed the service and usage. How is the telephony usage patterns influenced by technology changes from fixed to mobile phones, changes in quality from fixed-line phone to mobile and IP telephone, changes in tariffs from usage based to flat-rate subscriptions, and appearance of alternative message based communication means?
This paper presents a comparison between recent mobile and IP telephony measurements and telephony measurement obtained nearly four decades ago. The traffic patterns are compared and significant changes in the daily and weekly traffic profiles are observed. In particular, the profile of international calls has significantly changed and does not resemblance any of the standard traffic profiles from ITU E.523. The busy hour call holding times are fitted a log-Normal distribution for domestic and Hyper-Exponential for international calls. Furthermore, the average call holding times show significant variations over the day in flat-rate subscriptions. Finally, the results indicate that the Short Message Service (SMS) seems to serve as a supplement to phone calls, in particular in the evenings, which might change call holding time distribution and traffic intensities.
I. INTRODUCTION
Our society is increasingly dependent on high quality and reliable communication services. New services and communi-cation means appear in the market, but still the traditional com-munication service telephony is popular. However, many things have changed compared to the traditional, circuit-switched Plain Old Telephone Service (POTS). The communication technology is changing (VoIP, GSM, GPRS), the users and terminals are mobile, the terminals are changing (cell phones, IP based soft phones), the codecs and speech quality are changing, the tariff profile is changing (flat-rate subscriptions), the economy and market are changing, and a variety of other communication services is appearing (email, SMS, MMS, chat). When evaluating a service like telephony it is very important to be able to correctly characterize it. Furthermore, to do proper traffic engineering, traffic planning and modeling, and traffic forecasting, in-depth knowledge of the traffic pattern is still very important. An important question is whether the
Manuscript received December 17, 2007. This paper was presented in part at the 7th International Conference on Next Generation Teletraffic and Wired/Wireless Advanced Networking (NEW2AN) 2007.
P. Heegaard is with the Norwegian University of Science and Tech-nology (NTNU), Department of Telematics, Trondheim, Norway, (email: [email protected])
characterization of telephony traffic should be reconsidered because new technology and markets might have changed the service and usage.
The traffic engineering in ITU-T [1], [2] E-series recom-mendations include four major tasks; traffic demand character-ization, grade-of-service (GoS) objectives, traffic control and dimensioning, and performance monitoring recommendations. In Figure 1 the interrelations between these traffic-engineering tasks are given. Traffic control and dimensioning take input from traffic demand characterization and the grade-of-service specification. The performance monitoring is required to check if the grade-of-service objectives are fulfilled and to provide input to refinement of the traffic demand characterizations and to the traffic control and dimensioning processes. In this paper the focus is on empirical traffic measurements and how the observations might influence the traffic modeling assumptions, for instance the assumptions accepted by ITU and applied in E.490.1. ! "! "#$%#!&'()!*)+,-).!/-.01--23! #$! #%&'()*!$%)+(),-./%! $01#! $2345/!0'5&/6%7!1%4%86(.%!#%&'()*! 9(0! 92-45&:!(+!0%);5/%! 00!#(<=! 05>.-445.>!0:?&%,!#(<=! 01$! 05>.-4!1)-.?+%)!$(5.&! @$1! @.5;%)?-4!$%)?(.-4!1%4%/(,,2.5/-&5(.! ABC! A%-)4:!B%8)%?%.&-&5;%!C-42%! 4! 56789!:96;;<(!'=><=''9<=>!:6?@?! 165?!B%/(,,%.7-&5(.!(.!&)-++5/!%.>5.%%)5.>!/-.!3%!/4-??5+5%7!-//()75.>!&(!&6%!+(2)!,-D()!&)-++5/! %.>5.%%)!&-?*?E! F! &)-++5/!7%,-.7!/6-)-/&%)5G-&5(.H! F! I)-7%!(+!0%);5/%!JI(0K!(3D%/&5;%?H! F! &)-++5/!/(.&)(4?!-.7!75,%.?5(.5.>H! F! 8%)+(),-./%!,(.5&()5.><!
16%! 5.&%))%4-&5(.! 3%&'%%.! &6%?%! +(2)! &-?*?! 5?! 5442?&)-&%7! 5.! L5>2)%! M<! 16%! 5.5&5-4! &-?*?! 5.! &)-++5/! %.>5.%%)5.>! -)%! &(! /6-)-/&%)5G%! &6%! &)-++5/! 7%,-.7! -.7! &(! ?8%/5+:! &6%! I(0! J()! 8%)+(),-./%K! (3D%/&5;%?<! 16%! )%?24&?! (+! &6%?%! &'(! &-?*?! -)%! 5.82&! +()! 75,%.?5(.5.>! .%&'()*! )%?(2)/%?! -.7! +()! %?&-345?65.>!-88)(8)5-&%!&)-++5/!/(.&)(4?<!L5.-44:N!8%)+(),-./%!,(.5&()5.>!5?!)%O25)%7!&(!/6%/*!5+!&6%! I(0!(3D%/&5;%?!6-;%!3%%.!-/65%;%7!-.7!5?!2?%7!-?!-!+%%73-/*!+()!&6%!(;%)-44!8)(/%??<! !"#$%"&'(%& 1)-++5/!/(.&)(4? P5,%.?5(.5.> A'9;89B6=('!B8=<:89<=> #96;;<(!(8=:98C?!6=D!D<B'=?<8=<=> #96;;<(!D'B6=D!(E696(:'9<F6:<8= G96D'!8;!?'9H<('!8I7'(:<H'? 1)-++5/ ,(7%445.> 1)-++5/ ,%-?2)%,%.& 9(0 )%O25)%,%.&? 1)-++5/ +()%/-?&5.> Q.7R&(R%.7 I(0!(3D%/&5;%? S44(/-&5(. &(!.%&'()*!/(,8(.%.&? $%)+(),-./% ,%-?2)%,%.&? ! J<>K9'!.0*)+,-).!L!#96;;<(!'=><=''9<=>!:6?@?!
How is telephony usage patterns changed under recent technology
and market changes?
Figure 1. Traffic-engineering tasks from ITU E.490.1 [1]
There exist a lot of publications on measurement methods, on traffic model parameterization, tons on data traffic mea-surement with focus on the packet level, and some on the session level. However, fewer measurements are reported the last decade on the telephony service usage. The question in this paper is therefore if the observations from the previous measurements are still valid, or if the traffic patterns have changed as a consequence of the changes in conditions. The focus is on the traffic demand characterization and potential impact on traffic control and dimensioning of e.g. call control servers, mobile channels, or PSTN gateways, from observed changes in the traffic patterns. The evolution of traffic patterns is discussed relative to the basic assumptions made in the traffic engineering recommendations. The paper extends the
1845-6421/08/7176 © 2008 CCIS
results in [3], [4]. In Section II the measurement data is described. Except for parts of the IP telephony usage, the available data have coarse time granularity, are highly ag-gregated and biased with a scaling factor, which limits the statistics that can be obtained. Therefore Section III contains traffic characterizations that mainly focus on the daily and weekly variations in the IP and mobile telephony service usage compared with almost 40-year-old observations. This includes variations in traffic intensities, how the average call holding time changes, and how standard traffic demand profiles in the ITU-T recommendations compare with the profiles observed in the IP telephony measurements. The section also includes a model fit of the call holding time distribution of domestic and international IP telephone calls. In Section IV variations in SMS usage are compared to the number of calls. Concluding remarks and further work are given in Section V.
II. TRAFFIC MEASUREMENT DATA
The traffic measurements in this paper are all from the telephony service usage. Such measurements have been con-duced for many years. The paper uses early computerized measurements as the reference point for comparisons against the measurement of IP and mobile telephony. More specifi-cally, the paper compare against the Holbæk (Denmark) [5] and CARAT (Norway) [6] measurements obtained more than three decades ago. The telephony service was then provided on analogue PSTN exchanges with no terminal mobility.
The old measurements are from Norway and Denmark while the recent measurements are from Norway. To give some background for the numbers, Figures 2 and 3 include character-istics of the evolution in the Norwegian Telecom Market from 1970 to 2006 [7]. The market has grown dramatically from 1970 when only 20% of the population had Public Switched Telephone Network (PSTN, fixed-line) telephones to 2006 where the total number of subscriptions is much larger than the population size (160%). The number of mobile subscriptions did outgrow the number of fixed-line subscriptions almost ten years ago. The mobile market share was 67% in 2006. In addition, IP-telephony, also called broadband telephony, is gaining increased market shares (5% in 2006). From the trends in the total traffic volume shown in Figure 3 the volume of mobile telephony is expected to be larger than the PSTN in the near future.
The first new set of measurements includes IP telephony data that are extracted from Call Detail Records (CDR). The data set was made available byTelio, a Norwegian IP telephony provider. The CDR-data consists of approximately 1 million outgoing VoIP entries all originated in the IP network, and terminated in the PSTN. This means that it contains no details of the IP layer performance. The IP data set, I, consists of records,Ik ={ts, tc, d}, that contains information about the k’th call session including;
• ts- the start time, i.e. the time where the call is connected
and the billing (if any) can start and an entry to the CDR is created,
• tc- the call holding time (the duration of a call) which
does not include the call setup and disconnection times
!!"# $!"# %!"# &!"# '!"# (!!"# ($!"# (%!"# (&!"# ()*!# ()*+# ()'!# ()'+# ())!# ())+# $!!!# $!!+#
More than one subscription per inhabitant
More mobile than fixed line subscriptions
Total subscriptions
Mobile
IP telephony PSTN
Figure 2. Evolutions in telephony subscription market shares in Norway.
!" #" $" %" &'" &(" &)" '&" !*" &!*" '!*" #!*" +!*" (!*" $!*" ,!*" )!*" %!*" &!!*" &%%%" '!!!" '!!&" '!!'" '!!#" '!!+" '!!(" '!!$" Traffic volume of mobile phone approaches PSTN PSTN IP telephony Mobile Minor variations in traffic volumes
speech minutes [millions]
Figure 3. Relative telephony speech minutes in Norway the last 8 years.
but is the time from the start time until the connection is closed and the CDR entry is filed, and
• d - the terminating region (d=Domestic, Europe, USA,
Asia, Africa, Australia) in the PSTN.
The data were collected in July 2005 for one full month. The majority of the users is residential users. The CDR does not include the IP-IP traffic, which at that time was approximately 4% of the total number of calls. The time granularity of the CDR records is in seconds for parts of the calls, which makes it very imprecise to investigate the distribution between call start times because several calls will be logged with the same start times.
The second measurement set is provided by Netcom, a Norwegian mobile operator. The data set contains hourly records from a small number of mobile stations in Norway. The data are anonymous both with respect to the originating and terminating numbers, identity and position of base stations. The data are scaled with an unknown factor in order not to reveal any details about the absolute traffic volumes of the operators. The mobile GSM data set, M, consists of records
Mk = {b, t, nl, e, nc, nh, ns} that contains aggregated and
scaled information at k’th hour including; • b - base station identity (anonymous), • t - time of logged record,
• e- traffic volume in Erlang, • nc - number of calls,
• nh - number of handovers calls, • ns- number of SMS messages.
The data were collected over a two-weeks period in Sept 2005. The details in the loss ratio (which is very low) and the handover rate (approximately 2 handovers per originating call) are not discussed in this paper. The mobile data is aggregated and scrambled, i.e. a controlled bias is introduced to the data. This means that no distributions can be investigated and all traffic trends and profiles must be relative and not absolute.
III. TRAFFIC DEMAND CHARACTERIZATION
As briefly discussed in the introduction this paper focuses on the traffic demand characterization of the traffic engineering tasks. The traffic characteristics include
• traffic intensities and variation, i.e. the number of calls
per time unit and the variation over the day and the week,
• average call holding times and distribution, i.e. the
aver-age duration of a call and how it varies over the day for different call types, and how the busy hour call holding times are distributed,
• traffic demand profiles, i.e. how the traffic volumes [in
Erlang] varies over the day and the week.
The traffic characterizations in this section are based on the empirical data from the traffic measurements described in Section II. In Section III-A the results from daily and weekly variations in traffic intensities are presented and discussed. Section III-B shows how the average call holding time changes, and proposes a model for the busy hour call holding time distribution for domestic and international IP telephony calls. Finally, Section III-C compares the standard traffic demand profiles in the ITU-T E.523 recommendations with the profiles observed in the IP telephony measurements, in particular for international calls.
A. Traffic intensities and variation
It is quite common in traffic modeling to assume that the call arrival process is a time-homogeneous Poisson process. It is mathematically convenient, can be justified by Palm-Kintchine theorem, and has been confirmed by many previous measure-ments (e.g. the Holbæk measuremeasure-ments [5], also included as examples in Iversen’s textbook on teletraffic theory [2]). It is well known that the arrival process is time-inhomogeneous since the intensity is varying as a function of time of day, day of week, and week of year. However, in most cases it can be considered to behomogeneousin quasi-stationary time periods of 20-30 minutes (e.g. in the busy period). The traffic intensity measurement principle in E.500 [8] assumes that both the arrival and departure processes are stationary in the observation period.
Daily life cycles of the users and subscribers are the main cause of variations in the traffic intensities. This was also observed in [5], [9] where the traffic in the business areas was decreased at lunchtime (noon, 12:00) and at office closing hours. In residential areas the traffic was increased after dinner-time (17:00) and decreased when the television news broadcast
was on (20:00) [6]. Daily variations are also observed in IP and mobile telephony; Figure 4 shows the variations in the arrival intensities observed in the Holbæk measurements compared against the IP and mobile traffic intensities. The arrival intensity is averaged over 15 minutes periods for the IP telephony and in the Holbæk measurements, and over 60 minutes periods for the mobile telephony measurements. The arrival processes have a daily profile with peak intensities at different time of day for all three categories, and they are all different from the previous POTS measurements. The IP
domestic peak arrival intensity is at 12:00, mobile traffic at
15:00, and IP internationaltraffic at 22:00. Furthermore, it is observed that the arrival intensity for all traffic types drops to almost zero at nights, even for international traffic where the destinations might be in different time zones. The reason is probably that most of the international destinations are in Europe (belonging to almost the same time zone), and that the data in the IP data set I only contains calls originated in Norway.
Figure 4. Variations of number of calls in IP telephony compared to the
Holbæk-measurements (1969) [5].
The main observation from this section confirms previous measurements that the arrival intensity varies as a function of time of day and day of week (the results are not included here but confer the traffic volume profiles in Section III-C), and that the profiles and peak hours are different for domestic and mobile, and international calls. This must be carefully considered before assuming a time homogeneous Poisson process in a traffic model where mixture of domestic and mobile, and international calls is expected.
B. Call holding times and distribution
The call holding time distribution is commonly assumed to be Exponential with a constant arrival intensity. The Erlang and Engset loss formulae does not require this since they are insensitive to the holding time distribution [2], but it is mathe-matically convenient for other metrics. Previous measurements have shown that the assumptions do not hold. Although the average value varies over the day, in busy our dimensioning the constant intensity assumption is realistic. However, the empirical call holding time distribution tends to significantly deviate from the Exponential distribution. Other distributions
like Hyper-exponential, Weibull, (Log)Normal have been ap-plied [2]. E.g. in [10], it was shown that mixtures of Log-Normals fit the call holding time better than the Exponential. Typically, the model distribution is fitted to the busy hour of the empirical distribution. More recent measurements from mobile systems focus less on the call holding time, and more on the channel holding times in the base stations. This includes both new calls and handover of calls from neighboring base stations. The arrival process of channel allocation in mobile cells [11], [12], and the channel holding time distribution [12], [13], [14], is similar to the call arrival process and holding time distribution and the daily and weekly variations follows similar patterns. In recent IP telephony (VoIP) measurements the main focus on how the IP packet drops affects VoIP session performance quality (see e.g. [15], [16], [17]), which means that they focus on the IP packet level and packet sessions, and less on the IP telephony service level.
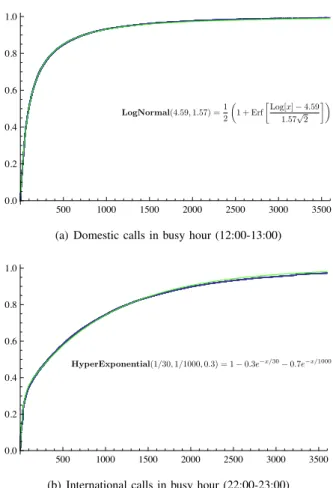
The IP data set, I contains details about individual call
holding times recorded with granularity of seconds, and in-formation about the destination domain of the call. Figure 5 shows the empirical cumulative density function (CDF) for the call holding times for domestic and international IP telephony calls in the busy hours periods. The busy hours are at 12:00-13:00 and 22:00-23:00 for domestic and international calls, respectively. The figure includes the parametric stochastic models for both cases, which in this case turned out to be Log-Normal for domestic and Hyper-Exponential for international calls. The CDF and corresponding parameters are given in the figure. The CDFs of the model and empirical data are close and hardly distinguishable.
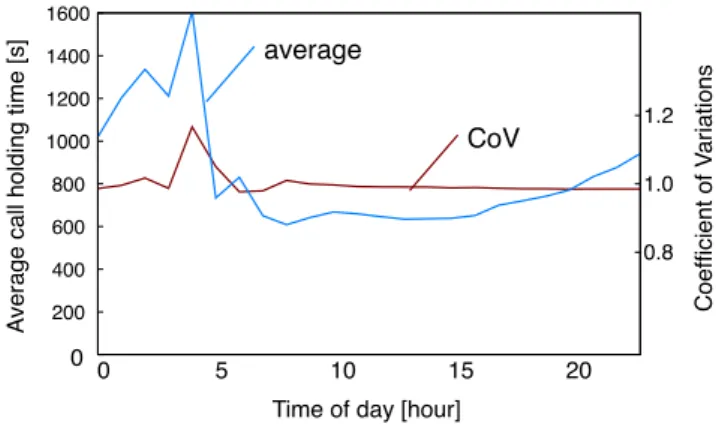
Compared to previous measurements it can be seen in Figure 6 that the average call holding time is significantly lower during the daytime than at evenings and nights. As can be observed from the coefficient on variation in Figure 7 the accuracy of the average call holding time is not significantly changed over the day. Hence, the variation in the average call holding times is not due to inaccuracy, but more likely can be explained by the fact that the IP data set I contains a significant number private calls and some calls to destinations in other time zones than Norway. The variation in average call holding times to the same extent was not observed in Holbæk [5] where the amount of private international calls was much lower, mainly due to the high tariffs, but also partly because there were fewer people traveling abroad a few decades ago.
In Figure 8 the average call holding times for flat-rate sub-scriptions (“IP domestic->PSTN” and “IP Norway->Europe”), and for usage based subscriptions (“IP->mobile”, “IP Norway->USA”, and “mobile->*”) are given. The plots show how the average values vary over a 24-hour period. The average values from the IP data set I are measured over 15 minute periods, while in the mobile set M they are averaged over 60-minute periods. It can be observed that the call holding time is sensitive to tariffs. This was also observed in [9] where a reduction in the traffic was caused by decreased average call holding times due to a tariff increase. Furthermore, differentiation in tariff caused significant increase in traffic every evening when the tariff rate was reduced (at 17:00).
500 1000 1500 2000 2500 3000 3500 0.0 0.2 0.4 0.6 0.8 1.0 LogNormal(4.59,1.57) =1 2 ! 1 + Erf "Log[ x]−4.59 1.57√2 #$
(a) Domestic calls in busy hour (12:00-13:00)
500 1000 1500 2000 2500 3000 3500 0.0 0.2 0.4 0.6 0.8 1.0 HyperExponential(1/30,1/1000,0.3) = 1−0.3e−x/30−0.7e−x/1000
(b) International calls in busy hour (22:00-23:00)
Figure 5. Empirical data plotted with parametric stochastic models for the cumulative call holding time distribution function (CDF)
100
Time of day [hour]
[average call holding time]
Figure 6. The daily variation in the average IP telephony call holding times compared with the Holbæk measurements (1969) [5].
Several factors are discussed the might impact the call holding time;
• Tariffs - if the price depends on the length of the call
(usage based minute price), then the call will be shorter than if it is not (flat-rate or paid by someone else). From Figure 8 it can be observed that the call holding times are rather constant during daytime for all categories, but that a significant increase can be observed at evenings and nights for flat-rate categories. For categories with usage based minute pricing the average call holding times are rather constant over a 24-hour period. The impact of tariffs was also discussed in [9] where the effects of
0 200 400 600 800 1000 1200 1400 1600 0 5 10 15 20 1.2 1.0 0.8 A
verage call holding time [s]
Time of day [hour]
Coeffi
cient of V
ariations
average
CoV
Figure 7. Call holding time of international calls with average and coefficient of variations (CoV). 0 200 400 600 800 1000 1200 1400 1600 0 5 10 15 20 A
verage call duration [s]
Time of day [hour] IP Norway->Europe
IP Norway->USA IP domestic->PSTN
IP->mobile mobile->*
Figure 8. Daily variation in call holding time [“origination”->”termination”].
differentiated tariffs were studied.
• Quality - if the speech quality decreases then the call
holding times will decrease. The speech quality is reduced for mobile and IP telephony compared to PSTN. However, no difference is observed in the average call holding times in Figures 6 and 8 that can confirm this hypothesis. The speech quality is most likely sufficient in all technologies included in this paper, at least given the price and the nature of the call. It is also likely that other factors like price and user behavior dominate the call holding times.
• Time- if the communicating parties have spare time for
conversations the call will be longer than if they are in a hurry. In Figure 8 it is clear that when the price does not play a role (in the case of flat rate), the holding times increase significantly at evenings and nights where people tend to have more time to talk than during a busy day. Even in the Holbæk measurements reproduced in Figure 6 an increase in the holding times was observed in the evenings [5].
• Nature of call - if a call addresses important and/or
difficult issues then the call will be longer than a call with short messages, at least when the caller and callee are busy. This is not possible to extract this information from the measurements in this paper.
• Economy and market- if economy and market
penetra-tion increases more money is spent on communicapenetra-tion services simply because they are more affordable and there are more common and more people can be reached (because everybody has a telephone now). Unfortunately, the total traffic volume in Figure 3 starts in 1999 where each Norwegian on average had at least one subscription. It is therefore diffult to say anything definite about the importance of relationships between tariff, welfare, and market maturity without more indepth in depth economet-ric statistics. What we can see is that since Norway has 100% telephony coverage the total yearly traffic volume [million minutes] has been almost unchanged.
• Demography - if demographic and cultural differences
are observed this will be reflected in the speech patterns and the call holding time distribution. Unfortunately, this cannot be studied in the IP data sets in this paper because no detailed demographic information can be related to the data sets. The call holding times for USA and Asia are probably predominated by the tariffs and potential impact of cultural differences cannot be seen. It should also be noted that the calls in the IP data set I is originated in Norway, and it is highly likely that many of the terminations will be Norwegians (same culture) staying abroad.
C. Traffic demand profiles
The traffic variations over the day, weeks and seasons, are mainly determined by the changes in the user’s context and demand for communication. It is interesting to see if and how the traffic variation has changed since the measurements in [5], [6], [9]. The changes in the traffic as a function of time of day from the IP data set I records are given in Figure 9 for domestic IP telephony calls (within Norway), and for international IP telephony calls. More than 83% (in traffic intensity [Erlang]) of the international terminations are to destinations in Europe, approximately 15% are to destinations in the US, and less than 2% are to destinations in the rest of the world. The figure gives no absolute numbers but plots the average over 31 days and how the average varies in 15 minutes intervals over a day. For readability accuracy measures are not included in the figures but it would not have changed any of the trends that are observed. Figure 9 also includes the daily mobile phone traffic variations from theMrecords. The Erlang values in the plots are scaled with a random value, but the variation in volume as a function of time of day is correct. The traffic variations in IP and mobile telephony are compared with PSTN telephony measurements from CARAT [6]. In Figure 10 the weekly variation in traffic for mobile and IP telephony is given, where the IP telephony traffic is subdivided according to region of termination (Europe and USA).
The CARAT measurements were collected at a time when the telephony service was expensive, when most people had regular working hours, and Norway had only one television broadcast channel with only one news broadcast in the evening (20:00). In [5], [6] peaks were observed at 10 and 14 with a decrease around lunchtime (noon in Norway). In the domestic IP telephony peaks are observed at noon (12:00) and late
Lunch break mobile telephony (scaled) IP telephony, interational IP telephony, domestic Dinnertime CARAT
Time of day [hour]
08 10 12 14 16 18
00 02 04 06 20 22 00
News broadcast (once every everning)
traffi
c [Erlang]
Figure 9. Comparison of daily traffic variation in CARAT [6] and recent IP and mobile telephony measurements [Erlang].
00 12 00 12 00 12 00 12 00 12 00 12 00 12 00 Sunday Saturday Friday Thursday Wednesday Tuesday Monday IP domestic Mobile (scaled) Norway->Europe
Time of day [hour] Norway-> USA [weekday]
traffi
c [Erlang]
Figure 10. Weekly variation in mobile calls, domestic IP telephony calls,
and international IP telephony with termination in Europe or USA [Erlang]
evening (22:00). This might be due to the fact that a significant number of the subscribers in the IP data setI are residential (private).
From Figure 9 it is observed that international calls con-tribute significantly to the overall traffic with a peak volume approximately at the same level as domestic traffic. Approxi-mately 83% of the international calls are terminated in Europe (the majority has same time zone) so the increase is not mainly due to time differences but probably an effect of type of call (private) and nature of call (e.g. family affairs), see also discussions of call holding times in Section III-B. The mobile traffic has its main peak between 12 and 16 and a significant decrease in the late evenings.
Compared to the recent traffic it can be observed that the communication, and probably also the working habits, have changed; e.g. the busy hour in mobile telephony is in the afternoon and no effect of the lunch break is observed. This might have a technical explanation since the users now bring their terminal (the phone) with them for lunch, which was previously impossible.
Figure 10 shows the variation in the traffic volume for IP domestic, mobile and IP international calls. The mobile traffic shows a well-known, typical business area profile with almost the same pattern from Monday to Friday with a significant decrease at weekends. Similar profile is not observed for the IP telephony traffic where the total traffic only slightly decreases at Friday, a bit more on Saturday, but the rest of the week is approximately at the same level. Observe in particular that
the international traffic pattern is almost insensitive to the weekdays.
Compared to the E.523 recommendation [18], the standard
traffic profiles for international traffic streams is different. In
Figure 11 the daily variation in traffic demand for international calls in IP telephony are plotted against the traffic demand of international calls as the time difference between originating and terminating parties varies. The IP international is rescaled (plotted relative to the peak volume) and divided in termina-tions in Europe with at most one-hour time difference, and terminations in USA with 6 to 9 hours time difference. The peak hours of the international traffic are late evening for both the European and American terminations independent of the time difference and do not resemblance any of the standard traffic profiles from E.523. A possible explanation to this is that the traffic measurements include only calls with origination in Norway, and that they are all private customers.
2 Fascicle II.3 - Rec. E.523
2 Fascicle II.3 - Rec. E.523 2 Fascicle II.3 - Rec. E.523 2 Fascicle II.3 - Rec. E.523
to USA (6-9 hours) to Europe (0-1 hours) no time difference 2 hours 4 hours 8 hours 10 hours 6 hours 12 hours
Figure 11. Standard hourly two-way traffic distribution patterns, extract
from [18]. This is compared to the one-way (rescaled) IP international traffic originated in Norway and terminated in Europe (0-1 hour time difference) and USA (6-9 hours time difference).
IV. SHORT MESSAGES(SMS)
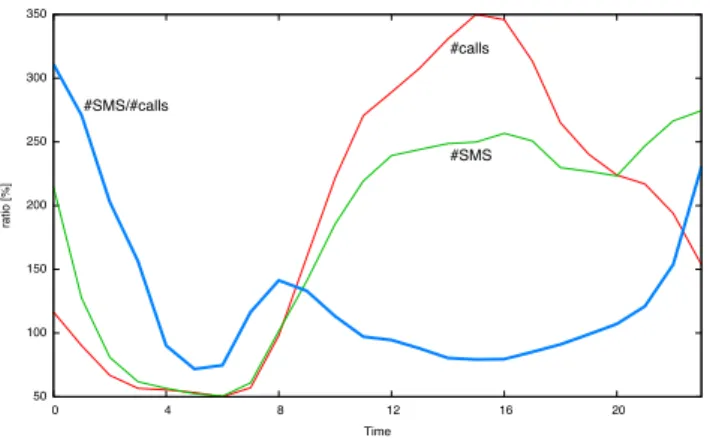
The success of the Short Message Service (SMS) has been tremendous. In 2005 the average number of SMS messages was approximately 1000 per year per registered customer in Norway [19], or approximately three messages per day per customer. From 2005 to 2006 an increase in the number of messages of 13% is observed [7]. This is approximately the same as the number of calls made per customer .
Hence, the SMS is a popular service that serves as a complement and supplement for the (short) phone calls. Based on in the mobile data set M, Figure 12 plots the number of calls, nc, the number of SMS messages, ns, and the ratio
between them,ns/nc, as a function of time of day.
On average the ratio ns/nc between the number of SMS
50 100 150 200 250 300 350 0 4 8 12 16 20 ratio [%] Time #calls #SMS #SMS/#calls
Figure 12. The ratio between SMS messages and calls over a day
00 18 12 06 00 18 12 06 00 18 12 06 00 18 12 06 00 18 12 06 00 18 12 06 00 18 12 Sunday Saturday Friday Thursday Wednesday Tuesday Monday ratio [%] Time # calls # SMSs SMS/call ratio
Figure 13. The ratio between SMS messages and calls over a week
100%, i.e. one call per message. However, significant dif-ferences are observed in the daily profile of nc and ns, in
particular in the evenings. The number of callsdecreasesin the evenings while the number of SMS messages increases. The rations/ncincreasescorrespondingly at evenings and reaches
its maximum value (>300%) at midnight. The different profile of nc and ns is an indication of that the SMS supplements
or substitutes the phone calls in the evenings. This confirms the intuition that since the SMS is asynchronous means of communication, this is considered to be convenient in evenings and at nights when you are afraid of disturbing the callee (B-party). It is also likely that the SMS messages are substituting short calls with a single message or question. A detailed study of the call holding distribution, in particular for holding times close to zero, would have provided more insight to this. Unfortunately, the data in M is too aggregated for such an investigation. The weekly variations of the rations/nc shown
in Figure 13 have a lower peak at Fridays and Saturdays. Maybe people are less afraid of disturbing the callee late Friday or Saturday evening than the rest of the week? Or is it simply because youngsters uses SMS more frequently at Fridays and Saturdays to get together for social events? Unfortunately, the data provided does not give any insight in this.
V. CLOSING REMARKS
This paper presents a comparison between recent mobile and IP telephony measurements and telephony measurement obtained nearly four decades ago. From the results it is obvious that the traffic pattern has changed over last decades. There are several potential reasons for this but only a few of them have been possible to assess in this paper given the limitation in the available data sets. In this paper the main contribution is qualitative evaluation of recent telephony patterns compared to previous, well known, and frequently used patterns. It seems that, not surprisingly, if the price depends on the length of the call (usage based minute pricing), then the call will be shorter than if it is not (flat-rate or paid by someone else). Furthermore, asignificant increasecan be observed at evenings and nights for flat-rate categories. For usage based pricing the average call holding times are rather constant over a 24-hour period. In flat-rate subscriptions it is observed that call holding times increase significantly at evenings and nights when people have more time to talk. It can also be speculated how bad speech quality, how importance of a call, how economy, market, demographic and cultural difference will be reflected in the speech patterns and the call holding time distribution. Unfortunately, neither of this could be studied in the current data sets due to short measurement period, aggregation of single calls and call categories, scaling of values, and coarse time granularity.
The traffic intensities are still varying over the days and weeks (the data sets were to limited to observe seasonal variations) although different from previously observed vari-ations. But, (quasi)-stationary periods can still be identified as required in the ITU-T traffic engineering recommendations. Furthermore, the average call holding times show significant variations over the day and is much higher late evenings than during the day, and call holding times does not fit exponential distribution but can be modeled with Log-Normal Hyper-Exponential distributions. The international traffic demand profile of the IP telephony is significantly different from the standard traffic profiles in the ITU-T recommendations.
The Short Message Service (SMS) is an asynchronous means of communication of great popularity. The number of messages per user is approximately the same as the number of calls. The message and call intensities over the day have different profiles and show that SMS is more popular at evenings and nights compared to telephony. It is expected that this is because SMS is asynchronous means of communication that is convenient in evenings and at nights when you are afraid of disturbing the callee (B-party). It is also likely that the SMS messages are substituting short calls with a single message or question.
To give a more comprehensive explanation of the traffic pattern variations additional details about the arrival- and departure processes, and the mixture of users (e.g. business vs. residential) are required, and more detailed measurements with finer granularity must be collected in order to conduct in-depth statistical investigations.
REFERENCES
[1] ITU: Overview of recommendations on traffic engineering. ITU-T Recommendation E.490.1 (2003)
[2] Iversen, V.B.: Handbook in Teletraffic engineering. ITC / ITU-D (2005) [3] Heegaard, P.E.: Evolution of traffic patterns in telecommunication systems. In: ChinaCom - International Conference on Communications and Networking in China, Shanghai, China (2007)
[4] Heegaard, P.E.: Empirical Observations of Traffic Patterns in Mobile and IP Telephony. In: The 7th International Conference on Next Generation Teletraffic and Wired/Wireless Advanced Networking (NEW2AN 2007). Number 4712 in Lecture Notes in Computer Science, St.Petersburg, Russia, Springer (2007) 26–37
[5] Iversen, V.B.: Analysis of real teletraffic processes based on
computer-ized measurements. Ericsson Technics29(1) (1973) 13–64
[6] Kosberg, J.E.: Measured data of subscriber behaviour from CARAT (In Norwegian). In: 1st Nordic Teletraffic Seminar (NTS-1). (1977) [7] Jensen, W.: The Norwegian Telecommarket 2006 (In Norwegian).
Technical report, Post- og teletilsynet (2006)
[8] ITU: Traffic intensity measurement principles. ITU-T Recommendation E.500 (1998)
[9] Bø, K., Gaustad, O., Kosberg, J.E.: Some traffic characteristics of subscriber categories and the influence from tariff changes. In: 8th International teletraffic congress (ITC’8), Melbourne, Australia (1976) 324/1–324/8
[10] Bolotin, V.A.: Telephone circuit holding time distributions. In La-betoulle, J., Roberts, J.W., eds.: 14th International Teletraffic Congress, Antibes Juan-les-Pins, France (1994) 125–134
[11] Barceló, F., Sanchez, J.I.: Probability distribution of the inter-arrival time to cellular telephony channels. In: 49th Vehicular Technology Conference (VTC’99), Huston, TX, USA (1999)
[12] Aschenbruck, N., Frank, M., Martini, P., Tolle, J.: Traffic measurement and statistical analysis in a disaster area scenario. In: 1st workshop on Wireless Network Measurements. (2005)
[13] Barceló, F., Jordán, J.: Channel holding time distribution in public
cellular systems. In Kelly, P., Smith, D., eds.: 16th International
teletraffic congress (ITC’16), Edinburgh, Scotland, Elsevier (1999) 107– 116
[14] Chlebus, E.: Empirical validation of call holding time distribution in cellular communications systems. In: 15th International teletraffic congress (ITC’15), Washington, DC, USA, Elsevier (1997) 1179–1188 [15] Cole, R.G., Rosenbluth, J.H.: Voice over IP performance monitoring.
SIGCOMM Comput. Commun. Rev.31(2) (2001) 9–24
[16] Maxemchuk, N.F., Lo, S.: Measurement and Interpretation of Voice Traffic on the Internet. In: ICC (1). (1997) 500–507
[17] Marsh, I., Li, F., Karlsson, G.: Wide Area Measurements of VoIP Quality. In: Quality of Future Internet Services, Stockholm, Sweden (2003) [18] ITU: Standard traffic profiles for international traffic streams. ITU-T
Recommendation E.523 (1988)
[19] Jensen, W.: The Norwegian Telecommarket 2005 (In Norwegian). Technical report, Post- og teletilsynet (2005)
Poul E. Heegaard is an associate professor at Norwegian University of Science and Technology (NTNU), Department of Telematics, and a senior scientist at Telenor R&I. He received his MSc (Siv. Ing.) in 1988 and his PhD (Dr. Ing.) in 1998 from NTNU. He was with SINTEF from 1989-1999 as a research and senior research scientist. In the academic year 2007-08 he is visiting professor at Duke University. His research interest is within the areas of performance and dependability evaluation of communication systems, covering survivability quantification, speedup simulation techniques, Internet measurements, and adaptive, distributed monitoring and management techniques in dynamic
networks. His e-mail address is [email protected], and
![Figure 1. Traffic-engineering tasks from ITU E.490.1 [1]](https://thumb-us.123doks.com/thumbv2/123dok_us/508675.2560016/1.892.464.823.624.865/figure-traffic-engineering-tasks-from-itu-e.webp)

![Figure 4. Variations of number of calls in IP telephony compared to the Holbæk-measurements (1969) [5].](https://thumb-us.123doks.com/thumbv2/123dok_us/508675.2560016/3.892.459.830.517.729/figure-variations-number-calls-telephony-compared-holbæk-measurements.webp)
![Figure 10. Weekly variation in mobile calls, domestic IP telephony calls, and international IP telephony with termination in Europe or USA [Erlang]](https://thumb-us.123doks.com/thumbv2/123dok_us/508675.2560016/6.892.469.820.480.811/figure-weekly-variation-domestic-telephony-international-telephony-termination.webp)