Accepted Article
FOR PEER REVIEW ONLY
Risk Stratification of Prostate Cancer Utilizing Apparent Diffusion Coefficient Value and Lesion Volume on Multiparametric Magnetic Resonance Imaging
Accepted Article
FOR PEER REVIEW ONLY
AbstractPurpose: To evaluate the performance of apparent diffusion coefficient (ADC) and lesion volume in potentially risk stratifying patients with prostate cancer (PCa).
Materials and Methods: Men with elevated prostate specific antigen or abnormal digital rectal exam underwent a 3T multiparametric magnetic resonance imaging (mpMRI) with endorectal coil. ADC maps were calculated using b values of 0, 500, 1000 and 1500; additional images were obtained with b value of 2000. We prospectively enrolled 312 men with lesions suspicious for cancer (suspicion score 2 - 5) on mpMRI.
MRI/Ultrasound fusion-guided prostate biopsies were performed. Mean ADC of suspicious lesions were correlated against lesion volume, Gleason and D’Amico risk.
Results: The cancer detection rate of fusion biopsy was 45.6% (206/452). Cancerous lesions were larger (median volume: 0.40 vs. 0.30 cm3; p=0.016). The median ADC (x 10-6 mm2/sec) for lesions negative and positive for PCa were 984.5 and 666.5,
respectively (p <0.0001). The AUC of ADC in predicting PCa was 0.79. Larger lesions were associated with higher risk PCa (Gleason and D’Amico) and lower ADC (all p <0.0001).
Conclusions: The mean ADC of suspicious lesions on mpMRI was inversely correlated while lesion volume had a direct correlation with PCa detection. Future follow up studies are needed to assess longitudinal cancer risks of suspicious mpMRI lesions.
Accepted Article
FOR PEER REVIEW ONLY
Key Words: fusion biopsy, Prostate cancer screening, active surveillanceAccepted Article
FOR PEER REVIEW ONLY
INTRODUCTIONThe incidence of prostate cancer (PCa) in the United States was estimated at 220,800 cases in 2015 (1). Gleason score, D’Amico’s and Epstein’s criteria are grading systems currently used to risk stratify men with newly diagnosed clinically localized PCa, and thus help determine those who may quality for active surveillance rather than definitive treatment (2-4). About 50% of men who elect active surveillance will eventually require treatment, especially younger men, those with higher clinical stage, higher Gleason score, and higher prostate-specific antigen at diagnosis (5, 6). Furthermore, up to 20% of those diagnosed with clinically-localized low risk PCa may in fact harbor Gleason ≥7 disease at the time of diagnosis(6). Hence, accurate risk stratification at the time of diagnosis is crucial to avoid over-treatment or potential delays in treatment.
Previous reports, using various definitions such as Gleason’s score, D’Amico and Epstein’s criteria, have demonstrated an improved performance of multiparametric (mpMRI) in predicting clinically significant PCa, compared to traditional diagnostic tests such as prostate specific antigen (PSA) (7-12). Increased utilization of mpMRI has led to the next logical clinical question: can one stratify patients into different PCa risk
categories using mpMRI sequence-specific quantitative data? The apparent diffusion coefficient (ADC) values calculated from diffusion weighted imaging (DWI), has been shown to correlate with PCa aggressiveness (13, 14). In an initial report, Turkbey et al reported a significant “negative” (inverse) correlation between calculated ADC values of tumors and their Gleason risk or D’Amico risk scores (13). However, only a relatively small sample of patients was evaluated and no comparisons were made with men
Accepted Article
FOR PEER REVIEW ONLY
without PCa on biopsy (10). Herein, with a much larger cohort of patients, we report on the performance of apparent diffusion coefficient (ADC) and lesion volume in potentially risk stratifying patients with PCa.
MATERIALS AND METHODS
A retrospective analysis was performed in a cohort of men prospectively enrolled in an institutional review board (IRB)-approved phase III trial "MRI/TRUS Fusion-Guided Prostate Biopsy - An Improved Way to Detect and Quantify Prostate Cancer" (NCT 01566045) at ##### School of Medicine. The details of this trial have been published in previous reports from our institution (8, 15, 16). Briefly, men with clinical suspicion for PCa [elevated (> 4ng/mL) or rising PSA or abnormal digital rectal exam (DRE)] between June 2012 and October 2014 were referred for mpMRI(2). Multiparametric MRI of the prostate was performed using a 3-Tesla Verio MRI machine (Siemens, Germany®), with a 16-channel cardiac coil (Sense, Invivo®) placed on the anterior pelvis, and an
endorectal coil (ERC) (BPX-30, Medrad, Pittsburg, Penn®) filled with FC-770 (3M, St. Paul, MN®). MRI sequences obtained were: a tri-planar T2-weighted (T2W) imaging; diffusion-weighted imaging (b-values 0, 50, 500, 1000, 1500, 2000) with apparent diffusion coefficient (ADC) mapping (b-values 0, 50, 500, 1000, 1500); and dynamic contrast-enhanced (DCE) MRI sequences using the European Society of Urogenital Radiology (ESUR) guidelines (17). The MRI studies were reviewed and interpreted by three genitourinary radiologists (##, ##, and ##), with more than 15 years combined experience, in a consensus. Lesions on mpMRI were graded on a 5-point Likert scale based on their suspicion for cancer, as described in the ESUR guidelines (17). Lesion
Accepted Article
FOR PEER REVIEW ONLY
dimensions were measured individually based on 3D-region of interest segmentation on mpMRI and lesion volumes were estimated using the ellipsoid formula. ADC of each lesion was calculated as the mean ADC values measured in the whole lesion. The anatomic location of the lesions was reported using the NIH prostate zones, as previously reported (8). Men with suspicious lesion on mpMRI of the prostate were consented and enrolled into the trial.
Demographic and clinical data were prospectively collected. The study protocol biopsies included fusion biopsy and a standard 12-core transrectal ultrasound (TRUS)-guided biopsy. The UroNav MRI/TRUS (end-fire iU22 ultrasound, Philips Healthcare,
Netherlands) fusion guided-prostate biopsy system (Invivo, Florida®) was used to perform targeted biopsy of suspicious prostate lesion. A total of two biopsy cores (one each in the axial and sagittal planes) were obtained from each lesion, an approach shown to improve cancer detection by about 8% (18). A standard 12-core biopsy was then performed using TRUS guidance, with the UroNav workstation (Invivo, Gainesville, Florida®) turned off to blind the investigator to the anatomic location of the lesion. At our institution, a genitourinary pathologist (##) reviewed all biopsy specimens.
These analyses were limited to men undergoing an initial or repeat biopsy with a suspicious lesion on mpMRI, no prior history of PCa, radiation to the pelvis, or inability to tolerate prostate biopsy under local anesthesia or mild sedation (Figure 1).
Accepted Article
FOR PEER REVIEW ONLY
We compared demographic and clinical variables using Fisher’s exact tests and
Kruskal-Wallis test for categorical and continuous variables respectively, between men diagnosed with cancer and those without cancer on protocol biopsies. We calculated and compared the cancer detection rate (CDR) of fusion, 12-core and protocol biopsies. On fusion biopsy, clinically significant PCa was defined as any Gleason ≥ 7 or Gleason 6 with a lesion volume > 0.2 cm3 based on Epstein criteria which was developed using whole mount prostatectomy specimens. The performance of mpMRI in predicting PCa was evaluated using logistic regression and by plotting Receiver Operating
Characteristic (ROC) curves, estimating AUCs and corresponding confidence intervals. Decision point analysis was performed to determine optimal cut off values for ADC; sensitivity and specificity were reported for each cut off point. Statistical level of significance was set at 0.05, and 2-sided p-values were reported.
RESULTS
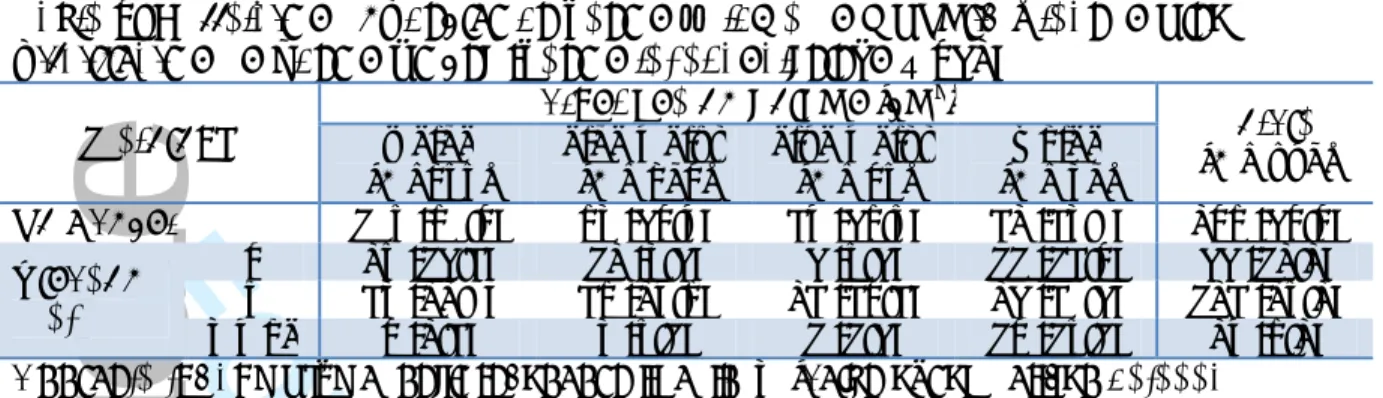
A total of 312 men with suspicious lesion on mpMRI were eligible for analysis (Figure 1), of which 64.7% were diagnosed with PCa. The average number of suspicious mpMRI lesions was 1.45 (452/312); and PCa was detected on fusion biopsy in 45.6% (206/452) of lesions. Demographic, clinical, and radiological characteristics of men with cancer compared with men without cancer are presented in Table 1. In summary, men with PCa were more likely to be older, have an abnormal DRE, elevated PSA and PSA density, smaller prostate volume, larger lesion volume, and lower ADC value.
Accepted Article
FOR PEER REVIEW ONLY
As presented in Table 2, the CDRs of 12-core biopsy, fusion biopsy, and protocol biopsies (12-core + fusion) were significantly associated with level of suspicion on mpMRI (p<0.0001), with 100% of those with suspicion level of 5 on mpMRI diagnosed with PCa and 98.0% with clinically significant PCa. The location of the lesion –
peripheral zone or central gland – did not affect the performance of Fusion biopsy in detecting all PCa and clinically significant PCa (p<0.0001; Table 3).
The median ADC value of mpMRI lesions in men with cancer was 666.5 x 10⁻⁶ compared with 984.5 x 10⁻⁶ mm2/sec in men without cancer (Table 1; p<0.001). The AUC of ADC value in predicting PCa on fusion biopsy was 0.79 (95% CI: 0.75, 0.83) at the lesion level (Figure 2a). The optimal ADC cut off for predicting PCa was 719 x 10-6 mm2/sec, characterized by a sensitivity and specificity of 63.6% and 82.5% respectively (Figure 2b). In a subgroup analysis, the AUC of ADC for predicting cancer in lesions located in the central gland was 0.83 (95% CI: 0.76, 0.90), which was not significantly different from 0.81 (95% CI: 0.76, 0.86) for lesions located in the peripheral zone of the prostate. However, the optimal ADC cut off for predicting PCa located in the central gland was 602 x 10-6 mm2/sec (range= 286 – 1350 x 10-6 mm2/sec; sensitivity = 64.6%; specificity = 89.4%) compared with 901 x 10-6 mm2/sec (range: 207 – 1650 x 10-6
mm2/sec; sensitivity = 75.2%; specificity =76.1%) for lesions located in the peripheral zone of the prostate.
The mean ADC value of suspicious mpMRI lesions was inversely correlated with the probability of PCa detection on fusion biopsy as well as the Gleason and D’Amico risk
Accepted Article
FOR PEER REVIEW ONLY
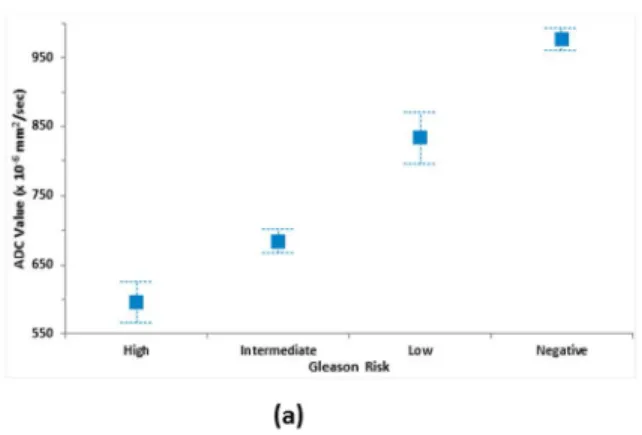
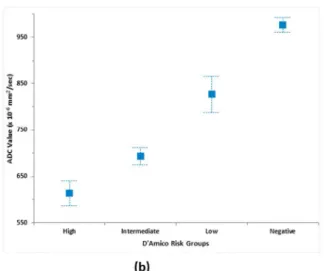
stratification (Figure 3). The mean (± SD) ADC value of men without PCa, men with low, intermediate, and high Gleason risk PCa were 976.6 (± 252.1), 833.3 (± 275.5), 685.1 (± 196.6), and 596.0 (± 153.9) x 10-6 mm2/sec respectively (p<0.0001; Figure 3a). Similarly, the mean (± SD) ADC value of men without PCa, men with low, intermediate, and high D’Amico risk PCa were 976.6 (± 252.1), 826.7 (± 277.2), 693.6 (± 206.6), and 614.0 (± 156.7) x 10-6 mm2/sec respectively (p<0.0001; Figure 3b).
The greater the volume of the suspicious lesion on mpMRI, the more likely it was to find a Gleason ≥7 PCa on fusion biopsy. For example, the detection rate of Gleason ≥7 PCa in lesions <0.20 cm3 was 24.3% compared with 47.6% for lesions ≥1.0 cm3 (p<0.001; Table 4). We observed an inverse correlation of ADC value with lesion volume on mpMRI, with larger lesions associated with lower ADCs. In an exploratory multivariable analysis combining ADC value and lesion volume in addition to age, family history, DRE findings, PSA, prostate volume to predict PCa, however, only ADC value was
statistically significant (p <0.0001 vs. 0.3095).
DISCUSSION
The most commonly used risk stratification systems for prostate cancer include Gleason score, D’Amico’s criteria, Epstein’s criteria, and the National Comprehensive Cancer Network’s (NCCN’s) risk groups (2-4). Although several studies have reported on the ability of mpMRI of the prostate to enhance the detection of clinically significant PCa and improve risk stratification, incorporation of imaging findings in risk stratification is yet to be defined(7-9). Compared to mpMRI without ERC, the use of ERC has been
Accepted Article
FOR PEER REVIEW ONLY
shown to increase the ability of mpMRI to detect more lesions including smaller lesions, with higher sensitivity and PPV. The use of ERC improves image quality by increasing signal-to-noise ratio and decreasing artifacts secondary to air in the rectum (19).
ADC value was inversely correlated with PCa aggressiveness based on Gleason score or D’Amico’s criteria, as previously reported by several research groups (20-22). In an analysis of 48 patients who underwent MRI/TRUS-fusion guided prostate biopsies, Turkbey et al reported a “negative” (inverse) correlation between calculated ADC values of tumors and Gleason scores (13). ADC value was found to accurately classify tumors into intermediate to high risk versus low risk in 73% of cases (13). In a much larger cohort of patients, we similarly report an inverse relationship between ADC and clinical significance of PCa. We found that the AUC of ADC in predicting PCa did not differ between the central gland and peripheral zone of the prostate. The association between ADC and clinically significant PCa can be explained by the biology of PCa,
characterized by impaired Brownian motion of water molecules due to hypercellularity, disorganized or complete loss of glandular architecture in higher-grade tumors, as previously hypothesized (13, 23, 24). Similar findings have been reported by other investigators who found that lower ADC values were strongly associated with higher tumor aggressiveness (22, 25).
In defining the use of ADC value for PCa risk stratification, a cutoff point (s) needs to be defined. Kim et al (14) separated a cohort of patients with PCa into two groups using an ADC cut off of 830 x 10-6 mm2/sec, and reported that a higher ADC is predictive of
Accepted Article
FOR PEER REVIEW ONLY
insignificant PCa (Gleason ≤ 6). However, the method of determination of this cutoff point was not reported. In our cohort, we determined that the optimal ADC cut off for defining cancerous versus benign lesions was 719 x 10-6 mm2/sec, with a sensitivity and specificity of 63.6% and 82.5% respectively. Furthermore, we found that the threshold ADC for PCa may differ between the central gland and peripheral zone - 602 x 10-6 mm2/sec versus 901 x 10-6 mm2/secrespectively, which may reflect the varied cellularity of these zones of the prostate. Although analysis was limited to the peripheral zone only, Li et al reported a similar ADC threshold of 960 x 10-6 mm2/sec for differentiating cancerous versus benign lesions (26).
Our analyses demonstrated other findings that may be useful in determining the clinical significance of PCa. We found an inverse correlation between mean ADC value of suspicious lesions and both the Gleason and D’Amico risk groups, with higher risk lesions characterized by lower mean ADC values, which may be attributed to the more restricted diffusion of molecules in cancerous versus benign tissue. We also found that the larger the lesion volume, the higher the risk or aggressiveness of the PCa. For example, 47.6% of lesions ≥ 1.0 cm3 were Gleason ≥7 tumors compared with 24.3% of lesions <0.2 cm3. In addition, we observed an inverse correlation between the ADC value of lesions and lesion volume, which again may be related to the hypercellularity of aggressive or larger tumors (23, 24). Although this association may be explained by the collinearity of ADC values and lesion volume, both mpMRI parameters (lesion volume and/or ADC value of suspicious lesion) may be useful in combination with clinical parameters to risk stratify men diagnosed with PCa.
Accepted Article
FOR PEER REVIEW ONLY
Our study is not without limitations. First, for the purpose of these analyses, men with negative mpMRI were excluded since there was no lesion to target with fusion biopsy. However, mpMRI has been shown in multiple studies to select clinically significant PCa (8, 9, 15, 27, 28), with a high negative predictive value (>90%) (29). Second, a negative fusion biopsy may be due to assignment of a falsely high suspicion score or targeting error (30). In our study, a team of three radiologists interpreted the mpMRI images in a consensus format. As a result, we do not have data on inter-observer variability, which may characterize routine clinical practice. Although current recommendations support the use of consensus reads when starting an imaging program, we continued our consensus reads as part of our normal workflow. Radiology-pathology correlation and imaging quality review allowed for ongoing improvements and collaborations between all departments (31). In addition, two biopsy cores (one each in the axial and sagittal planes) were obtained from each lesion, an approach shown to improve cancer
detection by about 8% (18). Third, we do not have radical prostatectomy specimens to determine the true positivity rate of suspicious lesions on mpMRI, hence theoretically some lesions may have been misclassified. Lastly, lesion volumes were estimated using the ellipsoid formula. This approach, however, may overestimate the actual volume by 7% when compared to whole mount histopathology without a shrinkage factor correction (32). Nevertheless, the strength of this study lies in the prospective nature and
comparatively larger sample size. In addition, the use of 3-Tesla MRI magnet and endorectal coil may have improved image quality and signal-to-noise ratio, and as a result, the performance of ADC value in stratifying PCa. Research is currently ongoing
Accepted Article
FOR PEER REVIEW ONLY
to evaluate the utility of mpMRI and ADCs as a quantitative predictive parameter in the management of men with PCa on active surveillance.
In conclusion, the calculated mean ADC value of suspicious lesions on mpMRI has an inverse relationship with lesion volume and prostate cancer risk or aggressiveness. Our study validates the findings of other groups, showing that ADC may be a useful tool in predicting PCa and its clinical significance. Furthermore, we report that lesion volume may be a useful tool to determine the clinical significance of prostate cancer. ADC values, lesion volume and its growth rate needs to be evaluated prospectively as parameters for monitoring eligible patients who elects active surveillance of their newly diagnosed low risk clinically localized PCa and/or in making a decision to proceed to treatment.
Accepted Article
FOR PEER REVIEW ONLY
AcknowledgementAccepted Article
FOR PEER REVIEW ONLY
REFERENCES1. Siegel RL, Miller KD, Jemal A: Cancer statistics, 2015. CA Cancer J Clin 2015; 65:5– 29.
2. Carroll PR, Parsons JK, Andriole G, et al.: NCCN Guidelines Insights: Prostate Cancer Early Detection, Version 2.2016. J Natl Compr Canc Netw 2016; 14:509–519. 3. D'Amico AV, Whittington R, Malkowicz SB, et al.: Biochemical outcome after radical prostatectomy, external beam radiation therapy, or interstitial radiation therapy for clinically localized prostate cancer. JAMA 1998; 280:969–974.
4. Epstein JI, Walsh PC, Carmichael M, Brendler CB: Pathologic and clinical findings to predict tumor extent of nonpalpable (stage T1c) prostate cancer. JAMA 1994; 271:368– 374.
5. Tosoian JJ, Mamawala M, Epstein JI, et al.: Intermediate and Longer-Term
Outcomes From a Prospective Active-Surveillance Program for Favorable-Risk Prostate Cancer. J Clin Oncol 2015:JCO.2015.62.5764.
6. Klotz L, Vesprini D, Sethukavalan P, et al.: Long-term follow-up of a large active surveillance cohort of patients with prostate cancer. J Clin Oncol 2015; 33:272–277. 7. Rastinehad AR, Baccala AA, Chung PH, et al.: D'Amico risk stratification correlates with degree of suspicion of prostate cancer on multiparametric magnetic resonance imaging. J Urol 2011; 185:815–820.
8. Salami SS, Vira MA, Turkbey B, et al.: Multiparametric magnetic resonance imaging outperforms the Prostate Cancer Prevention Trial risk calculator in predicting clinically significant prostate cancer. Cancer 2014; 120:2876–2882.
9. Fütterer JJ, Briganti A, De Visschere P, et al.: Can Clinically Significant Prostate Cancer Be Detected with Multiparametric Magnetic Resonance Imaging? A Systematic Review of the Literature. Eur Urol 2015.
10. Stamatakis L, Siddiqui MM, Nix JW, et al.: Accuracy of multiparametric magnetic resonance imaging in confirming eligibility for active surveillance for men with prostate cancer. Cancer 2013; 119:3359–3366.
11. Siddiqui MM, Truong H, Rais-Bahrami S, et al.: Clinical implications of a
multiparametric magnetic resonance imaging based nomogram applied to prostate cancer active surveillance. J Urol 2015; 193:1943–1949.
12. Mullins JK, Bonekamp D, Landis P, et al.: Multiparametric magnetic resonance imaging findings in men with low-risk prostate cancer followed using active surveillance.
Accepted Article
FOR PEER REVIEW ONLY
clinical risk scores for prostate cancers that are visible on 3-T MR images? Radiology
2011; 258:488–495.
14. Kim TH, Jeong JY, Lee SW, et al.: Diffusion-weighted magnetic resonance imaging for prediction of insignificant prostate cancer in potential candidates for active
surveillance. Eur Radiol 2015:1–7.
15. Rastinehad AR, Turkbey B, Salami SS, et al.: Improving detection of clinically significant prostate cancer: magnetic resonance imaging/transrectal ultrasound fusion guided prostate biopsy. J Urol 2014; 191:1749–1754.
16. Rastinehad AR, Waingankar N, Turkbey B, et al.: Comparison of Multiparametric MRI Scoring Systems and the Impact on Cancer Detection in Patients Undergoing MR US Fusion Guided Prostate Biopsies. PLoS ONE 2015; 10:e0143404.
17. Barentsz JO, Richenberg J, Clements R, et al.: ESUR prostate MR guidelines 2012.
Eur Radiol 2012:746–757.
18. Hong CW, Rais-Bahrami S, Walton-Diaz A, et al.: Comparison of magnetic
resonance imaging and ultrasound (MRI-US) fusion-guided prostate biopsies obtained from axial and sagittal approaches. BJU Int 2015; 115:772–779.
19. Turkbey B, Merino MJ, Gallardo EC, et al.: Comparison of endorectal coil and nonendorectal coil T2W and diffusion-weighted MRI at 3 Tesla for localizing prostate cancer: correlation with whole-mount histopathology. J Magn Reson Imaging 2014; 39:1443–1448.
20. Luczyńska E, Heinze-Paluchowska S, Domalik A, et al.: The Utility of Diffusion Weighted Imaging (DWI) Using Apparent Diffusion Coefficient (ADC) Values in Discriminating Between Prostate Cancer and Normal Tissue. Pol J Radiol 2014; 79:450–455.
21. Chung MP, Margolis D, Mesko S, Wang J, Kupelian P, Kamrava M: Correlation of quantitative diffusion-weighted and dynamic contrast-enhanced MRI parameters with prognostic factors in prostate cancer. J Med Imaging Radiat Oncol 2014; 58:588–594. 22. Boesen L, Chabanova E, Logager V, Balslev I, Thomsen HS: Apparent diffusion coefficient ratio correlates significantly with prostate cancer gleason score at final pathology. J Magn Reson Imaging 2014:n/a–n/a.
23. Gibbs P, Liney GP, Pickles MD, Zelhof B, Rodrigues G, Turnbull LW: Correlation of ADC and T2 measurements with cell density in prostate cancer at 3.0 Tesla. Invest Radiol 2009; 44:572–576.
24. Wang XZ, Wang B, Gao ZQ, et al.: Diffusion-weighted imaging of prostate cancer: correlation between apparent diffusion coefficient values and tumor proliferation. J Magn Reson Imaging 2009; 29:1360–1366.
Accepted Article
FOR PEER REVIEW ONLY
25. Nowak J, Malzahn U, Baur AD, et al.: The value of ADC, T2 signal intensity, and a combination of both parameters to assess Gleason score and primary Gleason grades in patients with known prostate cancer. Acta Radiol 2014:0284185114561915.
26. Li L, Margolis DJA, Deng M, et al.: Correlation of gleason scores with magnetic resonance diffusion tensor imaging in peripheral zone prostate cancer. J Magn Reson Imaging 2014:n/a–n/a.
27. Pinto PA, Chung PH, Rastinehad AR, et al.: Magnetic resonance
imaging/ultrasound fusion guided prostate biopsy improves cancer detection following transrectal ultrasound biopsy and correlates with multiparametric magnetic resonance imaging. J Urol 2011; 186:1281–1285.
28. Salami SS, Ben-Levi E, Yaskiv O, et al.: In patients with a previous negative prostate biopsy and a suspicious lesion on magnetic resonance imaging, is a 12-core biopsy still necessary in addition to a targeted biopsy? BJU Int 2015; 115:562–570. 29. Abd-Alazeez M, Ahmed HU, Arya M, et al.: The accuracy of multiparametric MRI in men with negative biopsy and elevated PSA level--can it rule out clinically significant prostate cancer? Urol Oncol 2014; 32:45.e17–22.
30. Cash H, Günzel K, Maxeiner A, et al.: Prostate cancer detection on transrectal ultrasonography‐guided random biopsy despite negative real‐time magnetic resonance imaging/ultrasonography fusion‐guided targeted biopsy: reasons for targeted biopsy failure. BJU Int 2015:n/a–n/a.
31. Puech P, Randazzo M, Ouzzane A, et al.: How are we going to train a generation of radiologists (and urologists) to read prostate MRI? Curr Opin Urol 2015; 25:522–535. 32. Turkbey B, Mani H, Aras O, et al.: Correlation of magnetic resonance imaging tumor volume with histopathology. J Urol 2012; 188:1157–1163.
Accepted Article
FOR PEER REVIEW ONLY
TablesTable 1. Demographic, Clinical, Radiological Characteristics of Men with and without Prostate Cancer (n = 312) Variable Cancer (n = 202) No Cancer (n = 110) p -Value Age 66.0 [60.8 – 71.7] 63.9 [58.6 – 68.0] 0.142 African American 30 (14.9) 10 (9.1) 0.160
Family History of PCa 63 (31.2) 32 (29.1) 0.797
Abnormal DRE 35 (17.3) 7 (6.4) 0.009
PSA (ng/ml) 7.77 [5.5 – 12.5] 6.25 [4.6 – 8.9] 0.004
PSAD (ng/ml/cm3) 0.18 [0.13 – 0.30] 0.10 [0.08 – 0.17] <0.001
MRI Prostate Volume (cm3) 43.0 [30.0 – 58.0) 57.0 [40.7 – 70.3] <0.001 MRI Lesion Volume (cm3) 0.37 [0.14 – 0.96] 0.25 [0.13 – 0.55] 0.016 ADC of Lesion (x10-6 x mm2/sec) 666.5 [562.8 – 833.4] 984.5 [780.8 – 1160.2] <0.001 Median [inter-quartile range] is reported for continuous variables and frequency (%) for
categorical variables. Abbreviations: PCa: Prostate cancer; DRE: Digital rectal examination; PSA: Prostate specific antigen; PSAD: PSA density; MRI: Magnetic resonance imaging; ADC: Apparent diffusion coefficient.
Accepted Article
FOR PEER REVIEW ONLY
Table 2. Cancer Detection Rates of Fusion and 12-Core for each level of suspicion on MRI (Patient level analysis; n = 312)
Level of
Suspicion N
Cancer Detection Rate (%)
12-Core only Fusion only Protocol Clin. Significant
2 12 2 (16.7) 2 (16.7) 3 (25.0) 2 (16.7)
3 135 53 (39.3) 36 (26.7) 60 (44.4) 38 (28.1)
4 115 77 (67.0) 80 (69.6) 89 (77.4) 81 (70.4)
5 50 36 (72.0) 48 (96.0) 50 (100.0) 49 (98.0)
Total 312 168 (53.8) 166 (53.2) 202 (64.7) 170 (54.5)
Abbreviations: MRI: Magnetic resonance imaging; Protocol = Fusion + 12-core biopsy. All p-values of comparison of MRI suspicion with CDR <0.0001
Accepted Article
FOR PEER REVIEW ONLY
Table 3. Cancer Detection Rates of Fusion biopsy for each level of suspicion on MRI (Lesion level analysis; n = 452)
Level of Suspicion
Cancer Detection Rate (%)
Peripheral Zone Central Gland
N All PCa Clin Sig PCa N All PCa Clin Sig PCa
2 23 2 (8.7) 1 (4.3) 1 0 (0) 0 (0.0)
3 170 42 (24.7) 26 (15.3) 61 13 (21.3) 10 (16.4)
4 102 72 (70.6) 65 (63.7) 43 26 (60.5) 26 (60.5)
5 26 25 (96.2) 25 (96.2) 26 26(100.0) 26 (100.0)
Total 321 144 (44.9) 117 (36.4) 131 65 (49.6) 62 (47.3)
Abbreviations: MRI: Magnetic resonance imaging; PCa: Prostate cancer; All p-values of comparison of MRI suspicion with CDR <0.0001
Accepted Article
FOR PEER REVIEW ONLY
Table 4. Correlation of Suspicious Lesion Volume on MRI with Gleason Risk Stratification on Fusion Biopsy (Lesion level analysis; n = 452)
Histology
Target Lesion Volume (cm3)
Totals (n = 452) < 0.20 (n =177) 0.20 – 0.49 (n = 126) 0.50 – 0.99 (n = 67) ≥ 1.00 (n = 82) No Cancer 107 (60.4) 69 (54.8) 38 (56.7) 32 (39.0) 246 (54.4) Gleason Risk 6 27 (15.3) 12 (9.5) 5 (7.5) 11 (13.4) 55 (12.2) 7 39 (22.0) 36 (28.6) 23 (34.3) 25 (30.5) 123 (27.2) 8 – 10 4 (2.3) 9 (7.1) 1 (1.5) 14 (17.1) 28 (6.2)
Accepted Article
FOR PEER REVIEW ONLY
Figure LegendsFigure 1. CONSORT Diagram of the "MRI/TRUS Fusion-Guided Prostate Biopsy - An Improved Way to Detect and Quantify Prostate Cancer" trial. Abbreviations: mpMRI – multiparametric magnetic resonance imaging; PCa – prostate cancer; and AS – active surveillance.
Figure 2. (a). Receiver Operating Characteristic Curve Depicting the Performance of ADC Value in predicting Prostate Cancer (AUC = 0.79; 95% CI: 0.75, 0.83); (b). Decision point analysis – Optimal ADC cut off = 719 x 10-6 mm2/sec (Sensitivity =
63.6%, Specificity = 82.5%). Abbreviations: ADC – apparent diffusion coefficient; TPF – true positive fraction; and FPF – false positive fraction
Figure 3. Correlation of ADC value of suspicious lesions with (a) Gleason risk stratification; and (b) D’Amico risk stratification (p<0.0001). Abbreviation: ADC – apparent diffusion
Accepted Article
FOR PEER REVIEW ONLY
CONSORT Diagram of the "MRI/TRUS Fusion-Guided Prostate Biopsy - An Improved Way to Detect and Quantify Prostate Cancer" trial. Abbreviations: mpMRI – multiparametric magnetic resonance imaging; PCa
– prostate cancer; and AS – active surveillance. 190x254mm (96 x 96 DPI)
Accepted Article
FOR PEER REVIEW ONLY
Figure 2. (a). Receiver Operating Characteristic Curve Depicting the Performance of ADC Value predicting Prostate Cancer (AUC = 0.79; 95% CI: 0.75, 0.83)
Accepted Article
FOR PEER REVIEW ONLY
Figure 2. (b). Decision point analysis – Optimal ADC cut off = 719 x 10-6 mm2/sec (Sensitivity = 63.6%, Specificity = 82.5%)
Accepted Article
FOR PEER REVIEW ONLY
Figure 3. Correlation of ADC value of suspicious lesions with (a) Gleason risk stratification 254x190mm (96 x 96 DPI)
Accepted Article
FOR PEER REVIEW ONLY
Figure 3. Correlation of ADC value of suspicious lesions with (b) D’Amico risk stratification (p<0.0001) 254x190mm (96 x 96 DPI)
Accepted Article
FOR PEER REVIEW ONLY
June 15th, 2016
Mark E. Schweitzer, MD Editor-in-Chief, JMRI
Stony Brook Department of Radiology HSC L4 Room 120
Stony Brook, NY 11794-8460 Dear Dr. Schweitzer,
Thank you for the prompt review of our manuscript entitled "Risk Stratification of Prostate Cancer
Utilizing Apparent Diffusion Coefficient Value and Lesion Volume on Multiparametric Magnetic Resonance Imaging."
We appreciate your comments/recommendations and those of the reviewers, which we believe have strengthened our paper. Detailed below are point-by-point responses to the reviewer comments. Tracked changes were made to the manuscript to reflect these recommendations. A clean copy of the manuscript (with changes accepted) is also attached.
Thanks for your consideration of this manuscript for publication in the Journal of Magnetic Resonance
Imaging (JMRI).
Yours sincerely,
Sincerely,
Ardeshir Rastinehad, D.O.
General Response
To clarify, we utilized the terms “risk” and “clinically significant” in the context of prostate cancer
stratification. Prostate cancer is stratified into very low risk, low risk, intermediate risk, and high risk based on the probability of progression to metastatic disease or death.
On the one hand, clinically significant prostate cancer comprises disease categories (intermediate and high risk groups) that should be treated, given the high probability of progression. Clinically insignificant or indolent disease (very low and low risk groups), on the other hand, refers to those prostate cancers that can be observed given the low probability of progression. Patients in this category tend to die with, not of prostate cancer. Please refer to the National Cancer Comprehensive Network (NCCN) prostate cancer guidelines (Reference #2) for further details.
Reviewer: 1
Comments to the Author
This paper is good enough for reporting the evaluating the performance of ADC and lesion volumes in risk stratifying patients with prostate.
Accepted Article
FOR PEER REVIEW ONLY
Authors’ response: We have added an explanation of the abbreviations to the figure legend. Otherwise, the study flow diagram is self-explanatory.
*2. You should explain about the Fig2(a).
Authors’ response: We have added an explanation of the abbreviations to the figure legend; this figure was described and now referred to in the results.
*3. You should explain the abbreviation, such as TRUS, MP-MRI, etc.
Authors’ response: Thanks, these abbreviations have been explained.
Reviewer: 2
Comments to the Author
Thank you for this nice paper.
Authors’ response: Thank you!
I have just small comments:
You should discuss the limitations of fusion biopsy in the analyses of MRI lesions. Several data about a target error is published.
Authors’ response: We have discussed this as one of the limitations.
The authors should discuss the limitation when comparing different ADC values in different machines, with or without ERC.
Authors’ response: Thanks for your comment. We believe that using a 3T MRI magnet and ERC may have improved the: 1) quality of MR images and thus the accuracy of interpretation; and 2) signal to noise ratio during image acquisition. We have included this in our discussion.
Reviewer #3
*1. How many of these patients have been included in previous publications?
Authors’ response: 140 patients with previous negative biopsies were included in a previous publication. We also used the same population in developing an MRI suspicion scoring system. However, the results presented in the current paper have NOT been reported previously.
*2. Figure 3 is compelling. What do the error bars represent? With no overlap across risk groups can risk be assigned by imaging and biopsy be avoided in some men?
Authors’ response: These are box plots showing the minimum, interquartile range, and maximum ADC values in each risk category. Certainly with future validation studies, ADC value may be useful in risk stratifying men and biopsies may be avoided in those with low risk profile (i.e high ADC value)
*3. How was the ADC value determined in a lesion? Was it the lowest pixel value in the entire lesion? The mean value for the whole lesion? The mean value for a portion of the lesion? In men with multiple MRI lesions what was the ADC value that was used for analysis?
Authors’ response: ADC was calculated as the mean ADC value in the whole lesion. We have ensured this is clearer in the manuscript. The analysis was performed at a lesion level (not patient level) i.e. every lesion was represented in the analysis. We analyzed 452 lesions from 312 patients.