Comparison and relationship of thyroid hormones, IL-6, IL-10 and
albumin as mortality predictors in case-mix critically ill patients
Álvaro Quispe E
a, Xiang-Min Li
a,⇑, Hong Yi
ba
Emergency Intensive Care Unit, Emergency Department of Xiangya Hospital – Central South University, 87 Xiangya Road, Changsha 410008, China b
Department of Molecular Biology, Xiangya Hospital – Central South University, 87 Xiangya Road, Changsha 410008, China
a r t i c l e i n f o
Article history:
Received 15 August 2015
Received in revised form 26 February 2016 Accepted 7 March 2016
Available online 11 March 2016 Keywords: Thyroid hormones Cytokines Albumin Mortality
a b s t r a c t
Objective:To compare the ability of thyroid hormones, IL-6, IL-10, and albumin to predict mortality, and to assess their relationship in case-mix acute critically ill patients.
Methods: APACHE II scores and serum thyroid hormones (FT3, FT4, and TSH), IL-6, IL-10, and albumin were obtained at EICU admission for 79 cases of mix acute critically ill patients without previous history of thyroid disease. Patients were followed for 28 days with patient’s death as the primary outcome. All mean values were compared, correlations assessed with Pearson’ test, and mortality prediction assessed by multivariate logistic regression and ROC.
Results: Non survivors were older, with higher APACHE II score (p = 0.000), IL-6 (p < 0.05), IL-10 (p = 0.000) levels, and lower albumin (p = 0.000) levels compared to survivors at 28 days. IL-6 and IL-10 had significant negative correlation with albumin (p = 0.001) and FT3 (p60.05) respectively, while low albumin had a direct correlation with FT3 (p < 0.05). In the mortality prediction assessment, IL-10, albumin and APACHE II were independent morality predictors and showed to have a good (0.70–0.79) AUC-ROC (p < 0.05). Despite that the entire cohort showed low FT3 serum levels (p = 0.000), there was not statistical difference between survivors and non-survivors; neither showed any significance as mortality predictor.
Conclusions: IL-6 and IL-10 are correlated with Low FT3 and hypoalbuminemia. Thyroid hormones assessed at EICU admission did not have any predictive value in our study. And finally, high levels of IL-6 and IL-10 in conjunction with albumin could improve our ability to evaluate disease’s severity and predict mortality in the critically ill patients. When use in combination with APACHE II scores, our model showed improved mortality prediction.
Ó2016 The Authors. Published by Elsevier Ltd. This is an open access article under the CC BY-NC-ND license (http://creativecommons.org/licenses/by-nc-nd/4.0/).
1. Introduction
Since the development of the ‘‘acute physiology and chronic health evaluation II” (APACHE II)[1], mortality prediction in criti-cally ill patients remains a great concern for physicians and patient’s family due to limited health resources and high economic costs[2]. Thereon during critical illness, part of the neuroendocrine
alterations known as Non Thyroid Illness Syndrome (NTIS) or Low T3 syndrome (LT3) characterized by low T3, Low or normal T4, high rT3 and normal TSH[3–5]have been related with disease’s severity and mortality in ICU setting[6–8]. However, the patho-physiology of LT3 is complex and not well understood due to the interaction of multiple factors during critical illness[9–14]. Thus release of high levels of pro-inflammatory cytokines during the acute response of critical illness have been reported to be related and possibly cause NTIS [15–17]. Furthermore, previous studies have demonstrated that pro-inflammatory cytokines and anti-inflammatory cytokines blood concentration are correlated with disease’s severity and mortality as well, but mainly in septic patients [18–20]. Nevertheless, none study that analyze this biomarkers in the same patient have been done. Therefore in this prospective study, we attempt to evaluate the ability of thyroid hormones, cytokines (IL-6 and IL-10), and albumin as predictors of mortality in conjunction with APACHE II score in critically ill http://dx.doi.org/10.1016/j.cyto.2016.03.004
1043-4666/Ó2016 The Authors. Published by Elsevier Ltd.
This is an open access article under the CC BY-NC-ND license (http://creativecommons.org/licenses/by-nc-nd/4.0/). Abbreviations:AUC, area under the curve; APACHE II, Acute Physiology and
Chronic Health Evaluation II; EICU, emergency intensive care unit; ICU, intensive care unit; IFN, interferon; IL, interleukin; LT3, Low T3 syndrome; NTIS, nonthyroidal illness syndrome; FT3, Free Triiodothyronine; ROS, reactive oxygen species; ROC curve, receiver operating characteristic curve; rT3, reverse Triiodothyronine; T3, Triiodothyronine; T4, Thyroxine; TNF, tumor necrosis factor; TSH, thyroid-stimulating hormone; TT3, total Triiodothyronine; TT4, total Thyroxine; TH, thyroid hormones; TBG, Thyroxine Binding Globulin.
⇑Corresponding author.
E-mail address:[email protected](X.-M. Li).
Contents lists available atScienceDirect
Cytokine
patients. In addition, we seek to identify potential relationship between these variables.
2. Materials and methods
2.1. Patients
This prospective and observational research was conducted at Emergency Intensive Care Unit (EICU), of Xiangya Hospital – Cen-tral South University, from August to December of 2014 with the approval of the local Ethics Committee and written informed consent from each patient.
During that period, 340 patients age 18 and older were admit-ted to EICU, and all were screened for underlying thyroid disorders by detailed medical record, physical examination (including palpa-tion of the thyroid gland), blood test for thyroid hormones and thyroid antibodies at EICU admission (following the declaration of Helsinki). Their APACHE II score was also recorded within 24 h of admission. Patients with: previous or new diagnosis of hypothy-roidism, hyperthyroidism or its subclinical types, pregnancy, breastfeeding condition, endocrine diseases (except Diabetes Mellitus), duration of stay <24 h, and those transferred from other hospitals with >36 h of hospitalization were all excluded, remain-ing 79 patients.
2.2. Measurements
For patients that met the inclusion criteria, blood samples were collected prior to interventions or therapy that could potentially interfere or alter serums level of thyroid hormones or cytokines, ‘‘ECLIA immune assay” detection kits via Electro-Chemiluminescent Roche E 170 System (Roche Diagnostics International Ltd., CH-6343 Rotkreuz, Switzerland) were used to measure serum levels of FT3, FT4, and TSH and thyroid Normal ranges of our laboratory were 2.8–7.1 pmol/L; 12–22 pmol/L, and 0.27–4.2 IU/L for FT3, FT4, and TSH respectively.
For cytokines’ blood concentration measurement, blood sam-ples were obtained after 24 h of EICU admission, centrifuged at 2000 rpm10 min; plasma was separated and frozen at80° Cel-sius until the time of the assay according to standard recommenda-tions for cytokines’ assessment in blood samples[21–23]. ‘‘Sunny Elisa Human IL-6 and IL-10 test” Multisciences (Hangzhou Lianke biotechnology Ltd. China), were used to assess cytokines’ concen-tration and measured by Colorimetric Reader GEN5-Biotek (Bioteck instruments Inc., Beijing, China), minimum detectable cytokine levels for IL-6 and IL-10 were <0.37 pg/ml. Interpolation to the standard curve of the measurements were obtained through linear regression by GraphPad Prism software version 6
(Inc. California, United States). Reference of cytokines levels in healthy individuals were taken from Maier et al.[24], whose values are 70 pg/ml and 30 pg/ml for IL-6 and IL-10 respectively. 2.3. Statistical analysis
Data is presented in means and 95% Confidence Interval (CI). Variable’s mean were compared between survivors and non-survivors. Data that did not show a normal distribution due to extreme skewness was ranked and transformed to normal distri-bution (ND) before applied t-test analysis. The determination of correlations between variables were done by Pearson’s correlation test; in order to set the critical point to predict mortality for APACHE II, TH, IL-6, IL-10 and albumin levels Receiver Operating Characteristic Curve was applied, results are presented as area under the curve (AUC) with sensitivity and specificity. Independent mortality predictors’ assessment was done by multivariate binary logistic regression, after weight the cases and step wise input. All data were analyzed using Statistical Package for Social Sciences (SPSS) version 18 software (SPSS Inc., Chicago, IL, United States), with significance of anyp< 0.05.
3. Results
3.1. General data
Of the 79 patients, 28 were females and 51 males. Average age was 53 ± 3 years old, with age range from 18 to 82.Table 1shows the blood concentration of biomarkers by reason of admission to EICU. Non-survivors’ age range was from 49 to 79 years old. The average of length of stay (LOS) in EICU for non-survivors was 2 days and for survivors 4 days. In-ward LOS for survivors was 12 days, and for none survivors 5 days. Mortality rate within 28 days was 19% with a survival rate of 81%.
3.2. Comparisons
Using the studentt-test, the mean values obtained in the entire cohort were compared first with the normal range and later between survivors and non-survivors. Compared to survivors, non-survivor were older (p = 0.008), with higher APACHE II score (p = 0.003), higher IL-6 plasma levels (p = 0.03), higher IL-10 plasma levels (p = 0.004), and lower albumin serum levels (p = 0.007) (Table 2). Only FT3 was slightly low in the entire cohort studied (p = 0.000), however this value did not show any statistical difference between survivors and non-survivors. FT4 and TSH were both within normal range (Table 1).
Table 1
General data: blood concentration of biomarkers by reason of admission to EICU. Admission reasons n Age FT3
2.8–7.1 pmol/L FT4 12–22 pmol/L TSH 0.27–4.2 IU/L Albumin 40–55 g/L a IL-6 70 pg/ml a IL-10 30 pg/ml APACHE II P15 S N-S Neurologic 5 66 1.70 12.67 1.30 32.80 168.30 54.94 20.03 4 1 Polytraumatism 8 53 2.02 10.88 0.95 34.75 178.77 46.78 14.88 8 Cardiologic 11 60 2.22 13.48 1.26 33.44 164.47 40.08 16.27 10 1 Respiratory 9 60 2.30 16.20 0.99 28.88 261.01 17.37 19.44 7 2 Gastrointestinal 7 54 1.99 10.97 0.68 26.75 209.27 56.63 10.84 6 1 Metabolic 3 34 1.87 11.93 0.90 29.85 324.93 109.02 22.00 3 Sepsis 10 53 1.81 12.07 0.91 26.54 250.37 188.72 19.34 4 6 Hematologic 12 53 1.88 13.41 0.96 26.69 204.46 189.78 20.61 10 2 Renal 10 59 2.11 11.72 2.06 34.65 194.48 79.82 19.82 8 2 Others 4 47 2.46 10.88 1.79 34.29 108.39 16.70 13.25 4
Mean concentration values, the superior row shows the normal range values. a
3.3. Correlations
In the entire cohort, APACHE II score had direct correlation with mortality (r2= 0.409p= 0.000). High IL-6 levels showed a direct correlation with IL-10 (r2= 0.269 p = 0.017), and negative correla-tion with albumin (r2=0.437 p = 0.000) (Fig. 1a). Meanwhile high IL-10 levels had a negative correlation with FT3 (r2=0.290 p = 0.010) and albumin (r2=0.416 p = 0.000) (Fig. 1b and c).
Hence, low albumin levels had a direct correlation with FT3 levels (r2= 0.264 p = 0.022) (Fig. 1d).
3.4. Independent predictors
The results of multivariate binary logistic regression showed that IL-10, albumin and APACHE II were independent mortality predictors. This analysis also showed that the model of predictors Table 2
Comparison of mean values usingt-test (2-tail) n = 79. Entire cohort p1
value df-78
Survivors (81%) n = 64
95% C.I. Non survivors (19%) n = 15 95% C.I. p2 value df-77 Age in years 53 52 ±4 60 ±5 0.008 APACHE IIa 17 0.042 15 ±3.52 21 ±1.52 0.000 FT3 (pmol/L) 2.00 0.000 2.05 ±0.15 1.96 ±0.21 0.403 FT4 (pmol/L) 12.32 3.63 12.09 ±1.62 13.32 ±1.6 0.77 TSH (IU/L) 1.13 0.000 1.12 ±0.20 1.17 ±0.58 0.827 IL-6 (pg/ml)a 195.28 0.000 184.73 ±45.12 240.03 ±28.89 0.017 IL-10 (pg/ml)a 66 0.028 43.83 ±71.81 159.98 ±34.20 0.000 Albumin (g/L) 32 0.000 32.84 ±1.8 27.04 ±3.77 0.000
p1Comparison between normal ranges and the entire cohort; p2Comparison between S and N-S; (df) degrees of freedom. C.I. Confidence Interval. a
Compared with the physiological reference in healthy individual, critical value from AUC.
Fig. 1.Scatter dots of correlations, important percentage of the dots are near to the base line showing significant correlation. (a) High IL-6 has inverse correlation with albumin. (b) High IL-10 show inverse correlation with albumin. (c) High IL-10 has inverse correlation with FT3. (d) Low albumin has direct correlation with FT3.
improved the ability to predict mortality with overall percentage from 51% only by chance to 85% with the predictors.
A test of the full model (IL-10, albumin and APACHE II) showed a significant goodness of (P = 0.000) and good calibration (Hosmer and Lemeshow p = 0.109). Table 3 provides the odds for each independent predictor.
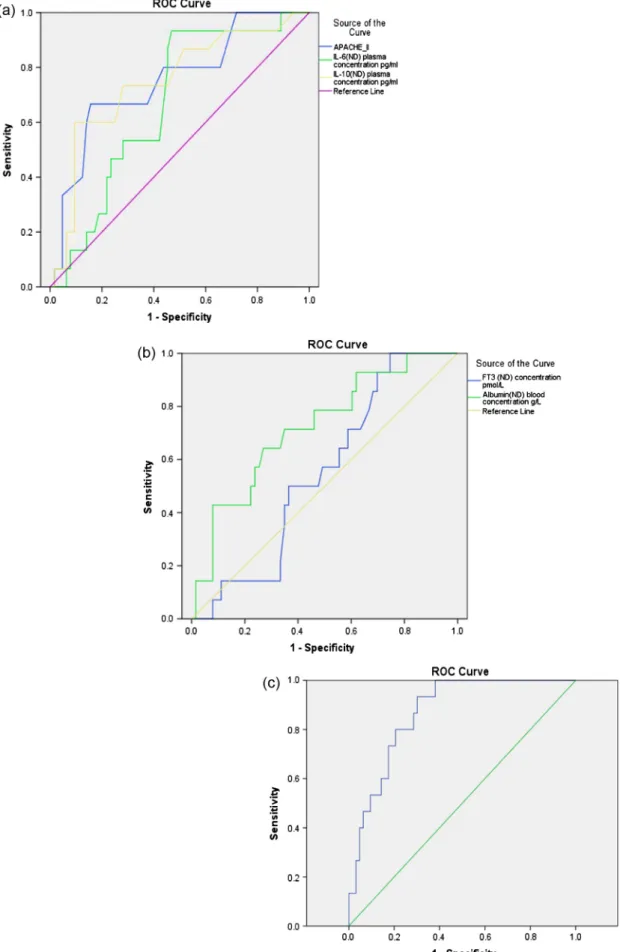
3.5. Critical value to predict mortality
The maximum values of APACHE II scores, IL-10 and the mini-mum levels of albumin showed significance (p < 0.05) and a good (0.70–0.79) AUC (Table 4andFig. 2a and b). Meanwhile the maxi-mum levels of IL-6 showed significance as well (p = 0.043) but a moderate (0.60–0.69) AUC. Despite the sensitivity and specificity to predict mortality were similar for APACHE II scores and IL-6, only IL-10 showed high sensitivity and specificity (Table 4).
The prediction model that included APACHE II scores, IL-10, Albumin, showed a very good AUC (0.897) and significance (p = 0.000) (Table 4andFig. 2c).
4. Discussion
To our best knowledge, this is the first study that compares the ability of these variables (IL-6, IL-10, FT3 and albumin) predicting mortality at EICU admission in case-mix critically ill patients. The present study of 79 unselected critically ill patients found that the low FT3 serum levels did not show any significant difference between survivors and non-survivors. However, as shown by the multivariate logistic regression test, IL-10 and albumin and APACHE II scores were independent mortality predictors. This model also showed to improve the mortality prediction from 51% only by chance to 85% with a significant goodness of fit (p = 0.000) and good calibration (Hosmer and Lemeshow p = 0.109)[50]. The ROC evaluation based on the classification of Keegan[50]for scoring systems showed that the maximum values of APACHE II score, IL-10, and lowest albumin values had a good AUC (0.70–0.79) while the maximum IL-6 values showed a moder-ate (0.60–0.69) predictive value for EICU mortality. Meanwhile the lowest values of FT3 did not have any predictive value for mortality at EICU admission.
Previous studies that have reported the relevance of low T3 as mortality predictors in ICU patients[30,31], did not consider the relationship of TH with albumin and cytokines as confounding fac-tors. Thus our results are similar to other studies that did not find any predictive value of Low T3 or FT3 at ICU admission[32,33].
An alternative explanation for this finding may be attributed to the pathophysiology of LT3. As stated before, NTIS is a common endocrinal alteration that occurs during the acute and chronic phase of critical illness[3–5]. However several authors stated that factors such as, fasting with subsequent depletion of selenium, leptin and ATP, inhibit the functions of the thyroid deiodinases (D1, D2, D3) that metabolize TH, causing lower T3 blood levels commonly seen in critical patients[9–14]. Moreover, several drugs used in ICU setting such as dopamine, amiodarone, furosemide, etc., and free fatty acid as well [25,26], all competing with the thyroid hormones to bind TBG, transthyretin and albumin. Addi-tionally these carriers can be found frequently decreased in critical illness as demonstrated by Afandi et al.[27]. Hence, it is important to note that during the acute critical illness other hormones that are massively released (i.e., cortisol) can have an inhibitory effect in TSH that finally leads to LT3[14,28].
One study in fatal patients with head injury by Zhou et al.[29]
found that TT3 decreased to its lowest levels at 96 h after ICU admission, showing that the decreasing levels of TH in critical illness is a progressive and dynamic process. This could explain the lack of significance of low FT3 in our study between survivors and non-survivors at EICU admission.
The fact that low albumin showed a direct correlations with FT3 (r2= 0.264, p = 0.022) is quite surprising. Theoretically, free thyroid hormones are the unbound fraction available to enter directly into the cell to exert its effect and regulate TH feedback. Moreover it has been postulated that the concentration free thyroid hormones is inversely proportional to the concentration of unoccupied TT4/ TT3-TBG binding sites[34,35], therefore, drugs or other proteins that bind TBG will decrease the free fraction of TH. Hence, hypoal-buminemia that is commonly seen in critically ill patients might be interpreted as a marker of protein-calorie malnutrition causing depletion of amino acids and ATP necessary for the functions of the deiodinases to convert T4 to T3 that influences in the low FT3 levels[36].
In the other hand, cytokines such as TNF-
a
and IL-6 and IL-10 actively increased during the acute phase of critical illness, decrease the transcription of mRNA necessary for the synthesis of albumin in the hepatocyte by a nucleotide polymorphism in the promoting region of cytokines[36–38]this could be supported by the negative correlation with IL-6 (r2=0.437 p = 0.000) in our study. However the nature of the negative correlation of IL-10 with albumin (r2=0.416 p = 0.000) is currently unknown. Therefore it will remain for future study the accuracy of these correlations in critical illness, in order to assess its potential use as inexpensive marker of cytokines levels.Table 3
Multivariate logistic regression, odds ratio of variables for predicting mortality in EICU.
Variables B S.E. Wald df P value OR 95% C.I. for OR
Lower Upper APACHE_II 0.224 0.068 10.986 1 0.001 1.251 1.096 1.428 Interleukin_10ND 0.008 0.003 7.037 1 0.008 1.008 1.002 1.015 Albumin_ND 0.158 0.057 7.647 1 0.006 0.853 0.763 0.955 Constant 3.427 2.480 1.909 1 0.167 0.032 Table 4
Area under the curve of variables and critical values to predict EICU mortality.
Variable AUC-ROC P value Cutoff value Sensitivity (%) Specificity (%)
APACHE II 0.753 0.002 P15 80 56 IL-10 0.750 0.003 P114 73 72 Albumin 0.721 0.010 632 79 54 IL-6 0.669 0.043 P189 80 55 FT3 0.549 0.570 2.02 53 52 Predictor model 0.897 0.000
Fig. 2.AUC of mortality prediction. (A) Variables with the highest values to predict mortality. (B) Variables with the lowest values to predict mortality. (C) Model of the multivariate logistic regression with the all the independent predictor into the model.
In our study low albumin was found to be an independent mor-tality predictor. During critical illness low albumin levels reflect visceral status, with consequent decrease in the protective functions of albumin such as plasma oncotic pressure regulator, antioxidant, antiplatelet agent, endothelial stabilization, immunomodulation and as protein carrier, thus most of the reports with wide data en patients with ESRD showed that low albumin was the most powerful independent predictor[37,39,40], however our study toke multiple cases to asses mortality.
As we expected, cytokines IL-6 and IL-10 levels were significant higher, firstly in the entire cohort (p < 0.05) and secondly in non-survivors (p < 0.05). It is well know that cytokines such as IL-1, TNF-
a
, IL-6 and IL-8 are produced as part of the initial immune response caused by systemic illness, trauma, intoxication or skin burn. However, IL-1 and TNF-a
, are almost undetectable in blood due to their low concentrations and short life, thus, studies stated that IL-1 and TNF-a
act synergistically and enhance the production of IL-6 and IL-8[41], but only IL-6 is produced in large quantity that allow its plethoric effects involved in several neuroendocrine changes [41–43]. Hence, IL-6 has been demonstrated to cause inhibition of thyroid deiodinase especially D1, D2 and D3 by the increase of ROS and depletion of the intracellular co-factor glutathione[44]. The evidence for other cytokines commonly pro-duced during critical illness, such as IL-1, TNF-a
, IFN-c
and IL-8, suggested that it does not have any effect or relationship with LT3, although this fact might be attributed to difficult translation from cellular or animal models to human trials[17,45], thus our study did not include the previous cytokines mentioned.Despite the lack of correlation of IL-6 with FT3 in this study, it does not exclude the cause-effect relationship of cytokines and NTIS supported by previous studies[41–44]and might be attribu-ted to the limiattribu-ted number of patients in our study. However the negative correlation of high IL-10 and FT3 (p = 0.010) would at least statistically suggest that IL-10 is related with NTIS in our study, similarly found in patients with chronic renal failure[46].
Finally it is notable that in our study IL-10 proved to be a strong independent predictor of mortality similarly to previous studies
[51,52]. This fact might be attributed to its potent inhibitory effect on proinflammatory cytokines from immune cells that cause endo-crine changes as explained early, and higher IL-10 levels suppress the immune system exposing the patients to a variety of nosoco-mial infection during critical illness leading to death[47–49].
Thus this study has demonstrated that cytokines IL-6, IL-10, and albumin are more reliable predictors of disease severity and mortality. When combined with APACHE II score, these markers will improve mortality prediction in case mix acute critical patients compared with thyroid hormones decrease alone. 4.1. Limitations
Some limitations in this study merit consideration. First, the sample size of the population studied (survivors and non-survivors) was small limiting the statistical power. Second we measured the variables only at EICU admission; serial measure-ments that include multiple cytokines and cytokine’s mRNA sequences will provide more robust evidence to assess the predominant predictor.
5. Conclusions
Our study showed that IL-6 and IL-10 are correlated with Low FT3 and hypoalbuminemia. Thyroid hormones assessed at EICU admission did not have any predictive value in our study. And finally, high levels of IL-6 and IL-10 in conjunction with albumin could improve our ability to evaluate disease’s severity and predict
mortality in the critically ill patients. When use in combination with APACHE II scores, our model showed improved mortality prediction.
Conflict of interest
All authors declare that there is no conflict of interest.
Founding
This study was founded by the Department of Research of Xiangya Hospital-CSU.
Acknowledgments
The authors wish to thanks to Dr. Hong Yi associate professor of the Department of molecular biology of Xiangya Hospital – Central South University, Dr. Yuan Li PhD candidate and Dr. Zheng-bin Yao for their collaboration during this study.
References
[1]W. Knaus, E. Draper, D. Wagner, et al., APACHE II: a severity disease classification system, Crit. Care Med. 13 (10) (1985) 818–829.
[2]Bin Du, Xiu-ming Xi, De-chang Chen, et al., Clinical review: critical care medicine in mainland china, Crit. Care 14 (2010) 206.
[3]G. Van den Berghe, F. De Zegher, R. Bouillon, Clinical review 95, acute and prolonged critical illness as different neuroendocrine paradigms, J. Clin. Endocrinol. Metab. 83 (6) (1998) 1827–1834.
[4]A. Boelen, J. Kwakkel, E. Fliers, Review: beyond low plasma T3: local thyroid hormone metabolism during inflammation and infection, Endocr. Rev. 32 (5) (2011) 670–693.
[5]S.M. Wajner, A.L. Maia, News insights toward the acute non-thyroidal illness syndrome, Front. Endocrinol. 3 (8) (2012) 1–7 (Mini Review Article). [6]K. Plikat, J. Langgartner, R. Buettner, et al., Frequency and outcome of patients
with nonthyroidal illness syndrome in a medical intensive care unit, Metab., Clin. Exp. 56 (2007) 239–244.
[7]S. Tognini, F. Marchini, A. Dardano, et al., Non-thyroidal illness syndrome and short-term survival in a hospitalized older population, Age Ageing 39 (2010) 46–50.
[8]A. Tas, Tetiker, Y. Beyazit, et al., Thyroid hormone levels as a predictor of mortality in intensive care patients: a comparative prospective study, Wien KlinWochenschr 124 (2012) 154–159.
[9]R. Peeters, S. Van der Geyten, P. Wouters, et al., Tissue thyroid hormones levels in critical illness, J. Clin. Endocrinol. Metab. 90 (12) (2005) 6498–6507. [10] L. Mebis, G. Van den Berghe, Review: the hypothalamus-pituitary-thyroid axis
in critical illness, J. Med. 67 (10) (2009) 332–340.
[11]L. Mebis, Van den Berghe, Thyroid axis function and dysfunction in critical illness, Best Pract. Res. Clin. Endocrinol. Metab. 25 (2011) 745–757. [12]R.M. Lechan, The dilemma of the non-thyroidal illness syndrome, Acta
Bio-med: Atenei Parmensis 79 (3) (2008) 165–171.
[13]M.H. Warner, G.J. Beckett, Mechanisms behind the non-thyroidal illness syndrome: an update, J. Endocrinol. 205 (1) (2010) 1–13.
[14]L. De Groot, Dangerous dogmas in medicine: the nonthyroidal illness syndrome, J. Clin. Endocrinol. Metab. 84 (1) (1999) 151–164.
[15]A. Boelen, M.C. Platvoet-TerSchiphorst, W.M. Wiersinga, Association between serum interlukine-6 and serum 3,5,30-triiodothyronine in nonthyroidal illness, J. Clin. Endocrinol. Metab. 77 (6) (1993) 1695–1699.
[16]L. Bartalena, S. Brogioni, L. Grasso, et al., Relationship of the increased serum interleukin-6 concentration to changes of thyroid function in nonthyroidal illness, J. Endocrinol. Invest. 17 (4) (1994) 269–274.
[17]L. Bartalena, F. Bogazzi, S. Brogioni, et al., Review: role of cytokines in the pathogenesis of the euthyroid sick syndrome, Eur. J. Endocrinol. 138 (6) (1998) 603–614.
[18]G.G. Gauglitz et al., Are serum cytokines early predictors for the outcome of burn patients with inhalation injuries who do not survive?, Crit Care 12 (3) (2008) 81–89.
[19]D. Andaluz-Ojeda, F. Bobillo, V. Iglesias, et al., A combined score of pro and anti-inflammatory interleukins improves mortality prediction in severe sepsis, Cytokine 57 (2012) 332–336.
[20] Xiao-jun Xu, Yong-ming Tang, Hua Song, et al., A multiple cytokine score for the prediction of disease severity and pediatric hematology/oncology patients with septic shock, Cytokine 64 (2013) 590–596.
[21]Xin Zhou, M. Fragala, J. McElhaney, et al., Conceptual and methodological issues relevant to cytokine and inflammatory marker measurements in clinical research, Curr. Opin. Clin. Nutr. Metab. Care 13 (5) (2010) 541–547. [22]A. Friebe, H.D. Volk, Stability of tumor necrosis factor alpha. Interleukin 6 and
interleukin 8 in blood sample of patient with systemic immune activation, Arch. Pathol. Lab. Med. 132 (2008) 1802–1806.
[23]W. De Jager, K. Bourcier, G. Rijkers, et al., Prerequisites for cytokine measurements in clinical trial with multiplex immunoassay, BMC Immunol. 10 (2009) 52.
[24]B. Maier, H.L. Laurer, S. Rose, et al., Physiological levels of pro-and anti-inflammatory mediators in cerebrospinal fluid and plasma: a normative study, J. Neurotrauma 22 (7) (2005) 822–835.
[25]G. Van Den Berghe, F. De Zegher, D. Valsselaers, et al., Thyrotropin-releasing hormone in critical illness: from a dopamine-dependent test to strategy for increasing low serum triiodothyronine, prolactin, and growth hormone concentrations, Crit. Care Med. 24 (4) (1996) 590–595.
[26]O. Koulouri, C. Moran, H. David, K. Chatterjee, M. Gurnell, Pitfalls in the measurement and interpretation of thyroid function tests, Best Pract. Res. Clin. Endocrinol. Metab. 27 (6) (2013) 745–762.
[27]B. Afandi, G. Schussler, A.H. Arafeh, et al., Selective consumption of thyroxin-binding globulin during cardiac bypass surgery, Metabolism 49 (2) (2000) 270–274.
[28]H. Karga, P. Papaioannou, K. Venetsanou, et al., The role of the cytokines and cortisol in the non-thyroidal illness syndrome following acute myocardial infarction, Eur. J. Endocrinol. 142 (2000) 236–242.
[29]Xiao-Ping Zhou, Meng-yao Zhao, Yi-zhen Ji, et al., Dynamic observation on thyroid function in severe head injury, Chin. Med. J. 103 (4) (1990) 335–338. [30]E. Chinga-Alayo, J. Villena, A. Evans, M. Zimic, Thyroid hormones levels improve the prediction of mortality among patients admitted to the intensive care unit, Inten. Care Med. 31 (2005) 1356–1361.
[31]F. Wang, W. Pan, H. Wang, et al., Relationship between thyroid function and ICU mortality: a prospective observation study, Crit. Care 16 (1) (2012) R11. [32]N.K. Anand, V. Chandra, R.S.K. Sinha, et al., Evaluation of thyroid Function in
critically ill infants, Indian Pediatr. 182 (18) (1994) 156–168.
[33]S. Meyer, P. Schuetz, M. Wieland, et al., Low triiodothyronine syndrome: a prognosis marker for outcome in sepsis?, Endocrine 39 (2011) 167–174 [34]D. Gardner, D. Shoback, Greenspan’s Basic and Clinical Endocrinology, 9th ed.,
McGraw-Hill, 2011.
[35] Kronenberg, Williams Text Book of Endocrinology, 11th ed., Elsevier, 2008. [36]J.P. Nicholson, M.R. Wolmarans, G.R. Park, The role of albumin in critical
illness, Brit. J. Anaesth. 84 (4) (2000) 599–610.
[37]T. Horwich, K. Kamyar, G. Fanarow, et al., Low serum albumin levels are strongly associated with inflammation but not with body mass index in advanced heart failure patients, J. Cardiac Fail. 13 (6) (2007) 099.
[38]V. Balakrishnan, Da-qing Guo, M. Rao, Cytokine gene polymorphisms in hemodialysis patients: association with comorbidity, functionality, and serum albumin, Kidney Int. 65 (2004) 1449–1460.
[39]R. Bologa, D. Levine, T. Parker, et al., Interleukin-6 predicts hypoalbuminemia, hypercholesterolemia and mortality, Am. J. Kidney Dis. 32 (1) (1998) 107–114. [40]P. Goldwasser, J. Feldman, Association of serum albumin and mortality, J. Clin.
Epidemiol. 50 (6) (1997) 693–703.
[41]A. Turnbull, C. Rivier, Regulation of the hypothalamic-pituitary-adrenal axis by cytokines: actions and mechanisms of action, Physiol. Rev. 79 (1) (1999) 2–43. [42]D. Papanicolaou, Review: interleukine-6: the endocrine cytokine, J. Clin.
Endocrinol. Metab. 85 (3) (2000) 1331–1333.
[43]S.J. Hopkins, The pathophysiological role of cytokines, Leg. Med. 5 (2003) 45– 57.
[44]S. Wajner, L. Goemann, A. Bueno, IL-6 promotes nonthyroidal illness syndrome by blocking thyroxine activation while promoting thyroid hormone inactivation in human cells, J. Clin. Invest. 121 (5) (2011) 1835–1845. [45]D. Papanicolaou, Euthyroid sick syndrome and the role of cytokines, Rev.
Endocr. Metab. Disord. 1 (2000) 43–48.
[46]H. Abo-Zenah, S. Shoeb, A. Sabry, et al., Relating circulating thyroid hormone concentration to serum interleukins-6 and 10 in association with non-thyroidal illnesses including chronic renal insufficiency, BMC Endocr. Disor. 8 (2008) 1.
[47]K. Kasten, J. Muenzer, C. Cadwell, Neutrophils are significant producers of IL-10 during sepsis, Biochem. Biophys. Res. Commun. 393 (2010) 28–31. [48]A. Oberholzer, C. Boberholzer, L. Moldawer, Cytokine signaling-regulation of
the immune response in normal and critical ill states, Crit. Care Med. 28 (4) (2000) 3–17.
[49]S. Opal, V. De Palo, Anti-inflammatory cytokines, CHEST 177 (2000) 1162– 1172.
[50]M. Keegan, O. Gjic, B. Afessa, Severity illness scoring in the intensive care unit, Crit. Care Med. 39 (1) (2011) 163–169.
[51]Hon-Kan Yip, Ali A. Youssef, Li-Teh Chang, et al., Association of interleukin-10 with increased 30 day mortality in patients with ST-segment elevation acute myocardial infarction undergoing primary coronary intervention, Circ. J. 71 (2007) 1086–1091.
[52]C. Wunder, O. Eichelbrönner, N. Roewer, Are IL-6, IL-10 and PCT plasma concentrations reliable for outcome prediction in severe sepsis? A comparison with APACHE III and SAPS II, Inflamm. res. 53 (2004) 158–163.