ESCIRRU Working Paper No. 21
Ukrainian Firm-Level Export Dynamics:
Structural Analysis
Yevgeniya Shevtsova
(Center for Economic Reform and Transformation, Heriot-Watt University)
Ukrainian Firm-Level Export Dynamics: Structural Analysis
* Yevgeniya Shevtsova †Abstract
The paper studies the dynamics of exporting activity at the extensive and intensive margins and its impact on the firm-level total factor productivity growth for Ukraine manufacturing and service sectors in 2000-2005.
The estimation is performed for different types of export markets distinguishing between developed and developing countries; and for different types of export products, distinguishing between capital versus labour intensive products and raw materials.
The main finding of the paper suggests that significant share of productivity gains occur in the long term, when firms adjust to the international market conditions and become larger exporters. Performing the analysis for different types of export markets and export products confirms that exporting to the more technologically advanced countries results in higher productivity gains due to the access to new superior technologies, better managerial practices, etc. Also in some cases productivity gains are higher in the case when capital intensive products are exported to the economically advanced markets, such as European Union.
JEL codes: D24; F14; L25
Keywords: exports; TFP; quanile regressions
*
I would like to thank Doctor David Brown for his continuous guidance and valuable comments. All remaining errors are the responsibility of the author.
†
Contents
Introduction...3
Literature review ...6
Stylized facts about firm-level exports ...11
Empirical Analysis...12
Analysis of Export Trends: Industry-Level Dynamics ...15
Analysis of Export Trends: Firm-level dynamics ...17
Exporting Activity - Productivity Links ...23
Conclusion ...31 References...35 Appendix A...38 Appendix B ...40 Appendix C ...41 Appendix D...42 Appendix E ...43 Appendix F...44 Appendix G...45 Appendix H...46 Appendix J ...47 Appendix K...48 Appendix L ...49 Appendix M ...50
Introduction
In the following paper the focus is made on exploring the linkages between plants’ exporting activity and productivity performance. However, now I will try to widen the scope of the study to explore export dynamics at the intensive and extensive margin. Indeed the existence of plant-level productivity gains from international market exposure is the corner-stone of the trade policy. Productivity gains from engagement in international trade usually serve as a main justification of the trade liberalization policies. Pre-entry productivity gains are mainly associated with a higher level of competition in international markets, which requires potential entrants to improve their efficiency before the entry. Post-entry gains usually come in the form of increased returns to innovation, economies of scale, better managerial practices, reduced X-inefficiency, etc.
Majority of the recent literature studying performance of the exporting firms has been focusing on the exporting dynamics at the extensive margin – entries into and exits from the export markets. The findings mainly confirm positive productivity gains from exporting in the short run, however over the longer periods some of the new entrants exit the export markets, which leads to significant losses in productivity. The analysis of exporting dynamics at the extensive margin – conducted in the previous chapter – is explained by strong empirical evidence of significant sunk costs of exporting. The empirical evidence of the sunk entry cost - given by Roberts and Tybout (1997) - states that exporting in a current period increases the probability of exporting in the next period by 36%. From the other hand Bernard and Jensen (2004a) show that depending on the number of years of exporting the probabilities of exporting and non-exporting are almost the same.
Taking into account the sunk costs of exporting, potential entrants make efficiently-improving investments prior to the entry into the export markets, which results in the efficiency gains associated with the entry. And again given the irreversible nature of these investments exit from exporting would be associated with an efficiency loss. Entry sunk costs also generate so called “export hysteresis” – a range of inaction on
exporting would prefer suffer temporary losses in case of a fall in demand for their products rather than exit from the export markets instantly. This in turn implies significant productivity decline prior to the exit from exporting. On the other hand current exporters will be the first to take advantage of any improvements in foreign demand.
These predictions imply that entries and exits from the export markets may not play a major role in an aggregate export response to the changes in the economic environment, and the relationship between productivity performance and export dynamics at the intensive level deserves a much closer attention.
In the current paper I will continue working with the dataset of Ukrainian firms for the period 2000-2005 to study the exporting dynamics and total factor productivity growth at the micro-level. However, the focus will be made on analysis of the export dynamics at the intensive margin.
In my analysis I follow Voicu (2009) and represent plant export status using eleven-state variable that would include information on the plant’s exporting status and relative position (for exporting firms) in the industry-specific distribution of exports (the matrix would contain 10 deciles with each plant falling in a specific decile depending on its position in the industry export distribution). In the scope of the current analysis I focus only on the most export-intensive manufacturing industries. I construct the industry-specific matrix of year-to-year transitions across the eleven states to study entries, exits, and changes in export sales of the plants that export in consecutive years. This approach allows me to describe export dynamics at the intensive margin (export intensity) and also capture the quantitative aspect of entry and exit, i. e. analyse the level of exporting activity at which plants enter into and exit from the international markets.
Previous empirical findings suggest that exporting activity has a ladder structure. More entries into and exits from the export market take place at the bottom of the ladder with new exporters typically engaging in the small scale exporting operations, and exiting plants usually appearing to be small exporters. There is also an intense dynamics of the exporting activity at the intensive margin; however most of the movements across the export distribution take place between two adjacent deciles.
Firms’ movements across the export distribution account for a greater share of the industry aggregate changes in such aggregate variables as exports, employment, output and productivity than entries and exits from the export markets. Firm-level improvement in TFP are also correlated with the type of the firm exporting dynamics. Improvements in the firms’ relative position in the industry-specific distribution of exports are associated with gains in average TFP, while deteriorations in firm’s relative position imply losses in the average TFP.
The analysis starts with the study of the structure of Ukrainian exporting activity and defines the shape of Ukrainian export distribution during 2000-2005.
The second part of the chapter estimates the impact of firms movements across the export distribution and firms’ entries into and exits from the export markets on the industry-level changes in all relevant variables – exports, employment, output, productivity;
The last section of the chapter concentrates on continuous exporters to study the impact of the type of firms’ exporting dynamics (increase/decrease in export intensity) on the firm-level changes in the TFP. To study this relationship in more detail the study distinguishes between different types of export markets, with a priority given to the countries with high levels of economic development, e. g. countries of the European Union, OECD, and CIS; and different types of export products, distinguishing between capital versus labour intensive products and raw materials. This methodology also allows test the hypothesis that increase in exports to the more economically developed and technologically advanced markets leads to considerable gains in productivity for the exporting firms, especially when capital intensive products are exported.
The rest of the paper is organised as follows: section 1.2 summarises main relevant literature in the area of study; section 1.3 provides the summary of descriptive statistics; sections 1.4 and 1.5 present methodology of the empirical analysis and discuss the results. The conclusions follow in section 1.6.
Literature review
Motivation for the current chapter is driven by the two sets of literature that to a significant extent overlap with the literature discussed in the previous chapter.
Theoretical motivation stems from two related strands. First strand includes models of exporting dynamics with heterogeneous firms and sunk costs of exporting. Major theoretical findings in this area were introduced by Roberts and Tybout (1997), Melitz (2003), Bernard, Eaton at al (2003), Helpman et al. (2004), Helpman, Melitz and Yeaple (2004) and contained new approaches to the analysis of firm heterogeneity and participation in international markets. One of the main findings of these models suggests that significant entry sunk costs of exporting create a range of inaction, so called export hysteresis, at the decisional margin among the firms that consider entering export markets. Different kinds of uncertainties (such as imperfect information on foreign markets, exchange rate valuations, etc.) about market conditions widen the range of inaction. In the light of the sunk cost of exporting the firms would be inclined to keep their current export status over the range of changing economic values. Incumbents would be reluctant to exit from international markets having paid sunk-costs and potential exporters would be hesitant to enter in the light of significant investments required to start exporting activity. This might help explaining the variability of the effect of exchange rate fluctuations in different countries with the different amounts of exporting and non-exporting firms in each country. Due to the inaction range most of the responses to changes in international economic environment are concentrated on current exporters; countries with higher share of exporting firms would experience larger impact of any change in international economic environment than those targeted at domestic production. Roberts and Tybout (1997) have provided one of the first empirical estimations in support of the theory of sunk cost. Using the data on 650 Colombian plants for the period 1981-1989 they relate the past to the current exporting status and show that sunk cost matter for the export participation decision; moreover the increase in sunk cost widens the range of inaction. Their idea has been further exploited by other researchers with some alterations in the techniques and models estimated (Bernard and Wagner , 1998; Bernard and Jensen, 2001; Campa, 2000).
The second strand of literature includes models of firms’ dynamic employment and investment decisions under uncertainty with significant adjustment costs of labour and capital (Hammermesh and Pfann, 1996; Dixit, 1989, 1992, 1997; Bentolila and Bertola, 1990). The results of the dynamic labour demand and investment theory imply that fixed and linear adjustment costs also generate the region of inaction in the adjustment of the use of inputs. In case the value of the adjustment exceeds costs, the firm will immediately (in the case of fixed costs) or gradually (in the case of convex costs) converge to the optimal input levels; or to levels determined by the inaction region (in the case of linear costs).
Another strand of research targeted at studying the relationship between firm productivity and its international activity has received much attention in the recent empirical and theoretical literature after a paper by Bernard and Jensen (1995)‡ who were ones the first to study the different distinctive characteristics of the exporting and non-exporting firms of the same industry. Their main finding was that, while future and new exporters has ex-ante acquired superior characteristics compared to average non-exporting firms. However, they found no significant difference in the productivity growth of exporting firms as compared to non-exporters regardless of the productivity measure (labour productivity or TFP).
The availability of the new more detailed micro-level datasets has fuelled empirical analysis of the intra-industry firm heterogeneity and domestic micro-level effects of trade liberalization policies in a large number of countries. A whole set of studies investigated consequences of trade liberalisation experiments on the domestic market (i. e. NAFTA effect, etc). Majority of the empirical studies that study the impact of trade liberalisation on the structure of domestic industries concentrate on the three main trade channels: import discipline effect, scale effect and turnover hypothesis. Import discipline effect leads to increase in manufacturing productivity as trade liberalisation exposes domestic producers to greater competitive pressure. It affects productivity in three ways: reduces X-inefficiency, forces firms to increase their output and improve their scale efficiency, increases firms incentive to innovate. Scale effect is believed to have a positive productivity impact due to the access to
international markets, which should theoretically lead to increase in output leading to the economies of scale. Turnover hypothesis states that increased competitive pressure would make the least productive firms exit form the markets leading to aggregate productivity gains.
The effect of trade liberalisation has been investigated by many scholars. Papers by Pavcnik (2002), Tybout and Westbrook (1995), Fernandes (2001), Muendler (2002) study the effect of trade liberalisation policies on the structure of domestic industries in Chile (1979-1986), Mexico 1990), Colombia (1977-1991) and Brazil (1986-1998). All studies confirm the presence of a strong positive productivity effect of trade liberalisation.
Tybout and Westbrook (1995) estimate plant-level productivity impact of the trade liberalization policies on Mexican manufacturing industries during 1984-1990. In 1985 Mexico implemented massive trade liberalization programme, which involved elimination of import licensing requirements and significant tariff rates reduction. The authors decompose industry-wide productivity changes into three components: reallocation of output shares between plants with different average costs of production; plant-level economies of scale effect and a residual term that shows increase in the plants multifactor productivity. The results of the paper imply that efficiency gains due to the economies of scale were minor comparatively to the firm-level multifactor productivity gains that appeared to be the dominant source of aggregate efficiency gains during the sample period. The increase in productivity was shown for most of the manufacturing sectors with the largest gains registered in the import-competing sectors. Most of the sample sectors also show significant reduction in the average cost. However, for the export-oriented sectors the fall in the average cost of production was mostly due to favourable changes in relative prices. This study was one of the first in the area and was followed by a number of similar studies for different countries.
For example, Pavcnik (2002) empirically estimates productivity gains for a panel of Chilean manufacturing firms. The period of study covers years 1974-1986 and provides a perfect example to study the dynamics of the firm’s responses to trade liberalization. During this time the country reduced all tariff rates to a uniform ad valorem tariff of 10% across all industries, the only increase in tariff was made in
1983-1984 after the 1982-1983 recession. The results show that trade liberalisation on average raised firms’ productivity, with the increase being significantly higher in the import-competing and export-oriented (traded goods sectors). Least productive plants were forced to exit the market, which increased overall industry productivity. Overall the results of the paper confirm the major role of the firm-level multifactor productivity in the aggregate productivity gains for the Mexican manufacturing industry.
The paper by Lopez-Cordova (2002) studies the impact of trade and investment liberalization following the adoption of the North American Free Trade Agreement (NAFTA) on the Mexican manufacturing during 1993-1999. In particular, the paper studies the evolution of the multifactor productivity on the firm-level. The author explores the links between the evolution of the firm-level total factor productivity and imported intermediate inputs, foreign capital participation, export activity, import penetration and tariff rates in Mexico and the United States. The results of the paper suggest that foreign capital participation and increased import penetration had a positive effect on the total factor productivity, while there is no clear effect of the increased use of the imported inputs or exporting operations.
Overall empirical studies of the effect of trade liberalisation policies on the domestic industry structure confirm positive aggregate and firm-level productivity gains. Moreover the gains are higher for export-oriented traded goods sectors.
Indeed current evidence confirms presence of significant productivity gains from trade liberalization in domestic industries. However, since the range of inaction prevents domestic firms from entering export markets the majority of responses to trade liberalization is still concentrated on current exporters. Recent empirical finding support this view. For example, Bernard and Jensen (2004b) in their study of export response of the US manufacturing plans to dollar depreciation in the 1980’s argue that fluctuations in exchange rate will mostly affect current exporters and lead to changes in the intensive rather than extensive margin. They report that 87% of export expansion was due to the increase of export intensity by current exporters and only 13% from the entry of new firms. Similar results have been reported by Bugamelli and Infante (2002) and Bernard and Jensen (2004a). Bugamelli and Infante (2002) use
of sunk costs on export markets participation. The results of the paper show that the probability of exporting increases by 70% if the firm has been exporting in the previous period, which means that sunk costs matter for export participation decision. To check the robustness of the results they also include a number of firm-specific characteristics and macroeconomic regressors in the analysis. They also show that the impact of sunk costs on export participation negatively related to the firm size. Their results suggest that sunk costs create a barrier to entry export markets especially for the small and medium sized firms.
Baldwin and Gu (2003) in their study of the effect of NAFTA on Canadian firms report increase in both the number of exporters and export intensity. They also find a substantial policy effect on the export entry decision (4.5 percentage points reduction in the US-Canada tariffs increased the probability of exporting by 63%). Blalock and Gertler (2004) study the effects of trade liberalisation in Indonesia during 1990-1996, and find that number of exporting firms has doubled during the sample period.
Overall the studies discussed above confirm that any policy changes such as trade liberalization or export promotion would affect the structure of the domestic industry as well as current exporters at both intensive and extensive margins. There is currently little evidence on what particular aspects of trade policies are more important for export volumes and what parts will have more significant effect on the domestic industry. For example, tariff reduction might lead to improvements in firms’ productivity due to the reduced costs of intermediate inputs or increased market competition (import discipline effect), which may facilitate non-exporters entry into export markets, and at the same time make it easier for current exporters to increase their export sales to existing or new markets.
In the current chapter we will take into account the experience of the previous researchers and analyse the impact of trade liberalization policies on the structure of the four main Ukrainian manufacturing industries with a concentration of the performance of exporting firms.
Stylized facts about firm-level exports
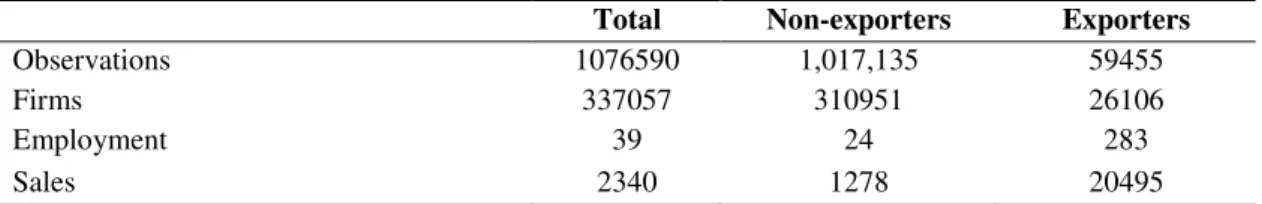
As has been mentioned before, the dataset under study covers the period of 2000-2005. Table below reports summary statistics for several key variables in our sample that initially covers 19 Ukrainian output sectors. First column reports the total number of firms and observations and provides means of several variables. Second and third columns break down these numbers by exporting and non-exporting firms. Table 1. Descriptive statistics
Total Non-exporters Exporters
Observations 1076590 1,017,135 59455
Firms 337057 310951 26106
Employment 39 24 283
Sales 2340 1278 20495
Note: Sales are given in thousands USD
Eexporting behavior of the firms included in the sample reveal substantial heterogeneity in the firms’ export patterns. Around 90 percent of firms do not export at all. Exporters tend to be larger and more productive than non-exporters. As seen from Table 1 exporters employ 11 times as many workers and sell 16 times as much. They are also more likely to import intermediate inputs. This fact is consistent with Bernard et all (2003), who shows that firms engaged in international trade on average outperform their domestic counterparts in a number of dimensions. Also this fact goes in line with the hypothesis of a sunk entry costs of exporting. Logically larger firms would find it easier to make irreversible investments required to enter foreign markets.
An interesting observation is that over the observed time period exports have mostly increased at the extensive margin, i. e. more firms has entered the exports markets. Appendix B shows the fraction of exporting firms in the total number of observations by year and industry, as well as the share of exports in the total sales. As can be seen from the table despite the fact that the number of exporters has increased during the observed time period, the share of exporters in the total number of observations as well as exports share in total sales exhibits no clear time trend.
Empirical Analysis
The goal of the empirical analysis of the current chapter is to study the firm-level export dynamic of the four Ukrainian manufacturing industries during the period of 2000-2005. For convenience I have chosen four most export intensive sectors out of eighteen sectors initially included in the sample. The chosen sectors include: Coke-Chemical-Nuclear, Non-Metallic Minerals, Machinery and Equipment, and Transport Equipment Sector.
Coke-Chemical-Nuclear sector includes such export products as mineral fuel, oil and processed products (27); non-organic chemical products; organic and non-organic compounds of precious and rare-earth metals, isotopes and radioactive elements (28); organic chemical compounds (29); fertilizers (31); other chemical products (38). Non-Metallic Minerals sector includes mostly such export goods as salt, sulphur, grounds and stones, plaster materials, lime and cement (25); goods made of stone, cement, gypsum, asbestos, mica and similar materials (68); ceramic products (69); glass and glass products (70).
Majority of the export goods in the Machinery and Equipment Sector are wood and wood products, charcoal (44); tools and cutlery (82); nuclear reactors, boilers, supporting mechanic equipment and parts (84); electric equipments and parts, sound and TV recording and audio equipment and parts (85); optic, photographic, cinematographic equipment, meters, and check meters; precision, medical and surgical devices and parts (90).
Transport Equipment includes plastic and plastic goods (39); rubber and rubber goods (40); transport vehicles except for rail transport (87); cooper and cooper products (74); aluminium and aluminium products (76); other non-mentioned precious metal products (83).
It has to be mentioned that period under study encompasses devaluation of Ukrainian national currency Hryvna and an overall economic downturn of 2001-2002 followed by a relatively rapid recovery, which prevailed until the recent economic turmoil of 2008-2009. Different aspects of Ukraine relationships with its main trade partners, such as CIS countries, countries of the EU, US and China should also be taken into
account. Being a member of the CIS, Ukraine used to build its trade relations with the CIS countries on the basis of bilateral Free Trade Agreements that have been concluded between all the CIS members. Trade relations between EU and Ukraine during the period of study were mostly based on the Partnership and Cooperation Agreement (PCA) that was put in place in 1998. Two additional agreements were developed to regulate Ukraine exports of some steel and textile products. The last agreement on steel products was in force since 1998 until the end of 2007, and has assigned Ukraine a quota of 1 320 000 tones of steel products per annum. The agreement has been renewed on a yearly basis, with quantities of each product increasing by 2.5% each year, and was terminated on the 21st of May 2009 - the date of Ukraine’s accession to the WTO - with all the quotas been lifted since then. Bilateral trade agreement between the US and Ukraine, which is quite similar to the EU-Ukraine PCA, also implies quantitative restrictions on the Ukrainian export of steel, textile and agricultural products from Ukraine.
Overall, the index of Ukraine’s Trade Freedom provided by Heritage Foundation and Wall Street Journal has increased from 70 to 76.2 during 2000-2005, which confirms gradual liberalization of Ukrainian trade.
In the current paper the analysis of the dynamics of the exporting activity at the intensive level is conducted by evaluating changes in the exporting intensity of the firms that export in consecutive periods and estimating its impact on each firm’s total factor productivity and well as on the overall industry/sector productivity performance. The study also estimates export intensity of the new exporters immediately after entry into the export markets and export intensity of the firms exiting export markets immediately prior to exit.
While estimating the effect of exporting activity on productivity performance of individual firms we distinguish between different types of export markets. Theory predicts larger productivity gains from exporting to the countries of higher levels of technological development especially when capital intensive products are exported. To test this hypothesis we estimate productivity impact of exporting activity concentrating on different export markets, such as countries of European Union (EU) and countries of the Commonwealth of Independent States (CIS), and different
product categories, such as raw materials and labour intensive products versus capital intensive products.
Analysis of Export Trends: Industry-Level Dynamics
We start our analysis with a description of the dynamics of micro-level exporting activity on the extensive and intensive margin. Extensive margin analyses entries and exits from the export markets, while intensive margin focuses on changes in the patterns of exporting activity of the continuous exporters. We also take into account the quantitative aspect of the extensive margin by studying export volumes of the firms entering export markets in the period following entry, and export volumes of the firms exiting from the export market in the period preceding exit. I then proceed with the analysis of the contributions of exporting activity to the changes in the industry aggregate variables such as aggregate exports, output, and employment, unweighted and weighted productivity.
Appendix B shows the number of exporting plants, export and domestic sales by industry. In all four industries firms have been exporting significant part of their output during 2000-2005. In the beginning of the period Coke/Nuclear/Chemical, Transport Equipment and Machinery and Equipment industries show 26, 17 and 22 percent of exporters out of the total amount of firms (export intensity) in each industry respectively. However, exports sales constitute only about 5 percent of total sales in all these industries.
Coke/Nuclear/Chemical industry shows the strongest growth in export sales with a total increase of 1.3 billion USD. Non-metallic Minerals industry has the highest increase in the share of exports in the total sales, 323 percent. This is mostly caused by the steep decline in the domestic sales in this industry towards the end of the period.
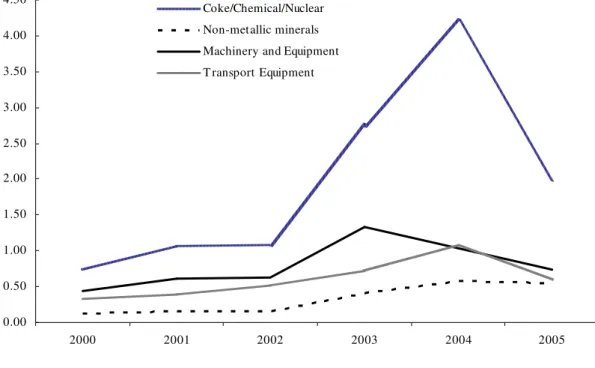
In all four industries the number of exporters increased significantly during 2000-2005. Significant growth in the share of export sales in all four studied industries is followed by a relatively steep decline in 2004-2005 (Figure 1). The negative trend in the exports share is caused by the overall significant increase in domestic sales causing a corresponding decline in the export intensity.
The numbers still show a positive dynamics of export volumes, with an overall increase of 2.2 billion USD§ over the period of study. Export sales in all four industries have increased by 136 epercent; number of exporting plants has increased by 21 percent, with most of the increase taking place during 2003-2005. Export intensity has exhibited weak positive trend (4.86 percent of total sales in 2000, and 5.15 percent of total sales in 2005), which can be explained by the overall increase in domestic output volumes, as domestic sales has more than doubled during the period of study (32 billion USD in 2000, 71 billion USD in 2005).
Figure 1. Dynamics of Export sales by Industry, 2000-2005, billion USD
0.00 0.50 1.00 1.50 2.00 2.50 3.00 3.50 4.00 4.50 2000 2001 2002 2003 2004 2005 Coke/Chemical/Nuclear Non-metallic minerals Machinery and Equipment T ransport Equipment
Source: Own calculations
§
Analysis of Export Trends: Firm-level dynamics
Obviously, industry dynamics described in the previous section is a resulting outcome from individual firm responses to the constantly changing conditions of the economic and particularly international trade environment.
Appendix C shows yearly changes in the percentage of firms in the sample that exit the market, the percentage of firms that start/stop exporting, and the percentage of exporting firms increasing/decreasing their export sales by 25 percent or more.
Changes in export status show a high degree of heterogeneity at the extensive and intensive margin. All four industries exhibit similar time trends with the highest exit rates falling on 2001-2002, years of the economic downturn. The percentage of entries and exits from the export markets slowly decreases toward the end of the period confirming the more stable economic environment during 2003-2005.
The level of heterogeneity is even higher at the intensive margin. In all industries the percentage of exporting firms that increase or decrease their export sales by more than 25 percent remains significant in all years, with rates varying between 35-40 and 50-65 percent respectively.
In the following section I will try to provide a more detailed analysis of the changes in the firm’s exporting activity. In doing so following Voicu (2009) I construct an eleven-state variable. The variable takes value 0 if the firm does not export and a value between 1 and 10 if the firm exports. The value of the variable for an exporting firm depends on its relative position in the industry specific export distribution. To construct the variable I break the distribution of export sales by percentiles. Thus the variable will take value 1 for all firms that fall within the lowest 10% of the industry export sales, and value 10 for all firms that fall within the highest 10% of the industry export sales. The construction of the variable confirms that exporting firms form a very heterogeneous group at any point in time**.
Appendix D compares the following indicators across deciles of industry-specific export distributions:
Export sales (panel A) – export sales volumes for 10 deciles of export distribution in the year 2001;
Export intensity (panel B) – share of export sales in total sales volumes for each of the 10 deciles of export distribution in the year 2001;
Share of total industry exports (panel C) – share of export volumes by each deciles out of total industry exports.
Panel A shows that export sales of the 10 largest percent of exporters are 30 to 70 times higher than industry average, which can be explained by the fact that main exporters in the industries under study are big manufacturing plants with high export volumes. Export intensity, i.e. percentage of export sales in the total sales, presented in panel B, is also significantly higher for larger exporters. Panel C shows that top 10% of exporters account for about 80% of total industry exports, and top 20% - to 90% - 95% roughly.
Yearly transitions across export distribution provide a good reflection of the trends that prevailed in exporting activity during 2000-2005 at both extensive and intensive margin. Following Voicu (2009) I use eleven states variable of the export-status to construct the probability that a firm entering export market will occupy one of the 10 deciles (percentiles) of the export distribution in the entry year, Prob(Export Decilet |
Entryt ) and the probability that a firm exiting export market will exit from one of the
10 deciles of the export distribution in the year of exit, Prob(Export Decilet | Exitt ).
This exercise will help identify prevailing export decision patterns.
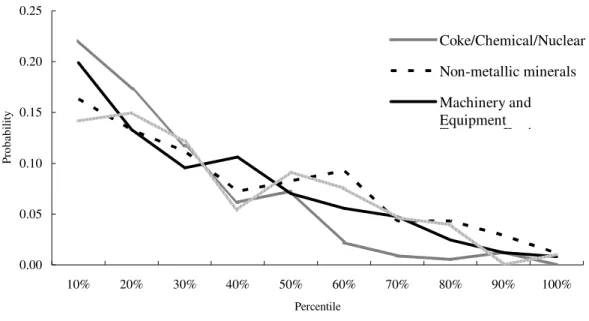
Figure 2. Distribution of entries into the export markets by deciles of export distribution, 2000-2005 yearly transitions
0.00 0.05 0.10 0.15 0.20 0.25 10% 20% 30% 40% 50% 60% 70% 80% 90% 100% Percentile P ro b a b il it y Coke/Chemical/Nuclear Non-metallic minerals Machinery and Equipment Transport Equipment
Note: *Probability of entering into specific percentile of export distribution Own calculations
Figure 2 compares probability of entering the specific decile of export distribution for each of the four industries under study. It shows that the majority of plants that start exporting typically engage in small scale operations. This pattern prevails in all four industries. Around 20% of the new entrants start their exporting operations at the bottom 10% of the industry specific export distribution, with the probability of entering exporting markets declining steeply towards the top of the distribution. First decile accounts for about 15-25% of all the entries into the export markets, and first two deciles together account for about 25-40% of all entries. And about 60% of all entries occur below the median of the export distribution.
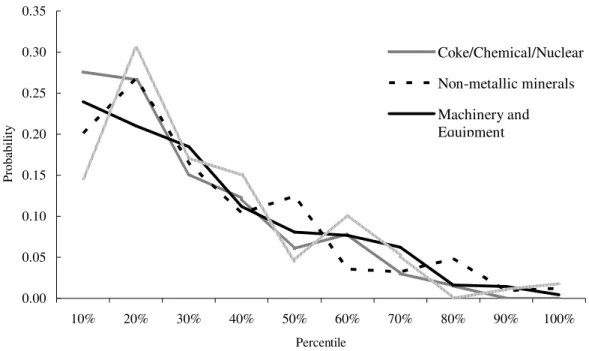
Figure 3. Distribution of exits from the export markets by deciles of export distribution, 2000-2005 yearly transitions
0.00 0.05 0.10 0.15 0.20 0.25 0.30 0.35 10% 20% 30% 40% 50% 60% 70% 80% 90% 100% Percentile P roba bi li ty Coke/Chemical/Nuclear Non-metallic minerals Machinery and Equipment
Note: *Probability of exiting from specific percentile of export distribution Own calculations
Figure 3 compares probability of exiting from the specific export decile across deciles of each industry export distribution, Prob(Export Decilet | Exitt ). The figure shows
that the probability of exit is much higher for small exporters. In all industries under study, the highest probability of exit occurs at the two bottom deciles of the industry specific exports distribution decreasing rapidly across deciles. Two bottom deciles account for about 45-60% of all exits, and about 80% of all firms that exit have exports sales lower than the industry median. The same pattern prevails for all industries.
In order to analyse the dynamics of exporting activity at the intensive margin we concentrate on continuous exporters and use the yearly transitions across deciles of the industry-specific export distribution. The probability range lies between 70 and 95 percent and the graph has an inverted-J shape, which is similar to previous findings. However, current findings differ significantly from the previous empirical evidence††, with the main difference being a high probability of changing relative position in the export distribution even for larger exporters.
Most of the papers report the high mobility for the firms at the middle and bottom of the export distribution and low mobility for large exporters. In our case even large exporters have a high chance of changing their relative position in the distribution of
††
exports, while their probability of changing position is lower than that of smaller exporters it’s still as high as 70%.
Figure 4. Distribution of changing relative position in the distribution of exports, 2000-2005 yearly transitions 0.6 0.7 0.8 0.9 1.0 1.1 10% 20% 30% 40% 50% 60% 70% 80% 90% 100% Percentile P ro b a b il it y Coke/Chemical/Nuclear Non-metallic minerals Machinery and Equipment Transport Equipment
Note: * Probability of changing decile rank in the industry specific export distribution. Own calculations
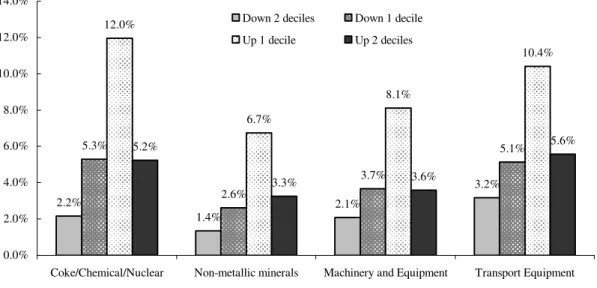
Another interesting finding of the current dataset is the range of changes in the relative position of the continuous exporters. Majority of the papers show that most of the movements across the industry-specific export distribution take place between adjacent or within two deciles.
In the current case however movements between two adjacent deciles account for only for 10-17 percent of all changes, and movements within two deciles – for 14-25 percent with the highest percent of plants moving up by one decile (Figure 5).
The trends of the firm-level exporting dynamics reveal several patterns that can be summarised as follows:
New entrants into the export markets usually operate on the small scale;
Highest percent of the firms that exit the export markets are small exporters;
Low deciles of export distribution can be characterised by higher levels of
mobility at both extensive and intensive margin;
Both extensive and intensive mobility decreases towards the top of the
distribution; with the firms occupying top deciles possessing lower probability of changing their relative position or export status
Figure 5. Firm mobility across industry specific export distribution, yearly transitions 2.2% 1.4% 2.1% 3.2% 5.3% 2.6% 3.7% 5.1% 12.0% 6.7% 8.1% 10.4% 5.2% 3.3% 3.6% 5.6% 0.0% 2.0% 4.0% 6.0% 8.0% 10.0% 12.0% 14.0%
Coke/Chemical/Nuclear Non-metallic minerals Machinery and Equipment Transport Equipment Down 2 deciles Down 1 decile
Up 1 decile Up 2 deciles
Exporting Activity - Productivity Links
Results of the previous sections confirm intensive heterogeneous dynamics of continuous exporters. The results also show that majority of the plants entering and exiting form the export markets are small scale exporters. This shows the importance of the export dynamics on the intensive margin for the levels of aggregate industry growth as well as for the relationship between exporting and productivity on the firm-level.
I base this study of the connection between firm exporting activity and its productivity performance on the transitions into/out the export markets as well as on the movements of individual firms across the deciles of the industry-specific export distribution. More specifically at the intensive margin we distinguish between firms that increase/decrease and do not change their export intensity, thus moving up/down or keeping their position in the distribution if industry exports.
First I compare the contributions of the different types of firms to the aggregate industry-level changes in exports, output, employment, unweighted/weighted productivity. Further I concentrate on the continuous exporters to study the relationship between firm-level exporting activity at the intensive margin and changes in its productivity performance. I break down analysis to explore exports-productivity relationship at the intensive margin for the specific export markets and products. I concentrate primarily on the groups of economically advanced countries versus countries that are at similar stages of economic development. This strategy should allow checking the hypothesis that increasing exports to the more developed markets with the more advanced technologies leads to considerable gains in productivity for the exporting firms. It should be noted however that more productivity gains are expected in case exported products are capital intensive goods that require relatively advanced production process. In such case an exporting firm can benefit extensively from international trade via access to new innovative technologies, managerial practices etc.
I start with the analysis of the contributions of firms with different export patterns to the changes in the industry-level aggregate variables (exports, output employment, unweighted/weighted productivity). For that purpose I follow Voicu (2009) and use
the adapted measures for aggregate job creation and destruction developed by Davis and Haltiwanger (1999).
The positive and negative contributions of a subset A of industry firms to the gross changes in aggregate exports between time t and t+1 can be defined as follows: Positive contributions to the gross changes in industry exports: A it
i A EXP EXP + + ∈ =
∑
∆Negative contributions to the gross changes in industry exports: A | it |
i A EXP EXP − − ∈ =
∑
∆ ,where i is an index for firms, A+ is a subset of firms that increase their export sales between t and t+1, A−
is a subset of firms that decrease their export sales between t
and t+1. Contributions to changes in other aggregate variables, i. e. employment, output, weighted and unweighted productivity are defined in a similar way:
Positive/negative contributions to the gross changes in industry employment:
A it i A EMP+ EMP ∈ + =
∑
∆ ; | | A it i A EMP EMP − − ∈ =∑
∆ .Positive/negative contributions to the gross changes in industry output:
A it i A OUT OUT + + ∈ =
∑
∆ ; | | A it i A OUT OUT − − ∈ =∑
∆ .Positive/negative contributions to the gross changes in industry’s unweighted
productivity: it A i A pr PRD n + + ∈ ∆ =
∑
; | it | A i A pr PRD n − − ∈ ∆=
∑
, where n is the number of firmsin the industry and prit is a productivity index of a firm i inthe time t.
Positive/negative contributions to the gross changes in industry’s weighted
productivity: A it it i A PRD s pr + + ∈ =
∑
∆ ; | | A it it i A PRD s pr − − ∈ =∑
∆ , where its is the output share of the firm i in the total industry output at the time t, and ∆sitia the change in the
output share of the firm i in the total industry output between t and t+1.
Appendix E summarises contributions of the different types of firms to the aggregate industry-level changes in such aggregate variables as exports, employment, and output, weighted and unweighted productivity. The results confirm that changes in
firms’ exporting status, i. e. entries and exits from the export markets, account for a much smaller share of changes in the levels of aggregate variables than changes in the export dynamics of continuous exporters. Entries into the export market account for 0.6 percent (in coke/nuclear/chemical industry) to 12.5 percent (in non-metallic minerals industry) of the industry aggregate export growth, and exits from the export market account for 0.9 percent (in coke/nuclear/chemical industry) to 17.5 percent (in non-metallic minerals industry) of the negative changes in the aggregate export volumes.
The same pattern persists for employment and output where contributions of entries/exits from the export markets to aggregate changes in aggregate variable of entries/exits from the export markets are 4-5 times lower than contributions of continuous exporters.
Contributions of entries and exits to the gross changes in the unweighted productivity are much smaller than those of continuous exporters in all industries except Machinery and Equipment industry, where these they are almost equal.
The same pattern persists for weighted aggregate productivity, with some changes in the Machinery and Equipment Industry, where positive changes of both groups of firms (new entrants and continuous exporters) are roughly equal, while negative moves of continuous exporters across industry distribution contribute almost five times more to the gross aggregate weighted productivity changes.
Current findings imply that in industries with higher export intensity continuously exporting firms account for a much larger share of the overall gross changes in all industry variables.
To analyse the relationship between the dynamics of the firm-level exporting activity and its productivity performance on the intensive margin I continue to focus on continuous exporters. Following Voicu (2009) I define three types of exporting behaviour:
Move down – firms moving into a lower decile/percentile of export
Move up - firms moving into a higher decile/percentile of export distribution
Stay – firms that don’t change their relative position in the distribution of
exports
Appendix F represents the results of linear regressions of changes in TFP as a function of the type of exporting dynamics. The results of the regression analysis indicate the presence of correlation between firms’ exporting activity and their productivity performance. Continuous exporters that reduce their export volumes experience decline in total factor productivity, in all industries constant terms are negative and highly significant (between -0.3 and -0.8). The coefficients for both ‘stay’ and ‘move up’ are positive and significant in all industries. However the results of F-test decline the hypothesis that coefficients of ‘move up’ are significantly higher than those of ‘stay’ in all four industries, which means that productivity gains from ‘move up’ and ‘stay’ are roughly equal. The relationship between firm-level productivity performance and its exporting dynamics is a result of highly heterogeneous firm behaviour.
In order to compare the distribution of the TFP changes for the firms with different types of exporting dynamics across the four industries under study I use kernel density estimation‡‡. Figures 1-4 in the Appendix A compare firms that move down, move up and do not change their relative position in the distribution of exports for each of the four industries. The distributions are significantly different. In all four industries the distribution of the TFP changes for the firms that move down the ladder of export distribution stochastically dominates the distribution of the TFP changes of the firms that do not change their relative position in the industry specific distribution of exports. The distribution of the TFP changes of the firms that do not change their relative position in the industry specific distribution of exports in its turn stochastically dominates the distribution of the TFP changes for the firms that move up in the industry-specific distribution of exports. In other words for any level of TFP change the cumulative distribution function (CDF) is the largest for the firms that
move down and the smallest for the firms that move up in the distribution of exports.
‡‡
These findings are supported by the results of quantile regressions that are similar to the OLS. Quantile regression coefficients are interpreted as partial derivatives of the conditional quantile function with respect to the regressors. For example, in case we have obtained a positive coefficient for an independent variable in the regression for the 1st percentile we can conclude that a one unit increase in this regressor will increase the 1st percentile of the dependent variable distribution by the value of the coefficient.
The results of quantile regressions of the TFP changes as a function of the type of the export dynamics for each of the four industries for 9 quantiles (each containing 10% of the distribution of the dependent variable) are presented in columns (2) to (10) of the Appendix F.
The findings show that coefficients for ‘stay’ and ‘move up’ are mostly significant for the middle deciles, columns (4)-(7). These findings, although confusing at first sight, support the hypothesis that most of the export gains appear in a long run, when a firm becomes a relatively larger exporter and adjusts to the international market conditions. New entrants engaging in small scale operations can hardly experience any productivity gains immediately after entering export markets.
In order to gain a deeper understanding of the relationship between exporting activity and its productivity gains I will try to distinguish between different types of export markets. A common logic would imply that a firm that starts exporting to a more technologically advanced country will eventually benefit from productivity gains due to the access to new technologies, better managerial practices, etc. At the same time companies that export mostly raw materials, semi-processed goods or any other labour-intensive goods would hardly experience any productivity gains attributed to exporting due to the simple production process.
In order to test this hypothesis and study this phenomenon in more details I focus on different types of exporting markets and export products. First I focus on firms exporting to the countries of the European Union (EU) versus firms exporting to the countries of the Commonwealth of Independent States (CIS). Further I continue analysis distinguishing between different types of export products (i. e, raw materials
The results of the quantile regressions of the TFP changes as a function of the type of the EU-export dynamics for each of the four industries are presented in the Appendix G. The results show that coefficient for both ‘stay’ and ‘move up’ are positive and significant for most of the quantiles in Coke/Chemical/Nuclear and Machinery and Equipment industries and for the middle quantiles in Transport Equipment industry. In Non-Metallic Minerals industry the coefficient for ‘stay’ is only significant for the sixth quantile and the coefficient for ‘move up’ is significant for all quantiles except for the 1st.
Appendix H presents the results of the quantile regressions of the TFP changes as a function of the export dynamics with a concentration on the CIS export market. Apart from few exceptions the coefficients for ‘stay’ and ‘move up’ are positive and significant in all industries and quantiles.
At first glance the results reveal benefits in exporting to both the EU and the CIS markets. However, the relative size of the coefficients is higher for the products exported to the EU market. Indeed for all industries the coefficient for variables ‘stay’, ‘move up’ and ‘move down’ are usually 1.5-2 times higher in case of the export to the EU. The difference in the size of coefficients increases significantly from in the 4th to 9th decile. This might mean that established exporters that have already adjusted to market conditions and reached sufficient levels of export volumes benefit even more from exporting to the more advanced market of the EU.
Next I use more detailed product information and distinguish between capital intensive versus labour intensive products and raw materials in order to test whether there is a significant difference in productivity gains from exporting former versus later.
The results of the quantile regressions for the export of different types of products selected from the four industries under study to the EU market are presented in the Appendices J and K.
Overall the results confirm the initial hypothesis suggesting higher benefits from exporting of capital intensive goods to the technologically advanced markets. For example, the coefficients for ‘stay’ and ‘move up’ are mostly statistically insignificant for such export products as Rubber and rubber goods; Tools and cutlery; Plastic and
plastic goods; Aluminium and aluminium products; Goods made of stone, cement, gypsum, asbestos, mica and similar materials; Precious metal products (jewelry); Ceramic products; Glass and glass products; Mineral fuel, oil and processed products; Non-organic chemical products; organic and non-organic compounds of precious and rare-earth metals, isotopes and radioactive elements; Organic chemical compounds; Fertilizers.
Surprisingly, coefficients for ‘stay’ and ‘move up’ are positive and significant for most of the deciles for such products as Salt and sulphur; Wood , wood products and charcoal. However, in this case such benefits from exporting can be explained by economies of scale since these products are produced by the plants that would have high production and correspondingly export volumes from the beginning of exporting activity.
Finally, the results of the same analysis for the capital intensive goods presented in the Appendix L are quite mixed and do not allow to make any clear judgement about benefits of exporting to the more technologically advanced market of the EU. For example, exporting nuclear reactors, boilers, supporting mechanic equipment and parts leads to significant increase in productivity growth. On the other hand exports of the electric, sound and TV recording and audio equipment and parts; transport vehicles (except rail transport); optic, photographic, cinematographic equipment, meters, and check meters leads to the increase in productivity growth only for some deciles of the export distribution, mainly (1)-(4), with no clear productivity benefits being associated with further increase in the export volumes.
Overall the results of the analysis imply that firms increasing their export volumes are more likely to experience higher increases in productivity comparatively to firms that don’t change or move down in the industry-specific distribution of exports. Significant productivity gains are more likely to appear after the initial entry period has been passed and the firm has adjusted to the international market environment and become a medium or a large exporter. Also the productivity gains tend to be higher in case firms concentrate on exporting to the more technologically advanced and economically developed markets. I some cases higher benefits do occur in case of exporting of technology-intensive products to the more economically developed
markets, however current findings do not provide sufficient evidence base for a non-controversial conclusion.
Conclusion
In this paper I have used panel data on the four Ukrainian manufacturing industries to study the relationship between exporting activity and productivity performance at the firm-level. For this study I used the data of the four most export-intensive Ukrainian industries for the period 2000-2005.
First, I concentrate on the analysis of the exporting activity on the firm level and show that activity can be described as a ladder. Most of the entries and exits take place at the bottom of the industry-specific export distribution, i. e. new entrants typically engage in small-scale exporting operations and firms that exit from the export markets are typically small exporters. In all industries exporting firms are very different, however in each of the industries top 10% of exporters account for about 80% of total industry exports, their export sales volumes and export intensity are much higher than industry average.
The dynamics of the exporting activity at the intensive margin is also quite intense, firms move up and down the export ladder gradually changing their position in the industry export distribution. The main conclusion from this section is that the mobility of firms across the distribution of exports has an inverted-J shape. Firms in the bottom and middle percentiles of the export distribution are more likely to change their relative position in the distribution of exports than the firms located at the top of the ladder. However, the results for Ukrainian data imply that the probability of large exporters to change their relative position in the export distribution is still quite high, about 70%, as compared to that of 90% in lower deciles.
Second part of the chapter is focused on the analysis of the relationship between exporting dynamics and productivity performance. In this study I distinguish between export dynamics at the extensive and intensive margin. Extensive margin accounts for entries into and exits from the export markets, and intensive margin takes into account the firms that export in consecutive years.
The results of the analysis show that entries and exits account for a small percentage of the gross industry changes in exports, employment, output and productivity. The results of the standard OLS regressions reveal that on average an increase in a firm’s
These findings are further confirmed by the results of the kernel density estimation (Figures 1-4, Appendix A) of the distribution of the yearly TFP changes and by the results of the quintile regressions that also show that increase in the firm’s export intensity is associated with a superior distribution of the yearly changes in the TFP, which means that that such firms are more likely to experience higher productivity gains as compared to the firms that keep or decrease their export intensity.
The results however reveal a lot of heterogeneity. One of the main findings is that realisation of the TFP gains appears only in the long-run, when a firm has managed to approach the middle of the export ladder.
Next in order to gain a deeper understanding of the relationship between exporting dynamics and productivity gains I distinguish between different types of export markets and products. Here I test the hypothesis that a firm exporting to the more technologically advanced country would eventually experience higher productivity gains due to the access to new superior technologies, better managerial practices, etc. At the same time I test if there is a significant difference in the productivity gains from exporting of labour-intensive versus capital-intensive products to the more economically developed markets.
For this purpose I concentrate on exports to the markets that include countries of the European Union and countries of the Commonwealth of Independent States. The results are similar to the general quantile regression results, and once again confirm that:
firms that increase their export especially to the technologically advanced markets are more likely to experience higher productivity gains;
productivity gains are usually realised in the long run;
productivity gains/losses are higher in case of exporting to the markets possessing higher levels of economics development;
in some cases productivity gains/losses are higher in case of exporting of capital intensive products to the markets with higher levels of economics development.
Overall the results of the study are consistent with the predictions of the theoretical models of exporting dynamics in industries with heterogeneous firms and sunk costs of exporting (Bernard, Eaton, Jensen and Kortum, 2003; Melitz, 2003; Helpman, Melitz and Yeale, 2004) and models of firm’s dynamic employment and investment decisions under uncertainty, when the adjustment costs of labour and capital are significant (Hammermesh and Pfann 1996, Bentolila and Bertola, 1990, Dixit 1989, 1992, 1997).
First of all we have to account for a range of inaction that occurs prior to the entry into the export market. Most of the firms that consider a possibility of exporting would be stifled by the significant sunk entry cost, which might postpone their entry of prevent it at all. The inaction gap is further magnified by the uncertainty about the export market conditions: firm might have imperfect information about potential demand for their product (static market conditions) and random changes in the demand or exchange rates (dynamics changes in market conditions). Thus most of the responces to changes in the market conditions come from incumbent exporters. This statement is confirmed by the current findings that show that entries and exits from the export market account only for about 10-12.5% of the gross industry changes in exports.
Next the ladder export structure with new exporters engaging in a small scale operations suggest that exporters experience not only sunk entry cost of exporting but also increasing convex-shaped post-entry exporting cost. Hammemesh and Pfann (1996) show that when expanding/contracting its exporting activity firm can incur monetary and nonmonetary costs of adjusting labour, like hiring, firing and training and costs of buying/installing new capital/equipment and associated work force training costs. This theory also explains the fact that mobility of firms across the deciles of export distribution has an inverted J-shape.
Becoming a large exporter would imply a sharp rise in export sales and export adjustment costs, thus only the most productive firms would manage to reach the top of the export ladder. Also due to the size of the export adjustment costs firms at the top of the distribution would be less likely to change their relative position. Both these fact explain lower mobility of large exporters.
Overall our findings explain the results of the previous chapter that provide mixed evidence of the statistically significant productivity gains for the new exporting firms in the post-entry period§§. The results of the chapter show that new exporters usually only engage in a small scale exporting operations because of the imperfect market information, high entry sunk costs and dynamic export adjustment costs. Thus the majority of the entries into and exist from the export markets take place at the bottom of the export ladder and are associated with relatively small gains in the TFP. Much higher TFP gains appear only at a stage when a firm adjusts to the new international economic environments and expands its exports enough to become a large exporter or at least to reach the middle of the industry exports distribution.
§§
References
Baldwin J. R. and Gu. W. (2003). ‘Export market participation and productivity performance in Canadian Manufacturing’. Canadian Journal of Economics, vol. 36, pp. 634-57.
Baldwin J. R. and Krugman, P. R. (1989), “Persistent Trade Effect of the Large Exchange Rate Shocks”, Quarterly Journal of Economics, vol. 104, pp. 635-654. Bernard, A., Jensen J. B. (1998), “Exceptional Exporters Performance: Cause, Effect or Both?”, Journal of International Economics, vol. 47, pp. 1-25.
Bernard, A., Eaton, J., Jensen, J. B., and Kortum, S. (2003), “Plants and Productivity in International Trade”, American Economic Review, vol. 93, 1268-1290.
Bernard, A., Wagner, J. (1998), “Export Entry and Exit by German Firms”, NBER Working Paper, No.6538.
Bentolila, S. and Bertola, G. (1990), “Firing Costs and Labour Demand: How Bad is Eurosclerosis?” Review of Economics Studies, vol. 57, 381-402.
Campa, J. M. (2000), “Exchange Rates and Trade: How Important is Hysteresis in Trade?”, mimeo, IESE.
Davis, S. J. and Haltinwanger, J. (1999), “Gross Job Flows”, in Ashenfelter, O. and Card, D. eds., Handbook of Labour Economics, vol. 3B, 2711-2805.
Bernard, A., Jensen, J. B. (2004a), “Why Some Firms Export?” The Review of
Economics and Statistics, vol. 86, 561-569.
Bernard, A., Jensen, J. B. (2004b), “Entry, expansion and intensity in the U.S. export boom, 1987-1992”, The Review of International Economics, vol. 12, pp. 662-675. Bernard, A., Jensen, J. B., Schott, P. K. (2006), “Trade Costs, Firms and Productivity,” Journal of Monetary Economics, vol. 53, 917-937.
Blalock, G. and Gertler, P. J. (2004). “Learning from exporting revised in a less developed setting”, Journal of Development economics, vol. 75, pp. 397- 416.
Crelides, S., Lach, S. and Tybout, J. (1998), “Is Learning by Exporting Important? Micro-dynamic from Columbia, Mexico and Morocco,” Quarterly Journal of
Economics, vol. 113, 903-948.
Dixit, A. K. (1989a), “Hysteresis, Import Penetration, and Exchange Rate Pass-through, “Quarterly Journal of Economics”, vol. 104, 205-228.
Dixit, A. K. (1989b), “Entry and Exit Decisions under Uncertainty,” Journal of
Political Economy, vol. 97, 620-638.
Dixit, A. K. (1992), “Investment and Hysteresis”, Journal of Economic Perspectives, vol. 6, 107-132.
Dixit, A. (1997), “Investment and Employment Dynamics in the Short-Run and the Long-Run,” Oxford Economics Papers, vol. 49, 1-20.
Hammermesh, D. and Pfann, G. (1996), “Adjustment Costs in Factor Demand,”
Journal of Economic Literature, vol. 34, 1264-1292.
Helpman, E., Melitz, M. and Yeqaple, S. (2004), “Export versus FDI”, American
Economic Review, vol. 94, 300-316.
Krugman, P. R. (1989), Exchange Rate Stability, Cambridge: MIT Press.
Lopez-Cordova, E. (2002), “NAFTA and Mexico’s Manufacturing Productivity: An Investigation Using Micro-level Data,” mimeo, Inter-American Development Bank, Washington, D.C.
Melitz, M. J. (2003), “The Impact of Trade on Intra-Industry reallocations and Aggregate Industry Productivity,” Econometrica, vol. 71, 1695-1725.
Pavnick, N. (2002), “Trade Liberalization, Exit, and Productivity Improvements: Evidence from Chilean Plants,” Review of Economic Studies, vol. 69, 245-276.
Roberts, M. J. and Tybout, J. R. (1997), “The Decision to Export in Colombia: An Empirical Model of Entry with Sunk Costs,” American Economic Review, vol. 87, 545-564.
Tybout, J. and Westbrook, M. D. (1995), “Trade Liberalization and the Dimensions of Efficiency Change in Mexican Manufacturing Industries,” Journal of International
Appendix A Figure 1 Coke/Chemical/Nuclear 0 .0 2 .0 4 .0 6 .0 8 .1 D e n s it y -10 0 10 20 TFP Change
Move Down Move Up Stay
Figure 2 Non-Metallic Minerals 0 .0 2 .0 4 .0 6 .0 8 D e n s it y 0 50 100 150 TFP Change