White Paper
PiLab Technology
Performance Test, Deep Queries
pilab.pl
Table of Content
Forward ... 3 Summary of Results ... 3 Technical Introduction... 3 Hardware ... 4
Disk read/write speed ... 4
Network speed test ... 5
Software ... 5
Database Size... 6
Test Results... 6
pilab.pl
Forward
PiLab is developing various technologies that could potentially be used in futurePiLab Business Intelligence products. In this paper, we examine benchmark results for performing complex database operations as may be required in order to support an advanced Business Intelligence (BI) tool.
Useful capabilities of an ideal next-generation BI product could include the ability to enable users to do ad-hoc testing of hypotheses (i.e., ask any question they want), to quickly browse through data, and to have more users simultaneously do more complex analyses. Enabling such capabilities in a Business Intelligence tool would require that “in the background” the BI system could quickly perform highly complex database operations that are far beyond the capabilities of today’s tools.
In this paper, we review performance benchmark results achieved with PiLab software technology for performing such complex database operations.
Summary
of Results
PiLab software technology was shown to be able to execute queries with 600 database joins within the same resource set where traditional approaches would result in failure due to lack of resources after only nine joins. This represents a dramatic improvement of >60X in the ability to do deep, complex queries that could be very useful in enabling breakthrough capabilities in a next-generation BI tool.
Technical
Introduction
The objective of this analysis was to measure the relative advantage PiLab software provides when doing “deep” queries. Before reviewing the complete results, we will first describe the test environment.
pilab.pl
Hardware
Name Quantity Additional information
E6000H Integrated Frame (include Data Mangerment Board) 1 MM620 Shelf Management Module 2 BH622 V2 Sandy-Bridge Romley EP Server 4 BH640 V2 Sandy-Bridge Romley EP 4S Server 4 HardDisk-300GB-SAS-10000RPM-2.5”-16M 16
Disk read/write speed
[root@master ~]# gpcheckperf -f /tmp/hostfile_exkeys -d /home/primary -d /home/mirror -r ds /usr/local/greenplum-db/./bin/gpcheckperf -f /tmp/hostfile_exkeys -d /home/primary -d /home/mirror -r ds
disk write avg time (sec): 485.42 disk write tot bytes: 945169498112
disk write tot bandwidth (MB/s): 1857.61 disk write min bandwidth (MB/s): 0.00 [ seg5] disk write max bandwidth (MB/s): 273.91 [ seg4] disk read avg time (sec): 519.42
pilab.pl
disk read min bandwidth (MB/s): 223.24 [ seg3]
disk read max bandwidth (MB/s): 300.63 [ seg5] stream tot bandwidth (MB/s): 44376.52
stream min bandwidth (MB/s): 5392.65 [ seg4] stream max bandwidth (MB/s): 5723.33 [master]
Network speed test
[root@master ~]# gpcheckperf -f /tmp/hostfile_exkeys -r N -d /tmp
/usr/local/greenplum-db/./bin/gpcheckperf -f /tmp/hostfile_exkeys -r N -d /tmp Netperf bisection bandwidth test
master -> seg1 = 112.280000 seg2 -> seg3 = 112.270000 seg4 -> seg5 = 112.280000 seg6 -> seg7 = 112.280000 seg1 -> master = 112.280000 seg3 -> seg2 = 112.290000 seg5 -> seg4 = 112.290000 seg7 -> seg6 = 112.310000 Summary: sum = 898.28 MB/sec min = 112.27 MB/sec max = 112.31 MB/sec avg = 112.28 MB/sec median = 112.28 MB/sec
Software
Operating system: CentOS 6.4
pilab.pl
Database Size
The database was filled with data using DataFiller software:
https://www.cri.ensmp.fr/people/coelho/datafiller.html
The size of the database was: 1.3TB.
First table: Rows: 110M
Values: 5 integer columns all filed with random data Second table Rows: 180
Values: 5 integer columns, 4 varchar(4000) columns all filled with random data
Third table Rows: 10
Values: 5 integer columns, 4 varchar(4000) columns all filled with random data
Forth table Rows: 1.7G with 5% of empty values
Values: all values were 12 ([a-zA-Z0-9]) chars (varchar2(4000)) strings generated randomly based on natural distribution
Fifth table Rows: 500M
Values: Values: 5 integer columns all filed with random data
Test Results
The test was to query the system while incrementing the depth of the querybased on the “inner joins” and “left joins” statements. The specifications for the queries were generated based on sample reports as used in customer environments. The depth of the query is crucial, especially in large and complex database systems that need to join many different database structures to get the result.
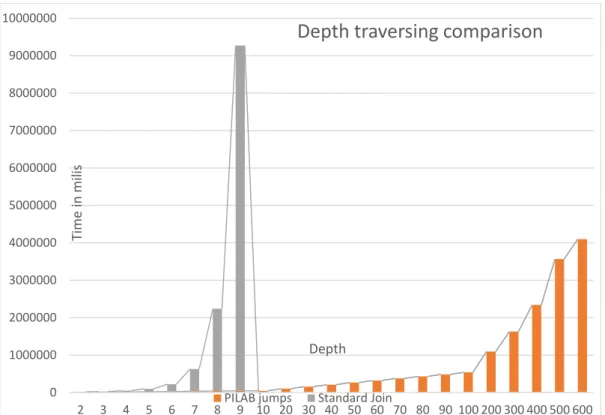
In the test environment, traditional SQL querying was inefficient, and the time and resources consumed by the system was growing exponentially as the number of joined structures increased. For this workload, the system was unable to do more than eight joins. Attempting to join nine structures resulted in the system declaring insufficient resources after 3.5 hours of processing, and attempting to do any further SQL querying did not generate any results. Patent pending technology created by PiLab enables spreading the overhead of complex queries into small pieces, which could enable a BI system residing on that database to do “infinite drilling” into the logical structure of the data. For the same test referenced above, as shown below PiLab software was able to:
Execute the same joins dramatically faster
pilab.pl
Figure 1: Traditional SQL querying execution times increased exponentially and a maximum of eight joins could be performed. PiLab software enabled far faster queries, with linear execution time through 600 queries.
0 1000000 2000000 3000000 4000000 5000000 6000000 7000000 8000000 9000000 10000000 2 3 4 5 6 7 8 9 10 20 30 40 50 60 70 80 90 100 200 300 400 500 600 Tim e in m ili s Depth