Modelling End-to-end Quality-of-Service for Transaction-Based Services in
Multi-Domain Environments
R.D. van der Mei
a,band H.B. Meeuwissen
c,
Member, IEEE
a
Center for Mathematics and Computer Science, Amsterdam, The Netherlands
b
Vrije Universiteit, Amsterdam, The Netherlands
c
Bell Labs Europe, Lucent Technologies, Hilversum, The Netherlands
mei@cwi.nl, erik@lucent.com
Abstract
Next-generation service offerings will be increasingly based upon combining and integrating information from multiple logically and geographically distributed servers, interconnected by communication networks. Different administrative domains own these servers and networks. For the commercial success of these services, it is important for service providers (SPs) to predict and control the end-to-end Quality-of-Service (QoS) perceived by the end users. We focus on transaction-based services, such as E-business applications, for which control of end-to-end response and download times determine customer satisfaction. Today, no mature solutions exist for the problem of realizing high and guaranteed end-to-end QoS for transaction-based services in multi-domain environments. Service Level Agreements (SLAs) are a well-recognized concept to obtain QoS guarantees at the network level. However, in the context of transaction-based services both server and network domains need to be taken into account. Furthermore, currently no satisfactory solutions exist for SPs to determine the set of combinations of per-domain SLAs that they need to negotiate with the other domain owners to deliver the desired end-to-end QoS. To this end, in this paper we introduce the new concept called SLA negotiation space, i.e. the set of combinations of per-domain SLAs that SPs need to negotiate with other domain owners to realize desired end-to-end QoS levels. In addition, to identify the SLA negotiation space, we propose a modelling framework and a step-by-step approach to quantify the complex relation between the per-domain SLA parameters and the end-to-end QoS. A specific feature of our modelling framework is that it explicitly incorporates the SLA parameters, which has not been proposed before. The practical usefulness of our results is demonstrated by a realistic example.
1. Introduction
Service offerings are increasingly based upon combining and integrating information from multiple logically and geographically distributed servers,
interconnected by communication networks. For example, location-based information services, where first the geographical location is determined, and subsequently, the information corresponding to this location is retrieved (e.g., restaurants, hotels, weather forecasts). To realize this type of transaction-based services, the service provider (SP) needs to make agreements with other parties involved, including access network operators to provide wireless access, location service provider to give the user’s location, and content providers to deliver the requested local information. From the end-user's perspective, the SP is responsible for the billing and the proper functioning of the service. In this environment, the service is offered via multiple administrative domains, and hence, the end-to-end Quality-of-Service (QoS) depends on the per-domain QoS. Currently, no satisfactory solutions exist for the problem of realizing high and guaranteed end-to-end QoS in multi-domain environments.
In this paper, we propose a Service Level Agreement (SLA)-based approach that enables the SP to deliver end-to-end QoS. SLAs are a well-recognized concept to obtain QoS guarantees at the network level. However, in the context of transaction-based services both server and network domains need to be taken into account, while SLAs with QoS parameters on server domains are relatively unexploited. For this reason, in this paper we focus on server domain SLAs and their relation to end-to-end QoS. Typically, the SP will negotiate SLAs with the different domain owners (sub-contractors) who, in turn, may negotiate SLAs with the owners of the domains on which they are dependent (sub-sub-contractors). To identify what combinations of SLAs lead to the desired end-to-end QoS level experienced by the paying end user, we (1) introduce the new concept called SLA negotiation space, i.e. the set of combinations of per-domain SLAs that SPs need to negotiate with other domain owners to realize the desired end-to-end QoS levels, and (2) propose and validate a new modelling framework and step-by-step approach to quantify the intricate relation between the per-domain SLA parameters and the end-to-end QoS. A specific feature of this modelling framework is that it explicitly incorporates the SLA parameters, which has not
been proposed before. This enables SPs to answer “what-if” questions regarding the relation between negotiated SLAs and the end-to-end performance, and to determine the most cost-effective combinations of SLAs that lead to the desired end-to-end performance. To demonstrate the practical usefulness of our step-by-step approach, we have implemented it in a simulation environment.
In current practice, the main focus is often on the short time-to-market, i.e. to make the service operational as fast as possible, while performance-related issues are tackled on an ad-hoc basis. However, to avoid customer dissatisfaction, potential performance problems, for example caused by strong growth of usage, should be anticipated on, in order to timely take appropriate measures (server upgrades, bandwidth upgrades, and modifications to SLAs). This motivates the development of models and techniques to address what-if questions regarding performance under different evolution scenarios, explicitly incorporating the effect of particular parameter choices in the SLAs on the end-to-end performance in terms of end-user perceived QoS.
In the literature, QoS-problems in single-domain environments have been studied extensively for decades. However, the problem of realizing end-to-end QoS in multi-domain environments is relatively new. This type of problem is addressed for VoIP services in [13], where a quantitative SLA-based approach is introduced to realize desired end-user perceived QoS. Also for transaction-based services running in a multi-domain environment, the problem of achieving end-to-end QoS is well-acknowledged [14], [15], but still no satisfactory solutions for delivering high and guaranteed end-to-end QoS are known. For a recent survey on the state-of-the-art on SLA-based solutions for end-to-end QoS problems, we refer to [16], in which the following two main solutions for SLA-management are distinguished: (1) an
end-to-end solution, where the SLAs are directly
negotiated with all parties involved, and (2) a cascaded
solution, where the SP only negotiates SLAs with its neighbouring domains. The cascaded solution is elaborated in [10], where an architecture is proposed for engineering QoS support in the global Internet across network domains. However, our goal to realize end-to-end QoS for transaction-based services in multi-domain environments requires solutions that go beyond the state-of-the-art in the following ways: (1) the definition of SLAs for server domains, (2) the development of performance models to quantify the complex relation between the SLAs and the end-to-end QoS, and (3) the inclusion of user perception models.
In general, little is known about the end-user perception of quality of transaction-based services. Recently, quantitative models have been proposed in [2], [3] for the end-user perception for web browsing services in terms of the Mean Opinion Score (MOS). In the
current paper, we apply these results to develop a new quantitative modelling framework for the parameters that determine the perceived quality of transaction-based services. The main parameters that determine the user-perceived QoS in terms of the Mean Opinion Score (MOS) are the response time (RT) and download time (DT). The RT is defined as the time interval between the moment at which the user sends a request and the moment at which the user sees the first response. The DT is the time interval between the moment at which the user sees the first response on its terminal and the moment at which all data is received. Therefore, we focus in this paper on determining, predicting and controlling the end-to-end RT and DT.
The definition of SLAs for server domains includes a statistical guarantee on the RT, in return for a maximum number of simultaneous service requests (excess requests can be either queued or blocked). To describe the complex relation between the SLAs and the end-to-end QoS we use of quantitative queueing models. Over the past few decades, such models have been successfully applied to describe and analyze performance problems in performance analysis of information and communication systems, amongst other application areas. To the best of the authors’ knowledge, SLAs have not been incorporated previously in a quantitative modelling framework for transaction-based services.
The remainder of this paper is outlined as follows. In Section 2, we introduce a simple yet relevant running example that will be used for illustration purposes throughout the paper, and illustrate how larger tree-based hierarchical domain structures can be addressed. Then, in Section 3, we discuss which factors determine the end-to-end QoS, including the role and impact of SLAs. Next, in Section 4, we propose a practically applicable modelling framework to assess the end-to-end response time performance, and propose a step-by-step approach to determine the SLA negotiation space. In Section 5, we validate the approach and apply it to the running example. Finally, in Section 6, we address a number of topics for further research.
2. Transaction-based services
Future transaction-based services will range over a large number of domains (see e.g. [6]) typically organized in a hierarchical tree structure. To assess the end-to-end QoS, our proposed modelling framework explicitly takes this hierarchy into account. In Section 2.1, we discuss a simple example that will be used throughout the paper. This example is an essential building block in our hierarchical modelling framework. In Section 2.2, we discuss how this building block can be incorporated in
larger tree structures that will occur in future transaction-based service offerings.
2.1 Running example: the Location-based Restaurant Service
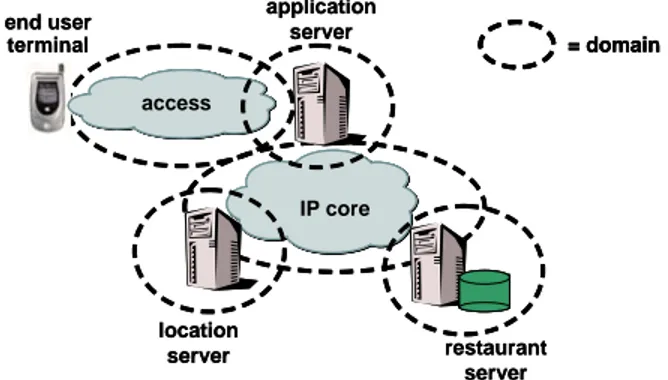
In this section we introduce the Location-based Restaurant Service (LRS) as a running example that includes the relevant aspects of transaction-based services running in a multi-domain environment. The LRS provides a mobile end user with a list of restaurants in the neighbourhood that meets the user’s personal preferences. An LRS service request proceeds along the following steps (see Figure 1):
Step 1:The end user uses a mobile device to request suitable restaurants. This typically generates an HTTP request from the mobile device to the application server over the access network. Step 2:The application server processes the request and
sends a location request to the location server. The location server determines the location of the end user and returns the location coordinates to the application server.
Step 3:The application server processes this response and sends a request for restaurants that meet the user’s preferences in the neighbourhood of the end user’s location to the restaurant server. The restaurant server uses this information to identify a list of suitable restaurants and returns this list to the application server.
Step 4:The application server processes this response, builds an HTML page and sends it to the user as the reply to the HTTP request.
application server end user terminal access location server restaurant server IP core 1 4 2 3 application server end user terminal access location server restaurant server IP core 1 4 2 3
Figure 1. Location-based Restaurant Service. An important characteristic of the LRS is that it crosses multiple administrative domains and that multiple parties are involved, each with their own business incentives. The parties involved are the LRS service
provider, typically the owner of the application server, the different network providers, the location service provider and the restaurant service provider (see Figure 2).
application server end user terminal access location server restaurant server IP core = domain application server end user terminal access location server restaurant server IP core = domain = domain
Figure 2. Multiple parties involved in the LRS. 2.2 Hierarchical Tree Structures
It is important to note that in practice each of the stakeholders may be companies with their own complex and possibly distributed infrastructures. In the running example discussed above, the LRS service provider negotiates SLAs with the other stakeholders without
being concerned with how these stakeholders realize the service levels in the negotiated SLAs. Thus, it is the responsibility of the domain owners to realize the service levels agreed upon (e.g., which equipment, over-dimensioning or not, which service contracts, which sub-contractors).
This observation allows a hierarchical modelling framework that can be recursively applied at each abstraction level, consisting of a business party with its direct sub-contractors. Figure 3 shows an example tree structure of domain owners (parents in the tree) with SLA relations to their sub-contractors (children in the tree).
end user service provider sub-contractor 2 sub-contractor 1 sub-contractor 3 sub-sub-contractor 2
sub-sub-contractor 1 = SLA relation
= domain owner end user service provider sub-contractor 2 sub-contractor 1 sub-contractor 3 sub-sub-contractor 2
sub-sub-contractor 1 = SLA relation
Figure 3. Example tree structure of domain owners with SLA relations to their
sub-contractors.
If a domain owner is involved in realizing the service, then it can meet the SLAs with its customers - which may be either end users or business customers - by properly operating its own domain in combination with negotiating the right SLAs with its sub-contractors. This raises the need for quantitative models and solution techniques that allow a domain owner to identify the relation between (a) the requirements on the performance of its own domain, (b) the SLAs with its sub-contractors, and (c) the service level offered to its own customers.
3. Service Level Agreements for
Transaction-based services
The main quality metric is the user-perceived quality of the transaction-based services in terms of the MOS. Suppose the LRS service provider wants to offer its service at a given MOS level to the end user (the highest level in the tree structure in Figure 3). Therefore, a requirement on the MOS can be translated into requirements on the end-to-end RT and DT to be fulfilled by the LRS service provider. Following the four steps that are described in the previous section, the end-to-end RT and DT are random variables that can be expressed in terms of the per-domain performance parameters as follows:
RT = RTTaccess + PAS + PLS + PRS + RTTcore
+ (1/2) RTTcore + Dcore (file size) (1)
and
DT = Daccess (reply size), (2)
where the random variable RTTaccess is the round-trip time
(RTT) of the access network, PAS, PLS and PRS are the
processing times of the application server (AS), the location service (LS) and the restaurant service (RS), respectively, the random variable RTTcore is the round-trip
time of the core network, Dcore (file size) is the download
time of a file of a given size from the restaurant service domain over the core network to the application server, and Daccess (reply size) is the download time of the reply
of a given size from the from the application server over the access network to the end user terminal.
It is important to notice that the parameters on the right-hand side of Equations (1) and (2) depend on many domain-specific characteristics, such as the processing times of the location and the restaurant servers and the utilization of the access and core networks, which are beyond the control of the LRS service provider.
We emphasize that Equations (1) and (2) depend on the per-domain characteristics, but are independent of the ownership of these domains. Let us assume that the LRS service provider owns the application server, while the access and core network as well as the location and restaurant services are owned by other parties that are sub-contracted by the LRS service provider. To realize desired end-to-end quality of the LRS service to the end users, the LRS service provider eliminates the dependence on the domain-specific characteristics of the other domains by negotiating SLAs.
We distinguish between two types of SLAs: (a) SLAs with network domains, and (b) SLAs with service domains. Network SLAs are widely negotiated in today’s networks. Typical parameters that can be considered in network SLAs are availability, network bandwidth, network latency, and packet delay, loss and jitter. In today’s practice, however, most SLAs are based on availability and bandwidth only, since for these parameters SLA conformance is easier to monitor.
SLAs with service domains are less common in today’s practice. The question is which parameters can be included in service domain SLAs and allow enforcement of end-to-end QoS? A typical example of such a SLA has the following structure. On the one hand, the client application limits the request rate, and in return the service domain provides a statistical QoS guarantee. The request rate may be limited for example by putting a cap on the number of simultaneous TCP connections, or on the average (or maximum) number of requests over a given time interval. In return, the service domain may provide QoS guarantees on for example response times, download times, and availability.
We propose the following parameters to be included in SLAs. For network SLAs, we include not only thresholds on availability and bandwidth, but also on the packet-loss ratio p and the RTT. For service-domain SLAs we include, in addition to availability, the mean response time under a condition on a maximum number of simultaneous requests. We realize that this proposal is not yet common practice. However, in order to deliver end-to-end QoS guarantees to the end user it is necessary to have guarantees on the per-domain quality parameters.
This leads to the following four SLAs: (a) SLAaccess
with parameters E[RTTaccess] and paccess, (b) SLAcore with
parameters E[RTTcore] and pcore, (c) SLALS with parameter
γLS, and (d) SLARS with parameter γRS. Using these SLAs
in combination with Equations (1) and (2) we obtain the following upper bounds to the expected end-to-end response times and download times:
E[RT] ≤ E[RTTaccess]+ E[PAS] + γLS + γRS
+ (3/2) E[RTTcore] + fcore(pcore, E[RTTcore], file size) (3)
E[DT] ≤ faccess(paccess, E[RTTaccess], reply size), (4)
where E[PAS] is the mean processing time required by the
application server under the anticipated loads, and fcore(p,
RTT, size) and faccess(p, RTT, size) are the expected
download times of a file of a given size over networks with given values of p and RTT. We refer to [7] for explicit expressions for these functions.
Equations (3) and (4) give upper bounds for the expected response times and download times in terms of the parameters that are under the control of the LRS service provider, and the parameters that are negotiated in the SLAs. This enables the LRS service provider to calculate the implications of particular choices of SLAs on the end-to-end performance metrics. Conversely, for given requirements on the end-to-end performance, the LRS service provider can determine which combinations
of SLAs satisfy these requirements.
Remark 1: The SLA-based approach discussed above is particularly recommended for distributed transaction-based services that require high and predictable quality, for example E-business applications – such as the LRS - where low quality levels directly lead to loss of revenue. Remark 2: We emphasize that our analysis leading to Equations (3) and (4) is also applicable in situations where service providers rely on “sub-contractors” that offer commercially available Web Services [14], [15] for which no performance guarantees can be negotiated. In such a scenario the service provider can monitor the availability and response-time performance of its “sub-contractors”, and switch to a competing Web Service with similar functionality when this competitor delivers a better price/quality ratio. In this context the monitored performance metrics can be viewed as virtual SLAs that can be used in computations similar to Equations (3) and (4). The main difference with real SLAs is that in virtual SLAs no strict performance guarantees are given.
This business model creates an incentive for providers of Web Services (“sub-contractors”) to deliver good quality at reasonable prices, and on the other hand, it enables service providers to “control” the end-to-end quality delivered to the end user. This model has the benefit of being more flexible, avoiding SLA negotiations, but on the downside no strict QoS guarantees can be given, especially for large-scale deployment.
Remark 3: Note that realizing a particular SLA is considered as a single-domain problem. Dimensioning of service and network domains, as well as negotiating realistic SLAs, is the responsibility of the domain owner. As such the multi-domain problem is tackled by
decomposing the problem in single-domain problems and by developing multi-domain SLA calculus. A main advantage of our approach is that it does not require the definition and adaptation of QoS classes and as such is highly technology-independent. For network domains, network dimensioning is common practice for network planning department of operators. However, for service domains only best effort type of service guarantees are given and enforcement of quality guarantees is still not widespread.
4. Modelling end-to-end QoS
In Section 3 it is shown how an upper bound can be derived for the mean end-to-end response and download times, expressed in terms of the performance parameters negotiated in SLAs and the parameters under control of the service provider. However, for many transaction-based services the user-perceived performance also depends on the variability of the end-to-end response and download times: a typical performance requirement defined by service providers is that the probability that the response time exceeds some threshold value is less than some target value. To this end, in this section we develop a queueing model that enables us to predict performance metrics of higher order that go beyond the mean, such as the higher moments and the tail probabilities. Note that analysis of the end-to-end service availability is beyond the scope of the present paper. Instead we focus on the analysis of end-to-end response and download times.
In Section 4.1 we propose a modelling framework for end-to-end performance of transaction-based services that explicitly includes the impact of SLAs. We illustrate this approach for the LRS case. For compactness of the presentation we focus on service domains (see Remark 8 for comment on the inclusion of network domains). In Section 4.2 we discuss a step-by-step approach that helps SPs to negotiate the proper SLAs with other domain owners.
4.1 Model formulation
To capture the multi-domain infrastructure in a modelling framework, we map the infrastructure into a queueing network [11]. The main entities in such a network are jobs, queueing nodes, service time distributions of jobs per queueing node, and routing schemes. In our approach, a job represents a request and a domain consists of one or more queueing nodes of which the parameters are determined by the SLAs. For the SLA structure discussed in Section 3 we model each domain by a multi-server queueing node, where the number of servers represents the maximum number of requests negotiated in the SLA. The service time distribution represents the “worst case” response time distribution
negotiated in the SLA (see Remark 4). The routing schemes follow directly from the request sequences of the services. In this way, SLA parameters are explicitly
included in the model. This enables us to quantify the effect of the SLA parameters on the end-to-end performance, which is not done in previous work to the best of the authors’ knowledge.
To illustrate this general framework, we discuss the model for the LRS case. It consists of a network of three nodes, representing the application server, the location service and the restaurant service, see Figure 4. Customers represent transactions and arrive at the application server (AS) with arrival rate λAS. Let us
follow the processing steps experienced by a tagged customer T. First T requires service time BAS,1 at the AS
with mean βAS,1. Then, T is forwarded to the LS,
requiring service time BLS at the LS with mean βLS. Upon
departure from the LS node, T returns to the AS, and requires service time BAS,2 at the AS with mean βAS,2.
Subsequently, T is routed to the RS, requiring service time BRS at the RS with mean βRS. Next, T returns again
to the AS, where it requires service time BAS,3 at the AS
with mean βAS,3 before departing from the system. The
AS is typically CPU-bound, and is therefore modelled as a Processor Sharing (PS) server; that is, when the server is handling k > 0 requests simultaneously, each of these k requests receives a fair share 1/k of the total processing capacity. The LS is modelled as a multi-server First Come First Serve (FCFS) node, where the number of servers, cLS, represents the maximum number of
simultaneous location lookup requests and the service times represent the “worst-case” response time negotiated in SLALS. Similarly, the RS is also modelled as a
multi-server FCFS node with cRS parallel servers with service
times representing the “worst-case” response time negotiated in SLARS. In this model, the total sojourn time
represents the end-to-end response time experienced by an end user of the LRS service, excluding the access network delay.
In order to achieve performance guarantees beyond the mean response time, the SLAs should not contain only bounds on mean values, but also bounds on variability and specific tail probabilities of these performance metrics. To this end, SLALS may for example contain the
quadruple of parameters (γLS, xLS, αLS, cLS) for which the
following bounds hold (see also Remark 7):
E[BLS] = βLS ≤ γLS (5)
and
Pr{ BLS > xLS } ≤ αLS, (6)
where xLS is a threshold on the service time BLS and αLS is
an upper bound on the probability that BLS exceeds xLS.
Similarly, SLARS may contain the parameters (γRS, xRS,
αRS, cRS), where E[BRS] = βRS ≤ γRS and Pr{ BRS > xRS } ≤
αRS. AS 1 2 3 4 LS domain RS domain λAS SLALS= (γLS, xLS, αLS,cLS) cLSservers SLARS= (γRS, xRS, αRS,cRS) cRSservers (βAS,1, βAS,2,βAS,3)
= request AS AS 1 2 3 4 LS domain RS domain λAS SLALS= (γLS, xLS, αLS,cLS) cLSservers SLARS= (γRS, xRS, αRS,cRS) cRSservers (βAS,1, βAS,2,βAS,3)
= request
Figure 4. End-to-end queueing network model for the service domains.
Remark 4: Theoretically, a probability distribution that satisfies these equations is not uniquely determined. In practice, however, the shape of the service-time distributions can be estimated based on measurements. Then, suitable probability distributions for the service times BLS and BRS can be fitted, and suitable SLA
parameters can be determined.
Remark 5: The SLAs contain agreements on the maximum number of simultaneous requests (i.e., cLS and
cRS in our example). If the AS more requests than agreed
upon, then the consequences depend on implementation-specific choices. For example, requests submitted to a service domain while the number of outstanding requests exceeds its maximum may be rejected or queued, or some hybrid combination.
Remark 6: In the special case where one is only interested in the mean end-to-end response time and the number of requests queued at the service domains is negligible (e.g., AS limits the number of simultaneous requests sent to the service domains, or the service domains reject excess requests) then the mean end-to-end response time satisfies Equation (3). However, the queueing model described above is needed to identify which combinations of SLAs with the service domains lead to the desired end-to-end response-time performance in the following situations: (a) excess requests at the service domains are queued, or (b) the LRS service provider wants to deliver guarantees on higher moments and/or tail probabilities of the end-to-end response times. In case (a) Equation (3) is no longer valid, because the mean response time also depends on the second moment
of the service-time distribution. In case (b) the higher moments and tail probabilities depend not only on the means.
Remark 7: The SLA definition above contains agreements on both the mean and a single specific tail probability. In practice, domain owner are free to negotiate agreements on other sets of parameters. We emphasize that in those cases our approach can still be applied, and that it only needs to be possible to fit suitable distributions for the service times.
4.2 Performance evaluation
The ultimate goal of the modelling framework discussed above is to identify the SLA negotiation space, the set of combinations of SLAs that lead to the desired end-to-end performance. To this end, several techniques are available, including analytical methods based on queueing theory [11], numerical methods, and simulations. Queueing methods are obviously preferred. However, even the seemingly simple model discussed above for the LRS case is beyond the current state-of-the-art in the field [4], [5], [12], and no exact expressions for the exact response time distributions can be obtained. Therefore, we have implemented the model in a simulation tool.
4.3 Step-by-step approach
SPs can apply our modelling framework in the following way:
Step 1:Formulate the end-to-end response time requirements.
Step 2:Formulate the queueing model containing the SLA parameters as outlined in Section 4.1. Step 3:Construct a simulation model.
Step 4:Use the simulation model to evaluate the end-to-end performance as a function of the SLA parameters as outlined in Section 4.2.
Step 5:Identify the SLA negotiation space by selecting those SLA parameter combinations that satisfy the requirements set in Step 1.
In Section 5 we demonstrate the applicability of this step-by-step approach for the LRS case.
5. Validation of the approach
To validate the modelling framework in Section 4 and to demonstrate its practical usefulness, in this section we derive the SLA negotiation space for the LRS case. To this end, we follow the step-by-step approach introduced in Section 4.3.
Step 1:The targeted end-to-end response time RT satisfies the following two requirements: (1) E[RT] ≤ γe2e = 6.5 seconds, and (2) Pr{ RT > xe2e
= 10} ≤ αe2e ∈ {10%, 15%}.
Step 2:The queueing model is depicted in Figure 4. We consider the following parameters: λAS = 30
requests per minute, BAS,1, BAS,2 and BAS,3 are
deterministically distributed with means 0.5, 0.25 and 0.25, respectively. The parameters negotiated in SLALS are as follows: cLS = 2 seconds, γLS = 2
seconds, and xLS = 5 seconds. Similarly, the
parameters of SLALS are cRS = 1 second, γRS = 1
second, and xRS = 3 seconds. The service times
BLS and BRS are assumed to be gamma distributed
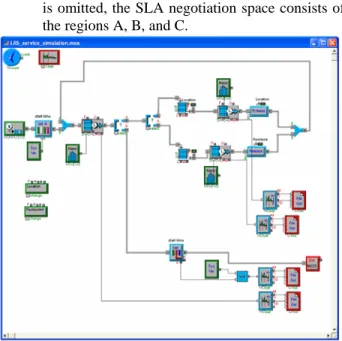
(without affecting the generality of the model). Step 3:We have implemented the simulation model in
the Extend™ simulation environment [9], see Figure 5.
Step 4:For the parameters specified in Step 3 we have simulated both E[RT] and Pr{ RT > 10 sec } for a grid of values of αLS and αRS both ranging from 0
– 10%.
Step 5:Note that in general the SLA negotiation space is an eight-dimensional set of combinations of the SLA parameters (γLS, xLS, αLS, cLS) and (γRS, xRS,
αRS, cRS). To illustrate what the SLA negotiation
space looks like, we fix six of the eight parameters to obtain a two-dimensional plot. Figure 6 shows the combinations of the SLA parameters (αLS, αRS) for which the end-to-end
performance requirements are met (where αLS
ranges from 1% and 10%). The results have been obtained with extensive simulations; confidence intervals are omitted for compactness of the presentation. The lowest curve shows the combinations (αLS, αRS) for which the probability
that the end-to-end response time exceeds xe2e =
10 seconds is less than αe2e = 10%, and the upper
curve shows the results for αe2e = 15%. The
middle curve the combinations (αLS, αRS) for
which the mean end-to-end response time equals γe2e = 6.5 seconds. The SLA negotiation space
(i.e., the combinations of values of (αLS, αRS) for
which the end-to-end performance requirements are met), for given γLS, xLS, cLS, γRS, xRS, cRS and
given xe2e and αe2e, is plotted in Figure 6. For the
case αe2e = 10%, the SLA negotiation space
consists of the region A only. For the case αe2e =
15%, the SLA negotiation space consists of the regions A and B, as the requirement on E[RT] is the most stringent and dominates the requirement on the tail probability Pr{ RT > 10 seconds } = 15%. If the requirement on E[RT] < 6.5 seconds
is omitted, the SLA negotiation space consists of the regions A, B, and C.
Figure 5. Simulation model for the LRS case.
1% 2% 3% 4% 5% 6% 7% 8% 9% 1% 2% 3% 4% 5% 6% 7% 8% 9% 10% alpha_LS al p h a_ R S % 10 } 10 Pr{RT> =αe2e= % 15 } 10 Pr{RT> =αe2e= s RT E[ ]=6.5
A
B
C
1% 2% 3% 4% 5% 6% 7% 8% 9% 1% 2% 3% 4% 5% 6% 7% 8% 9% 10% alpha_LS al p h a_ R S % 10 } 10 Pr{RT> =αe2e= % 15 } 10 Pr{RT> =αe2e= s RT E[ ]=6.5 1% 2% 3% 4% 5% 6% 7% 8% 9% 1% 2% 3% 4% 5% 6% 7% 8% 9% 10% alpha_LS al p h a_ R S % 10 } 10 Pr{RT> =αe2e= % 15 } 10 Pr{RT> =αe2e= s RT E[ ]=6.5A
B
C
Figure 6. SLA negotiation space for the LRS service.
Remark 8: To include network domains in the model, it is important to note that in practice network-level SLAs do not contain application-layer response and download times. Recall from Section 3 that typical parameters that can be considered in network SLAs are network bandwidth, network latency, and packet delay, loss and jitter. To realize application-level quality, these network-level parameters should be mapped to the end-to-end response and download times at the application layer. For both small requests (“mice”) and for longer requests or file downloads (“elephants”) the mean transfer times can be expressed in terms of the network-level parameters negotiated in the network SLAs by applying the expressions in [7]. One solution that works particularly well for networks with negligible latency (e.g., high-speed core networks) is to add a node that models bandwidth sharing (e.g., Generalized Processor Sharing [8], Discriminatory Processor Sharing [1]). For networks
where the latency is considerable (e.g., mobile access networks) such a node may be complemented with an additional node where the service time represents the network latency.
Remark 9: It is important to realize that for the model that includes the communication networks (see Remark 8) the sojourn time of a customer represents the end-to-end RT of a transaction, excluding the nodes that represent the access network bandwidth sharing. The end-to-end DT is then simply modeled as the sojourn time of a customer in the nodes that represent the access network bandwidth sharing.
Remark 10: In the example discussed in Figures 4 and 6 it is assumed that the LRS service provider is responsible for the performance of the application server. In practice, service provider can also outsource this responsibility to a third party. To guarantee end-to-end quality, the LRS service provider also negotiates SLA with such a third party, leading to the situation that the LRS service provider completely outsources the responsibility for the end-to-end quality delivered to its customers. We emphasize that such an outsourcing construction also fits well within our modelling framework, since the impact of this SLA can be modeled in the same way as the other service domain SLAs.
6. Further research
The modelling framework and step-by-step approach discussed in this paper can be used to model the impact of the individual SLAs with service and network domains on the end-to-end performance parameters that are most relevant for transaction-based services. To perform “what-if” analysis, effective performance evaluation techniques are needed, which raises the need for the further development of analytical [4] or approximate [5], [12] techniques to quantify the end-to-end performance.
In the LRS example described in this paper, the different processing steps (see Figure 1) are performed in a fixed sequential order. Transaction-based services may also include processing steps to be performed in parallel. This leads in a straightforward way to models that include fork constructions, for which performance analysis is notoriously hard and still in its infancy.
This paper is focused on transaction-based services. A next step is to extend the modelling framework to hybrid services that combine transaction-based and real-time services, such as VoIP and video services. To this end, a good starting point could be to combine the approach discussed in the present paper with the SLA-based approach for VoIP introduced in [13].
Acknowledgement
This work has been carried out in the context of the project End-to-end Quality of Service in Next Generation Networks (EQUANET), which is supported by the Dutch Ministry of Economic Affairs via its agency SenterNovem.
References
[1] K. Avrachenkov, U. Ayesta, P. Brown, and R. Nunez
Queija, “Discriminatory Processor Sharing Revisited”. Proceedings IEEE Infocom (Miami, FL), March 2005. [2] J.G. Beerends, S. van der Gaast, and O.K, Ahmed, “Web
browse quality modelling”, White contribution COM 12-C3 to ITU-T Study Group 12, November 2004.
[3] ITU-T Study Group 12 G.1030 (G.E2EIPP), “Estimating
end-to-end performance in IP networks for data applications”, December 2005.
[4] O.J. Boxma and H. Daduna, “Sojourn times in queuing
networks”. In: H. Takagi (Ed.), Stochastic Analysis of Computer and Communication Systems, North-Holland, Amsterdam, 1990, pp. 401-450.
[5] O.J. Boxma, R.D. van der Mei, J.A.C. Resing, and K. van Wingerden, “Sojourn time approximations in a two-node queueing network.” In: Performance Challenges for Efficient Next Generation Networks (Eds. X.J. Liang,
Z.H. Xin, V.B. Iversen and G.S. Kuo), Proc. 19th
International Teletraffic Congress (ITC19), Beijing, China, Aug. 29 – Sep. 2, 2005, pp. 1123-1133.
[6] J. Cardoso, F. Curbera, and A. Sheth, “Service Oriented Architectures and Semantic Web Processes”, tutorial at
13th international World Wide Web Conference
(WWW2004), New York NY, USA, 2004.
[7] N. Cardwell, S. Savage, and T. Anderson, “Modeling
TCP latency”, Proceedings IEEE Infocom (Tel Aviv, Israel), March 2000.
[8] J.W. Cohen, “The multiple phase service network with
generalized processor sharing”. Acta Informatica 12 (1979), pp. 245-284.
[9] Extend™ simulation environment,
http://www.imaginethatinc.com/.
[10] M.P. Howarth, P. Flegkas, G. Pavlou, N. Wang, P.
Trimintzios, D. Griffin, J. Griem, M. Boucadair, P. Morand, A. Asgari and P. Georgatsos, “Provisioning for interdomain Quality of Service: the MESCAL approach,” IEEE Communication Magazine, June 2005, pp. 129-137. [11] L. Kleinrock, Queueing Systems - Parts I & II, John
Wiley & Sons, New York, 1975/6.
[12] R.D. van der Mei, B.M.M. Gijsen, N. in’t Veld, and J.L. van den Berg, “Response times in a two-node queueing network with feedback”. Performance Evaluation 49 (2002), pp. 99-110.
[13] R.D. van der Mei, H.B. Meeuwissen and F. Phillipson, “User perceived Quality-of-Service for Voice-over-IP in a Heterogeneous Multi-Domain Network Environment.” In: Performance Challenges for Efficient Next Generation Networks (Eds. X.J. Liang, Z.H. Xin, V.B. Iversen and G.S. Kuo), Proc. 19th International Teletraffic Congress (ITC19), Beijing, China, Aug. 29 – Sep. 2, 2005, pp. 1109-1121.
[14] D. Menasce, “Response-time analysis of composite Web services”. IEEE Internet Computing, January/February 2004, pp. 90-92.
[15] D. Menasce, “Composing Web services: a QoS view”.
IEEE Internet Computing, November/December 2004, pp. 88-90.
[16] I. Sorteberg and O. Kure, “The use of Service Level
Agreements in tactical military coalition force networks,” IEEE Communication Magazine, Nov. 2005, pp. 107-114.