UC San Diego
UC San Diego Electronic Theses and Dissertations
TitleThe ecology and evolution of top-down and bottom-up control in mountain lakes Permalink https://escholarship.org/uc/item/19q4h61t Author Symons, Celia C. Publication Date 2017 Peer reviewed|Thesis/dissertation
eScholarship.org Powered by the California Digital Library
UNIVERSITY OF CALIFORNIA, SAN DIEGO
The ecology and evolution of top-down and bottom-up control in mountain lakes
A dissertation submitted in partial satisfaction of the requirements for the degree Doctor of Philosophy
in
Biology
by
Celia Claire Symons
Committee in charge:
Professor Jonathan Shurin, Chair Professor Ronald Burton
Professor Carolyn Kurle Professor Michael Landry Professor Kaustuv Roy Professor Brice Semmens
©
Celia Claire Symons, 2017 All rights reserved
iii
The Dissertation of Celia Claire Symons is approved, and it is acceptable in quality and form for publication on microfilm and electronically:
Chair
University of California, San Diego 2017
iv
TABLE OF CONTENTS
SIGNATURE PAGE ... iii
TABLE OF CONTENTS ... iv
LIST OF FIGURES ... v
LIST OF TABLES ... vii
ACKNOWLEDGEMENTS ... viii
VITA ... xi
ABSTRACT OF THE DISSERTATION ... xii
INTRODUCTION ... 1
CHAPTER 1 Climate constrains lake community and ecosystem responses to introduced predators ... 20
CHAPTER 2 Gone but not forgotten: Non transitive effects of fish addition and removal on mountain lake plankton communities ... 38
CHAPTER 3 Antagonistic effects of temperature and allochthony on fish growth in California mountain lakes ... 72
v
LIST OF FIGURES
Figure 1.1: The relationship between DOC and mean water temperature. The size of the points corresponds to elevation, with size increasing from low to high elevation 24 Figure 1.2: The effect of elevation and fish on zooplankton species turnover and size structure. (a, b) The Bray–Curtis dissimilarity of zooplankton communities and elevation and (c) The mean body length of zooplankton as a function of DOC and fish ... 25 Figure 1.3: The results of the SEM for lakes (a,c) with and (b,d) without fish. (a,b) Results of the SEM for the ratio of zooplankton biomass to chl-a, and (c,d) for average zooplankton body size. ... 25 Figure 1.4: The effect of temperature on the log-transformed average pelagic biomass
of (a) zooplankton, (b) phytoplankton (chl-a) and (c) the ratio of zooplankton to chl-a
(ZB:PB) for lakes along a temperature gradient ... 26 Figure 1.5: The effect of temperature on ecosystem rates, including (a) the percentage of leaves decomposed over a 31-day incubation period and (b) benthic production per incubation period (31 days) for lakes along a temperature gradient ... 26 Figure 1.6: A schematic of communities and relative biomass of zooplankton and
chl-a along the elevational temperature gradient ... 27
Figure 1A.1: Correlations between temperature, elevation, log transformed
conductivity, pH, log-transformed TKN and log-transformed DOC ... 33 Figure 1A.2: The results of the SEM for (A, C) lakes with fish and (B, D) lakes without fish for litter decomposition and benthic production ... 34 Figure 1A.3: A RDA of the zooplankton community data. The names of the taxa are scaled according to their body size ... 35 Figure 1A.4: The Bray-Curtis dissimilarity of zooplankton communities in fish-fishless pairs of lakes as a function of the mean elevation of the lakes ... 36 Figure 2.1:Schematic of the experimental design. Plankton communities were
collected from lakes at two elevations, with and without fish (History) and exposed to different elevations and fish in mesocosms (Experiment) ... 51 Figure 2.2: Daily average water temperature from a montane, sub-alpine and alpine elevation mesocosm in red, purple and blue respectively ... 52
vi
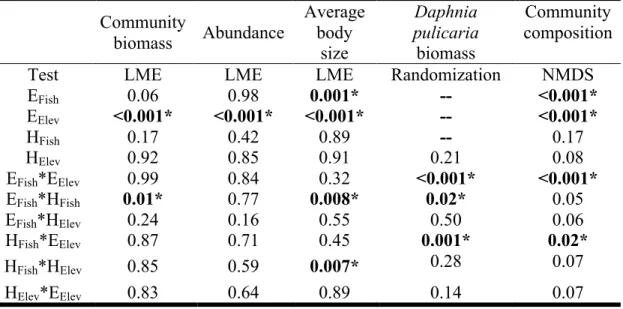
Figure 2.3:The response of (A, B) total zooplankton biomass, (C-E) mean community body size to experimental treatments ... 52 Figure 2.4:The response of Daphnia pulicaria biomass to treatments ... 53 Figure 2.5:NMDS ordination results highlighting significant predictors of community composition (A) EFishxEElev and(B) HFishxEElev. (C) Species loading are shown, with the
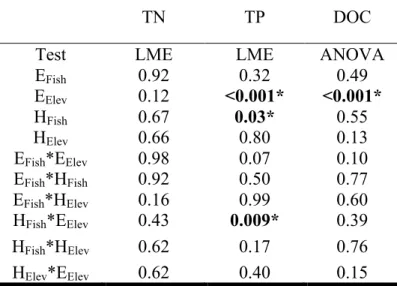
size of the text scaled to the average body size of each taxon ... 53 Figure 2A.1: NMDS ordination of the inoculum samples. Each point represents an aliquot of the inoculum and taxa names are placed according to their loading on the NMDS axes ... 62 Figure 2B.1: Total nitrogen measured over the summer of 2016. The letters denote which groups are significantly different from each other at p<0.05 ... 65 Figure 2B.2:Total phosphorus measured from the mesocosms over the summer of 2016... 66 Figure 2B.3:The dissolved organic carbon in mesocosms at each of the three EElev
sites. The letters denote which groups are significantly different from each other at p<0.05 ... 66 Figure 3.1:Added-variable plots for predictors of body condition in the final model selected by forward AIC selection ... 83 Figure 3.2: (A) Growth trajectories for individual fish plotted as the otolith annuli radius as a function of age. (B-E) Added-variable plots for predictors of individual growth in the final model selected by forward AIC selection ... 85 Figure 3A.1: A PCA of DOC quality metrics: Freshness Index and Specific UV Absorption (SUVA) ... 91
vii
LIST OF TABLES
Table 1A.1: p-values of ANOVAs testing the effects of elevation and fish presence on physical and chemical lake variables ... 32 Table 2.1 p-values for mixed effects models and ADONIS permutational analysis of the community composition ... 51
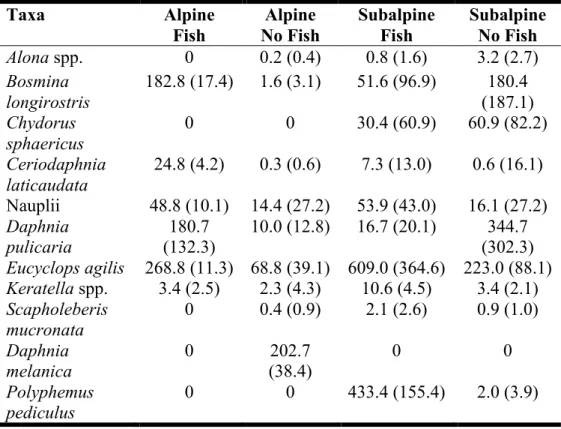
Table 2A.1:Lakes sampled for source communities and the abundance and biomass of the zooplankton used to inoculate mesocosms ... 62
Table 2A.2:The mean biomass of each species in the inoculum. Standard deviations are presented in parentheses ... 63 Table 2A.3:Initial water chemistry at the three experimental sites. Values are reported as means with standard errors in parentheses ... 63 Table 2B.1: p-values for mixed effectsmodels and ANOVA of total nitrogen (TN), total phosphorus (TP) and dissolved organic carbon (DOC) ... 65 Table 2C.1:p-values for mixed effectsand permutation models ... 67 Table 3.1: Median and range of physical and environmental variables from the 20 lakes sampled ... 83 Table 3.2:Importance values for predictors of fish condition (mg mm-3) and fish growth (mm otolith year-1) from mixed effects models ... 84 Table 3A.1:Importance values for predictors of fish growth (mm otolith year-1) from
mixed effects models. Bold values represent predictors that were included in the best model from forward AIC selection ... 92
viii
ACKNOWLEDGEMENTS
I would like to thank all of undergraduates and assistants who helped with this research including Lara Jansen, Brandon Güell, Marisa McDaniel, Sean Ables, Steven Villareal, Emily Adamczyk, Alexis Davis, Melissa Quon, Kathia Cortez, Sabrina Tucker, Duyen Nguyen, Julia Small, Stephanie Belill, Julia Gaudio, Catherine Banach, Jeffrey Wilde, Gabriela Reyes, Adriana Pedroza, and Scott Forster.
This research benefitted from feedback and logistical support from Dan Dawson and Roland Knapp. Thank you both for sharing your knowledge of the Sierra Nevada lakes, and always being available to help develop interesting and logistically feasible questions. Thank you to Steven Sadro and Justin Meyer for helpful
discussions. Thank you to Stuart Sandin, Brian Zgliczynski, Lihini Aluwihare, Brandon Stephens and Natalie Mladenov for providing guidance and technical assistance. Thank you to Jeremiah Eanes, Denise Waterbury, Becca Fenwick, Kim Rose, J.D. and all the staff of the Sierra Nevada Aquatic Research Laboratory, White Mountain Research Center and the Sierra Nevada Research Stations for their field support and knowledge.
Thank you to my committee - Kaustuv Roy, Carolyn Kurle, Brice Semmens, Michael Landry, Ron Burton – for their feedback and guidance throughout my time at UCSD.
Thank you to my advisor, Jonathan Shurin, for all of the help you provided. You have been a great source of support and I appreciate all of the time and thought that you put into my project and career.
ix
Cavalheri, Natalie Jones, Ben Van Allen and especially Akana Noto for the multitude of support you all provided, my time in graduate school has been much richer because of you.
Thank you also to fellow EBE students for helpful discussions, moral support and occasional assistance in the field, especially Ellen Esch, James Hung, Chris Kopp, Cali Turner-Tomaszewicz, Elizabeth Hetherington. Thank you to Hillary Jean Young and Tara Pixley. Thanks to my grandfather Sam Major for being a constant source of pep talks. Finally, I would like to thank my parents, Doug and Sonya, my sister Kelsey and my partner Margo for their support and advice throughout graduate school.
Funding was provided by University of California, San Diego Division of Biological Sciences; the National Science and Engineering Research Counsel of Canada; University of California, San Diego Frontiers of Innovation Scholars
Program; a Valentine Ecological Reserve Graduate Student Grant; a White Mountain Research Grant; a Mildred E. Mathias Graduate Student Research Grant; Institute for the Study of Ecological and Evolutionary Climate Impacts; a Ruth Stern Graduate Fellowship; and the Jean Marie Messier Memorial Endowment
Chapter 1, in full, is a reprint of the material as it appears in: Symons, C.C. and J.B. Shurin. 2016. Climate constrains lake community and ecosystem responses to introduced predators. Proceedings of the Royal Society B 283: 20160825. The dissertation author is the primary investigator and author of this paper.
Chapter 2, in full, is currently being prepared for submission for publication of the material. Symons C.C., M.A. Schulhof, H.B. Cavalheri and J.B. Shurin. The dissertation author is the primary investigator and author of this paper.
x
Chapter 3, in full, is currently being prepared for submission for publication of the material. Symons C.C., M.A. Schulhof, H.B. Cavalheri and J.B. Shurin. The dissertation author is the primary investigator and author of this paper.
xi VITA
2010 Bachelor of Science (Honors), Queen’s University, ON 2012 Master of Science, Queen’s University, ON
2017 Doctor of Philosophy, University of California, San Diego, La Jolla, CA PUBLICATIONS
Symons, C.C. and Shurin, J.B. 2016. Climate constrains lake community and ecosystem responses to introduced predators. Proceedings of the Royal Society B: Biological Sciences 283:20160825
Symons, C.C. and Arnott, S.E. 2014. Timing is everything: priority effects alter post-disturbance invasibility. Ecology and Evolution 4: 397-407.
Symons, C.C., Pedruski, M., Sweetman, J.N. and Arnott S.E. 2014. Spatial, abiotic and biotic determinants of zooplankton community composition in Subarctic tundra ponds in Wapusk National Park, Canada. Arctic, Antarctic and Alpine Research 46: 159-190.
Symons, C.C. and Arnott, S.E. 2013. Regional zooplankton dispersal provides spatial insurance for ecosystem function. Global Change Biology 19: 1610–1619.
Symons, C.C., Arnott, S.E. and Sweetman, J.N. 2012. Grazing rates of crustacean zooplankton communities on intact phytoplankton communities in Canadian Subarctic lakes. Hydrobiologia 694: 131-141.
Symons, C.C., Arnott, S.E. and Sweetman, J.N. 2012. Nutrient limitation of
phytoplankton communities in Subarctic lakes and ponds in Wapusk National Park, Canada. Polar Biology 35: 481-489.
xii
ABSTRACT OF THE DISSERTATION
The ecology and evolution of top-down and bottom-up control in mountain lakes
by
Celia Claire Symons
Doctor of Philosophy in Biology
University of California, San Diego, 2017
Professor Jonathan Shurin, Chair
Determining factors that control how biomass is distributed among plants, animals, microbes and non-living components of ecosystems is a major goal of ecology. Theoretical and empirical work have demonstrated that ecosystem structure and function may vary with the environment, but studies often overlook the role of adaptation and shifts in species composition that will occur over longer timescales relevant to climate change. For my doctoral research I used a ‘natural experiment’ in
xiii
Sierra Nevada mountain lakes to ask questions about the strength of top-down and bottom-up forcing in a natural system where communities have assembled and adapted to differences in the environment over periods from years to millennia.
In Chapter 1 I compare fish and fishless lakes along an elevational gradient, and show that an interaction between fish presence and temperature alters food web structure, ecosystem function, species and trait composition. Top-down forcing from fish on plankton biomass was stronger in warm lakes, suggesting that a warmer climate will magnify the effect of introduced predators on biomass distribution. Fish and warmer temperatures select for the same species and traits of zooplankton in lakes, suggesting that lakes containing invasive predators may be less sensitive to warming. In Chapter 2 I test this hypothesis using a large-scale community transplant experiment, where I transplanted plankton communities that assembled and evolved at different elevations and predator regimes to new elevations and the addition or
removal of fish. I found that past exposure to fish caused an evolutionary response in keystone members of the zooplankton community that increased their fitness in environments without fish. This suggests that past selection can change how
communities will respond to further environmental change. In Chapter 3, I show that bottom-up processes influence fish growth, with higher growth rates occurring in warmer, clearer lakes. My thesis helps to elucidate the effects of temperature and predators on physiology, evolution, species ranges and community interactions, which is necessary to forecast the response of ecosystems to climate change. My thesis integrates across these levels of organization to understand the origin of ecosystem resilience in a changing climate.
1
INTRODUCTION
Determining the factors that control primary productivity and regulate its distribution among ecosystem components (including plants, animals, microbes, detritus and inorganic material) is a long-standing goal of ecology. The availability of resources can limit productivity through bottom-up forcing. For example, large-scale ecosystem productivity is frequently related to the supply of resources such as
nitrogen and phosphorus in terrestrial, marine and freshwater ecosystems (Hecky and Kilham 1988, Elser et al. 1990, Vitousek and Howarth 1991, Stevens et al. 2015). In addition, the intensity of top-down consumption can alter the production and standing biomass of lower trophic levels across broad scales. Hairston et al.’s (1960) ‘Green World’ hypothesis posited that predators limit herbivores, allowing plants to grow abundant. Top-down forcing from consumers can result in a trophic cascade, or alternating top-down vs. bottom-up control of biomass of adjacent trophic levels (Carpenter et al. 1985, Terborgh and Estes 2010). As humans alter the global availability of nutrients (Falkowski et al. 2000) and introduce and extirpate species, particularly large-bodied top predators (Estes et al. 2011), understanding the role of consumer and resource control on ecosystems is of increasing importance.
Despite historical disagreements in the field of Ecology, both top-down and bottom-up control have been established as important structuring processes in
ecosystems and food webs, and contemporary ecologists focus instead on the relative strength of bottom-up and top-down forces in food webs (e.g., Elton 1927, Hairston et al. 1960, Polis and Strong 1996, Gruner et al. 2008). The strength of resource and consumer control can vary greatly among ecosystems (Borer et al. 2005). For
2 example, the addition of nitrogen and phosphorus generally increase primary
productivity through bottom-up control, though the strength of the effect varies among habitat types (Elser et al. 2007). Similarly, the strength of consumer control can vary among ecosystems (Shurin et al. 2002). For example, the addition or extirpation of fish in lakes can cause a range of outcomes, from a strong change in algal abundance (Carpenter et al. 1987, Pace et al. 1999), to weaker or undetectable effects (e.g., Elser et al. 1995, Kim and DeVries 2000). The strength of both bottom-up and top-down control can be altered by biotic factors that affect predator-prey interactions. Bottom-up control can be altered by factors such as anti-herbivory traits and nutrient ratios (Cruz-Rivera and Hay 2000, Hessen et al. 2002, Hillebrand et al. 2009, Anderson et al. 2010), while the strength of top-down control can depend on the availability of prey refugia (Beukers and Jones 1998), body-size differences between predators and prey (Shurin and Seabloom 2005) and anti-predator adaptations (Sih et al. 2010, Ingram et al. 2012).
Abiotic environmental factors can also change the strength of resource and consumer control. Global warming has focused attention on the influence of temperature on the balance between top-down and bottom-up forcing. Different organisms and physiological processes vary in their thermal sensitivity (Dewar et al. 1999, Allen et al. 2005, Lopez-Urrutia et al. 2006, Dell et al. 2014, Uszko et al. 2017). For example, metabolism increases with temperature in both consumers and
producers; however, empirical data show that photosynthesis does not increase as quickly as consumer metabolism (Dewar et al. 1999). Mathematical models indicate that the different temperature sensitivities of these processes influences the strength of
3 top-down control (Vasseur and McCann 2005, O'Connor et al. 2011, Dell et al. 2014), though the predictions of the models are highly dependent on assumptions (Uszko et al. 2017). Experimental work has provided evidence that top-down control may increase with temperature (e.g., Hoekman 2011, Shurin et al. 2012). For example, an aquatic mesocosm experiment showed that increasing temperatures decreased
phytoplankton and periphyton biomass while consumer biomass was relatively unchanged (Shurin et al. 2012). However, it remains unclear how bottom-up and top-down forces vary along broad environmental gradients in nature, such as temperature or nutrient supply.
This thesis describes work aimed at understanding the role of important abiotic and biotic factors, such as temperature, dissolved organic carbon (DOC) and community composition, in determining the relative strength of top-down and bottom-up control in California mountain lake ecosystems. Past studies measured the metabolic response of communities to changes in the environment in the absence of major ecological or evolutionary shifts. However, climate change occurs over long time-scales, where species composition and traits may shift in response to new environmental conditions and ultimately determine lake ecosystem structure and function. To answer important questions about the longer-term impact of higher temperatures, DOC and the introduction of predators, I used a unique large ‘natural laboratory’ of lakes in the Sierra Nevada where lakes are arrayed along a temperature and DOC gradient driven by elevation, and have a varied history of fish stocking. First, I ask how the strength of top-down control varies along broad elevational (temperature, DOC) gradients. Second, I ask how shifts in zooplankton species and
4 trait composition alter community responses to changes in the environment and
introduction of predators. Finally, I ask how bottom-up control on fish growth varies along the gradients in temperature and DOC. In each case, theory and empirical work provide conflicting evidence about the cumulative effects of consumers, prey and the environment. Theory and experiments in controlled environments such as mesocosms present a range of possible outcomes for the effects of warming and dissolved organic carbon (DOC) on top-down and bottom-up processes, which have yet to be evaluated in natural ecosystems. The use of this natural experiment can elucidate responses to changes in the environment over long time periods.
Recent changes to lake ecosystems – temperature, resources and predators
Increases in temperature over the last century have already greatly affected aquatic ecosystems and it is predicted that global temperatures, temperature
variability, and frequency of extreme weather events will continue to increase (IPCC 2014). Alpine and polar aquatic ecosystems are particularly sensitive to climate warming (Hauer et al. 1997), as reduced snowpack and ice cover results in decreased albedo and higher heat absorption, magnifying the effect of higher air temperatures (Bradley et al. 2004). As a result, organisms inhabiting these environments are more susceptible to warming. In lakes, many cold-water zooplankton that are large-bodied (cladoceran and copepods) are expected to decline as temperatures warm (Moore et al. 1996). Warmer temperatures favor small zooplankton because warming increases the cost of development and respiration more than ingestion (Moore et al. 1996). A reduction in mean body size of zooplankton can have large effects on aquatic
5 size of zooplankton can influence the biomass of phytoplankton, resulting in lower water clarity (Mazumder et al. 1990) and lower fish abundance (Moore and Folt 1993). Therefore, indirect effects of climate change through physical processes and ecological interactions are likely to be critical determinants of the future state of aquatic ecosystems and may be as important as the direct effects of changes in the physical environment (Blois et al. 2013, Alexander et al. 2015).
One indirect effect of warming is the “browning” of lakes, as inputs of DOC of terrestrial origin increases (Larsen et al. 2011). In particular, allochthonous DOC inputs to inland waters in Europe and North America have increased since the 1990s (Evans et al. 2006), driven by an increase in soil decomposition at higher temperatures (Schmidt et al. 2002) and increases in vegetation growth in alpine watersheds due to tree-line advance (Walther et al. 2005). Terrestrially-derived allochthonous DOC contains recalcitrant, colored compounds, which reduce water transparency, attenuate light, increase bacterial production, and suppress phytoplankton production (reviewed in Williamson et al. 1999). Conflicting hypotheses have been proposed to relate
bottom-up forcing from DOC to fish production in lakes (Karlsson et al. 2009, Jones et al. 2012, Finstad et al. 2014, Benoît et al. 2016). DOC may enhance fish production
by blocking harmful UV rays and by stimulating microbial production that is
transferred through food webs (Hessen et al. 2009, Karlsson et al. 2009).
Alternatively, DOC may reduce fish production if it provides poor quality food, and
decreases aquatic primary production through shading (Brett et al. 2017). Examining the role of DOC in nature will help to determine when DOC will function to as a subsidy or control on production in lakes. Additionally, increases in temperature and
6 DOC are occurring simultaneously, yet we have little understanding of their
synergistic effects on lake ecosystems.
In addition to changes in environmental condition, many species of fish have been introduced to lakes outside their natural ranges intentionally for food and sport, or unintentionally from aquaria and bait buckets (Strayer 2010). Relevant to this thesis, fishes have been introduced into many naturally fishless high elevation lakes around the world, reducing the diversity and abundance of native fauna (Schindler and Parker 2002, Sarnelle and Knapp 2005). Many impacts of introduced predators result from large consumptive effects on naïve prey (reviewed in Sih et al. 2010). Most fish are visual predators and selectively prey on large zooplankton (e.g., keystone Daphnia
spp.), thereby reducing zooplankton abundance and mean body size (Brooks and Dodson 1965). The effects of fish predation propagate through cascading trophic interactions (Carpenter et al. 1985). For example, in a 3-level food chain,
planktivorous fish suppress herbivorous zooplankton, resulting in increased phytoplankton biomass (Carpenter et al. 1985). Indeed, lake trophic cascades have been shown in whole-lake experiments, cross-lake comparisons and mesocosm experiments (Estes et al. 2011), though there is large variation in the magnitude of predator effects (Terborgh and Estes 2010). Thus, the introduction of fish to lakes has cascading effects on diversity, species composition and biomass.
Multiple stressors and timescales of change
The possibility for adaptive phenotypic changes to occur on ecological time-scales has been highlighted by studies of species responses to anthropogenic stressors (Hairston et al. 1999, Latta et al. 2010). These studies demonstrate that genetically
7 based phenotypic changes can influence ecological processes such as
consumer-resource dynamics (Hairston et al. 1999, Yoshida et al. 2003) and rescue species from extinction (Carlson et al. 2014). Although population differentiation can influence ecological processes, many studies are conducted over time scales too short for ecological or evolutionary shifts, ignoring the role of local adaptation in community resilience (but see Zuppinger-Dingley et al. 2014 for example). For example, experiments examining community response to temperature typically expose a community to different temperatures (e.g., Strecker et al. 2004); however, shifts of species and traits over longer time periods may moderate the effect of environmental change on populations or communities. Therefore, a combination of experiments and studies over natural temperature gradients where communities have assembled and evolved over longer time periods will give a clearer indication of the long-term effects of changes in climate.
Global environmental change may interact to reduce or amplify the impact of other stressors on communities depending on the co-tolerances of species to the stressors in question (Vinebrooke et al. 2004, Christensen et al. 2006). For example, higher temperatures favor small-bodied zooplankton, thus warmer lakes may be more resistant to changes in composition and biomass when fish are introduced. However, the indirect effects of the environment on species interactions can be as important as the direct effect of climate change on species (Blois et al. 2013, Alexander et al. 2016). It remains unclear how many of the stressors facing mountain lakes will interact to influence community structure and function in nature where there is
8 turnover in species composition and adaptation to new environments over time
(Alexander et al. 2016).
In addition, the type of disturbance (e.g., press, pulse, fluctuating) will influence population and community responses. For example, the addition of invasive fish to a lake is akin to a press disturbance where the lake community experiences fish presence from the point of introduction onward. Conversely, although mean temperatures are increasing, temperature varies spatially and temporally within lakes – with depth, interannually, seasonally – which may change the strength or type of selection to temperature change (Murren et al. 2015). We might expect to see more local
adaptation, or fixed differences among populations in response to the addition of fish, whereas populations may adapt to new temperature regimes with increased plasticity due to natural temperature fluctuations. The mechanisms by which populations adapt to changes in the environment have not been examined over broad environmental gradients in nature.
Study site
Alpine lakes in the Sierra Nevada provide an ideal system to ask questions about the independent and interactive effects of temperature, DOC and introduced predators. The altitudinal gradient provides a natural gradient in temperature and DOC, and the history of fish stocking means that some lakes are fishless, while others contain self-sustaining populations of trout. Generally, lakes in the Sierra are small (0.5-10 ha surface area), shallow (<15 m in maximum depth) and are located throughout subalpine and alpine zones (Knapp et al. 2001). They are oligotrophic, species-poor and ice-free for only 4 months per year (Melack et al. 1985). Due to
9 similar glacial origin and bedrock, these lakes show little variation in physical and chemical characteristics (Melack et al. 1985, Sadro et al. 2011, Piovia-Scott et al. 2016).
Prior to fish stocking, 99% of the lakes of the Sierra Nevada were fishless due to barriers to upstream movement of fish (Knapp 1996). Fish stocking began in the mid-1800s, and over the next century 80-95% of the lakes were stocked to create recreational fishing opportunities (Knapp 1996, Knapp and Matthews 2000). The three most commonly stocked fish were rainbow trout (Oncorhynchus mykiss), golden trout (O. m. auguabonita), and brook trout (Salvelinus fontinalis) (Knapp 1996). This decreased zooplankton species richness, and shifted community composition to small crustacean species, extirpating formerly abundant species of large crustacean
zooplankton (Knapp and Matthews 2000, Knapp et al. 2001). The species of zooplankton that were not extirpated by fish introduction rapidly evolved new life history traits associated with fish predation: smaller offspring, smaller size at maturity and shorter time to maturity (Fisk et al. 2007). Lakes with introduced fish have higher phytoplankton biomass than their fishless counterparts, which is mainly driven by reduced zooplankton herbivory (Sarnelle and Knapp 2005). Because some lakes contain introduced populations of trout while others remain fishless, this is an ideal system to ask questions about the role of predators in lakes. Additionally, the elevation gradient provides broad environmental gradients, particularly in temperature and terrestrial DOC loading, to examine how the environment shapes top-down and bottom-up forcing in nature.
10
Chapter summaries
In Chapter 1, I ask if climate determines predators’ impact on lake ecosystems. I address this knowledge gap by comparing lakes with and without stocked trout along an elevational temperature and DOC gradient. I show that a warmer climate destabilizes mountain lake ecosystems by increasing the cascading effects of predators on lower trophic level biomass. Shifts in species composition dampened the impact of fish on invertebrate and algal biomass in cold, low DOC lakes more than warm, high DOC lakes. Warming experiments have shown that consumer-resource interactions increase in strength with temperature due to differential
physiological responses of producers and consumers. My results from a natural system where communities vary in species and size composition along an elevational gradient show that temperature can mediate the strength of trophic cascades.
In Chapter 2, I ask if phenotypic selection within and among species can shape responses to top-down (fish) and bottom-up (temperature) forcing. I used an innovative and large-scale community transplant experiment (analogous to a common garden experiment) across elevation to determine how communities that varied in their ecological and evolutionary history respond to changes in elevation-related environmental variables and addition of predators. My experiment revealed that past selection by fish on plankton species composition and phenotypic traits influence resilience to predator extirpation. Zooplankton communities with an
evolutionary history of exposure to fish predation reached higher trophic level biomass in the absence of fish than those from fishless lakes. This non-transitive response of fish addition and removal was likely driven by selection on life-history traits that
11 persisted over many generations. Interestingly, the effect of experimental elevation was unrelated to the origin of the community, suggesting that phenotypic plasticity dominates the response of zooplankton to temperature, while genetic adaptation is more important for predation.
In Chapter 3, I ask how bottom-up forcing from temperature and DOC affects fish growth rates. I sampled fish populations along broad environmental gradients to determine correlates of fish growth rates and body condition. I found that fish grew faster in warmer lakes, and slower in high DOC lakes. Additionally, I examined the role of chemical characteristics of the DOC pool (the contributions of terrestrial or algal based DOC) and found that high DOC quality was associated with better fish body condition. Lakes are experiencing ongoing warming and browning, and this chapter provides insight into the impact these changes will have on the growth rates of fish in oligotrophic, low DOC mountain lakes that are predicted to be the most influenced by small changes in DOC concentration. The antagonistic interaction between temperature and DOC suggests that as lakes warm and brown there will be a weaker impact on fish growth if these two stressors occur simultaneously than if either occurred independently.
Conclusion
The impacts of environmental change on populations, communities and ecosystems play out over long periods through community assembly and trait evolution. However, most climate change experiments are too short to observe the effects of these processes on population persistence and ecosystem functioning. By integrating information from lake surveys and a mesocosm experiment using
12 communities from different selective histories, I was able to disentangle the effects of temperature, DOC and predators on the structure of lake populations, communities and ecosystems over times scales that are relevant to future climate change. By examining the impact of temperature and predators on natural lake ecosystems I determined their long-term effects on food web structure and community composition (Chapter 1). By measuring the response of communities with different selective histories to the combined impacts of predators and elevation I determined how ecological and evolutionary change influence the resilience of lakes communities to future environmental change (Chapter 2). Finally, by examining the growth of fish along temperature and DOC gradients, I determined how this important ecosystem service may respond to different environmental changes in the future (Chapter 3). These studies provide insight into how climate change will influence California mountain lakes and supplement theory and experiments that have not considered the
implications of long-term shifts in traits and species, and the impact of these on ongoing and future climate change.
References
Alexander, J. M., J. M. Diez, S. P. Hart, and J. M. Levine. 2016. When climate reshuffles competitors: A call for experimental macroecology. Trends in Ecology and Evolution 31:831-841.
Alexander, J. M., J. M. Diez, and J. M. Levine. 2015. Novel competitors shape species' responses to climate change. Nature 525:515-518.
Allen, A. P., J. F. Gillooly, and J. H. Brown. 2005. Linking the global carbon cycle to individual metabolism. Functional Ecology 19:202-213.
Anderson, T. M., J. G. C. Hopcraft, S. Eby, M. Ritchie, J. B. Grace, and H. Olff. 2010. Landscape-‐scale analyses suggest both nutrient and antipredator advantages to Serengeti herbivore hotspots. Ecology 91:1519-1529.
13 Benoît, P.-O., B. E. Beisner, and C. T. Solomon. 2016. Growth rate and abundance of
common fishes is negatively related to dissolved organic carbon concentration in lakes. Canadian Journal of Fisheries and Aquatic Sciences 73:1230-1236. Beukers, J. S., and G. P. Jones. 1998. Habitat complexity modifies the impact of
piscivores on a coral reef fish population. Oecologia 114:50-59.
Blois, J. L., P. L. Zarnetske, M. C. Fitzpatrick, and S. Finnegan. 2013. Climate change and the past, present, and future of biotic interactions. Science 341:499-504. Borer, E., E. Seabloom, J. Shurin, K. Anderson, C. Blanchette, B. Broitman, S.
Cooper, and B. Halpern. 2005. What determines the strength of a trophic cascade? Ecology 86:528-537.
Bradley, R. S., F. T. Keimig, and H. F. Diaz. 2004. Projected temperature changes along the American cordillera and the planned GCOS network. Geophysical Research Letters 31:L16210.
Brett, M. T., S. E. Bunn, S. Chandra, A. W. E. Galloway, F. Guo, M. J. Kainz, P. Kankaala, D. C. P. Lau, T. P. Moulton, M. E. Power, J. B. Rasmussen, S. J. Taipale, J. H. Thorp, and J. D. Wehr. 2017. How important are terrestrial organic carbon inputs for secondary production in freshwater ecosystems? Freshwater Biology:1-22.
Brooks, J. L., and S. I. Dodson. 1965. Predation, body size, and composition of plankton. Science 150:28-35.
Carlson, S. M., C. J. Cunningham, and P. A. Westley. 2014. Evolutionary rescue in a changing world. Trends in Ecology and Evolution 29:521-530.
Carpenter, S. R., J. F. Kitchell, and J. R. Hodgson. 1985. Cascading trophic interactions and lake productivity. BioScience 35:634-639.
Carpenter, S. R., J. F. Kitchell, J. R. Hodgson, P. A. Cochran, J. J. Elser, M. M. Elser, D. M. Lodge, D. Kretchmer, X. He, and C. N. von Ende. 1987. Regulation of lake primary productivity by food web structure. Ecology 68:1863-1876. Christensen, M. R., M. D. Graham, R. D. Vinebrooke, D. L. Findlay, M. J. Paterson,
and M. A. Turner. 2006. Multiple anthropogenic stressors cause ecological surprises in boreal lakes. Global Change Biology 12:2316-2322.
Cruz-Rivera, E., and M. E. Hay. 2000. Can quantity replace quality? Food choice, compensatory feeding, and fitness of marine mesograzers. Ecology 81 :201-219.
14 Dell, A. I., S. Pawar, and V. M. Savage. 2014. Temperature dependence of trophic
interactions are driven by asymmetry of species responses and foraging strategy. Journal of Animal Ecology 83:70-84.
Dewar, R. C., B. E. Medlyn, and R. E. McMurtrie. 1999. Acclimation of the
respiration/photosynthesis ratio to temperature: insights from a model. Global Change Biology 5:615-622.
Elser, J. J., M. E. Bracken, E. E. Cleland, D. S. Gruner, W. S. Harpole, H. Hillebrand, J. T. Ngai, E. W. Seabloom, J. B. Shurin, and J. E. Smith. 2007. Global analysis of nitrogen and phosphorus limitation of primary producers in freshwater, marine and terrestrial ecosystems. Ecology Letters 10:1135-1142. Elser, J. J., C. Luecke, M. T. Brett, and C. R. Goldman. 1995. Effects of food web
compensation after manipulation of rainbow trout in an oligotrophic lake. Ecology 76:52-69.
Elser, J. J., E. R. Marzolf, and C. R. Goldman. 1990. Phosphorus and nitrogen limitation of phytoplankton growth in the freshwaters of North America: a review and critique of experimental enrichments. Canadian Journal of Fisheries and Aquatic Sciences 47:1468-1477.
Elton, C. 1927. Animal ecology. Sidgwick and Jackson, London. Reprinted in 2001 by The University of Chicago Press. ISBN 0-226-20639-4.
Estes, J. A., J. Terborgh, J. S. Brashares, M. E. Power, J. Berger, W. J. Bond, S. R. Carpenter, T. E. Essington, R. D. Holt, J. B. C. Jackson, R. J. Marquis, L. Oksanen, T. Oksanen, R. T. Paine, E. K. Pikitch, W. J. Ripple, S. A. Sandin, M. Scheffer, T. W. Schoener, J. B. Shurin, A. R. E. Sinclair, M. E. Soulé, R. Virtanen, and D. A. Wardle. 2011. Trophic downgrading of planet earth. Science 333:301-306.
Evans, C. D., P. J. Chapman, J. M. Clark, D. T. Monteith, and M. S. Cresser. 2006. Alternative explanations for rising dissolved organic carbon export from organic soils. Global Change Biology 12:2044-2053.
Falkowski, P., R. Scholes, E. Boyle, J. Canadell, D. Canfield, J. Elser, N. Gruber, K. Hibbard, P. Högberg, and S. Linder. 2000. The global carbon cycle: a test of our knowledge of earth as a system. Science 290:291-296.
Finstad, A. G., I. P. Helland, O. Ugedal, T. Hesthagen, and D. O. Hessen. 2014. Unimodal response of fish yield to dissolved organic carbon. Ecology Letters
15 Fisk, D. L., L. C. t. Latta, R. A. Knapp, and M. E. Pfrender. 2007. Rapid evolution in
response to introduced predators I: rates and patterns of morphological and life-history trait divergence. BMC Evolutionary Biology 7:22.
Gruner, D. S., J. E. Smith, E. W. Seabloom, S. A. Sandin, J. T. Ngai, H. Hillebrand, W. S. Harpole, J. J. Elser, E. E. Cleland, and M. E. Bracken. 2008. A cross-‐
system synthesis of consumer and nutrient resource control on producer biomass. Ecology Letters 11:740-755.
Hairston, N. G., W. Lampert, C. E. Caceres, C. L. Holtmeier, L. J. Weider, U. Gaedke, J. M. Fischer, J. A. Fox, and D. M. Post. 1999. Lake ecosystems: Rapid
evolution revealed by dormant eggs. Nature 401:446-446.
Hairston, N. G., F. E. Smith, and L. B. Slobodkin. 1960. Community structure, population control, and competition. The American Naturalist 94:421-425. Hauer, F. R., J. S. Baron, D. H. Campbell, K. D. Fausch, S. W. Hostetler, G. H.
Leavesley, P. R. Leavitt, D. M. McKnight, and J. A. Stanford. 1997. Assessment of climate change and freshwater ecosystems of the Rocky Mountains, USA and Canada. Hydrological Processes 11:903-924.
Hecky, R., and P. Kilham. 1988. Nutrient limitation of phytoplankton in freshwater and marine environments: a review of recent evidence on the effects of enrichment. Limnology and Oceanography 33:796-822.
Hessen, D. O., T. Andersen, S. Larsen, B. L. Skjelkvåle, and H. A. de Wit. 2009. Nitrogen deposition, catchment productivity, and climate as determinants of lake stoichiometry. Limnology and Oceanography 54:2520-2528.
Hessen, D. O., P. J. Færøvig, and T. Andersen. 2002. Light, nutrients, and P:C ratios in algae: grazer performance related to food quantity and quality. Ecology
83:1886-1898.
Hillebrand, H., E. T. Borer, M. E. Bracken, B. J. Cardinale, J. Cebrian, E. E. Cleland, J. J. Elser, D. S. Gruner, W. Stanley Harpole, and J. T. Ngai. 2009. Herbivore metabolism and stoichiometry each constrain herbivory at different
organizational scales across ecosystems. Ecology Letters 12:516-527. Hoekman, D. 2011. Relative importance of top-down and bottom-up forces in food
webs of Sarracenia pitcher communities at a northern and a southern site. Oecologia 165:1073-1082.
Ingram, T., R. Svanback, N. J. Kraft, P. Kratina, L. Southcott, and D. Schluter. 2012. Intraguild predation drives evolutionary niche shift in threespine stickleback. Evolution 66:1819-1832.
16 IPCC. 2014. Climate change 2014: synthesis report. Contribution of working groups I,
II and III to the Fifth Assessment Report of the Intergovernmental Panel on Climate Change Geneva, Switzerland.
Jones, S. E., C. T. Solomon, and B. C. Weidel. 2012. Subsidy or subtraction: how do terrestrial inputs influence consumer production in lakes? Freshwater Reviews
5:37-49.
Karlsson, J., P. Bystrom, J. Ask, P. Ask, L. Persson, and M. Jansson. 2009. Light limitation of nutrient-poor lake ecosystems. Nature 460:506-509.
Kim, G. W., and D. R. DeVries. 2000. Effects of a selectively reduced gizzard shad population on trophic interactions and age-0 fishes in Walker County Lake, Alabama. North American Journal of Fisheries Management 20:860-872. Knapp, R. A. 1996. Non-native trout in natural lakes of the Sierra Nevada: an analysis
of their distribution and impacts on native aquatic biota. Pages 363-407 in
Sierra Nevada ecosystem project: final report to Congress.
Knapp, R. A., and K. R. Matthews. 2000. Non-native fish introductions and the decline of the mountain yellow-legged frog from within protected areas. Conservation Biology 14:428-438.
Knapp, R. A., K. R. Matthews, and O. Sarnelle. 2001. Resistance and resilience of apline lake fauna to fish introductions. Ecological Monographs 71:401-421. Larsen, S., T. O. M. Andersen, and D. O. Hessen. 2011. Climate change predicted to
cause severe increase of organic carbon in lakes. Global Change Biology
17:1186-1192.
Latta, L. C., D. L. Fisk, R. A. Knapp, and M. E. Pfrender. 2010. Genetic resilience of Daphnia populations following experimental removal of introduced fish. Conservation Genetics 11:1737-1745.
Lopez-Urrutia, A., E. San Martin, R. P. Harris, and X. Irigoien. 2006. Scaling the metabolic balance of the oceans. Proceedings of the National Academy of Sciences 103:8739-8744.
Mazumder, A., W. D. Taylor, D. J. McQueen, and D. R. S. Lean. 1990. Effects of fish and plankton and lake temperature and mixing depth. Science 247:312-315. Melack, J. M., J. L. Stoddard, and C. A. Ochs. 1985. Major ion chemistry and
sensitivity to acid precipitation of Sierra Nevada lakes. Water Resources Research 21:27-32.
17 Moore, M. V., and C. L. Folt. 1993. Zooplankton body size and community structure:
effects of thermal and toxicant stress. Trends in Ecology and Evolution 8 :178-183.
Moore, M. V., C. L. Folt, and R. S. Stemberger. 1996. Consequences of elevated temperatures for zooplankton communities in temperate lakes. Archiv für Hydrobiologie 135:289-319.
Murren, C. J., J. R. Auld, H. Callahan, C. K. Ghalambor, C. A. Handelsman, M. A. Heskel, J. G. Kingsolver, H. J. Maclean, J. Masel, and H. Maughan. 2015. Constraints on the evolution of phenotypic plasticity: limits and costs of phenotype and plasticity. Heredity 115:293-301.
O'Connor, M. I., B. Gilbert, and C. J. Brown. 2011. Theoretical predictions for how temperature affects the dynamics of interacting herbivores and plants. The American Naturalist 178:626-638.
Pace, M. L., J. J. Cole, S. R. Carpenter, and J. F. Kitchell. 1999. Trophic cascades revealed in diverse ecosystems. Trends in ecology & evolution 14:483-488. Piovia-Scott, J., S. Sadro, R. A. Knapp, J. Sickman, K. L. Pope, and S. Chandra. 2016.
Variation in reciprocal subsidies between lakes and land: perspectives from the mountains of California. Canadian Journal of Fisheries and Aquatic Sciences
73:1691-1701.
Polis, G. A., and D. R. Strong. 1996. Food web complexity and community dynamics. The American Naturalist 147:813-846.
Sadro, S., C. E. Nelson, and J. M. Melack. 2011. The influence of landscape position and catchment characteristics on aquatic biogeochemistry in high-elevation lake-chains. Ecosystems 15:363-386.
Sarnelle, O., and R. A. Knapp. 2005. Nutrient recycling by fish versus zooplankton grazing as drivers of the trophic cascade in alpine lakes. Limnology and Oceanography 50:2032-2042.
Schindler, D. W., and B. R. Parker. 2002. Biological pollutants: alien fishes in mountain lakes. Water, Air and Soil Pollution: Focus 2:379-397. Schmidt, I. K., S. Jonasson, G. R. Shaver, A. Michelsen, and A. Nordin. 2002.
Mineralization and distribution of nutrients in plants and microbes in four arctic ecosystems: responses to warming. Plant and Soil 242:93-106. Shurin, J. B., E. T. Borer, E. W. Seabloom, K. Anderson, C. A. Blanchette, B.
Broitman, S. D. Cooper, and B. S. Halpern. 2002. A cross-‐ecosystem comparison of the strength of trophic cascades. Ecology Letters 5:785-791.
18 Shurin, J. B., J. L. Clasen, H. S. Greig, P. Kratina, and P. L. Thompson. 2012.
Warming shifts top-down and bottom-up control of pond food web structure and function. Philosophical Transactions of the Royal Society B 367 :3008-3017.
Shurin, J. B., and E. W. Seabloom. 2005. The strength of trophic cascades across ecosystems: predictions from allometry and energetics. Journal of Animal Ecology 74:1029-1038.
Sih, A., D. I. Bolnick, B. Luttbeg, J. L. Orrock, S. D. Peacor, L. M. Pintor, E. Preisser, J. S. Rehage, and J. R. Vonesh. 2010. Predator-prey naïveté, antipredator behavior, and the ecology of predator invasions. Oikos 119:610-621.
Stevens, C. J., E. M. Lind, Y. Hautier, W. S. Harpole, E. T. Borer, S. Hobbie, E. W. Seabloom, L. Ladwig, J. D. Bakker, and C. Chu. 2015. Anthropogenic nitrogen deposition predicts local grassland primary production worldwide. Ecology
96:1459-1465.
Strayer, D. L. 2010. Alien species in fresh waters: ecological effects, interactions with other stressors, and prospects for the future. Freshwater Biology 55:152-174. Strecker, A. L., T. P. Cobb, and R. D. Vinebrooke. 2004. Effects of experimental
greenhouse warming on phytoplankton and zooplankton communities in fishless alpine ponds. Limnology and Oceanography 49:1182-1190. Terborgh, J., and J. A. Estes. 2010. Trophic cascades: predators, prey, and the
changing dynamics of nature. Island Press, Washington DC.
Uszko, W., S. Diehl, G. Englund, and P. Amarasekare. 2017. Effects of warming on predator-prey interactions - a resource-based approach and a theoretical synthesis. Ecology Letters 20:513-523.
Vasseur, D. A., and K. S. McCann. 2005. A mechanistic approach for modeling temperature-‐dependent consumer-‐resource dynamics. The American Naturalist
166:184-198.
Vinebrooke, R. D., K. L. Cottingham, M. S. J. Norberg, S. I. Dodson, S. C. Maberly, and U. Sommer. 2004. Impacts of multiple stressors on biodiversity and ecosystem functioning: the role of species co-tolerance. Oikos 104:451-457. Vitousek, P. M., and R. W. Howarth. 1991. Nitrogen limitation on land and in the sea:
how can it occur? Biogeochemistry 13:87-115.
Walther, G. R., S. Berger, and M. T. Sykes. 2005. An ecological 'footprint' of climate change. Proceedings of the Royal Society B 272:1427-1432.
19 Williamson, C. E., D. P. Morris, M. L. Pace, and O. G. Olson. 1999. Dissolved
organic carbon and nutrients as regulators of lake ecosystems: Resurrection of a more integrated paradigm. Limnology and Oceanography 44:795-803. Yoshida, T., L. E. Jones, S. P. Ellner, G. F. Fussmann, and N. G. Hairston. 2003.
Rapid evolution drives ecological dynamics in a predator-prey system. Nature
424:303-306.
Zuppinger-Dingley, D., B. Schmid, J. S. Petermann, V. Yadav, G. B. De Deyn, and D. F. Flynn. 2014. Selection for niche differentiation in plant communities
20 CHAPTER 1
29 Chapter 1, in full, is a reprint of the material as it appears in: Symons, C.S. and J.B. Shurin. 2016. Climate constrains lake community and ecosystem responses to introduced predators. Proceedings of the Royal Society B 283: 20160825. The dissertation author is the primary investigator and author of this paper.
Appendix 1A
The relationship between elevation and other variables of interest
Comparisons along elevation gradients are a common approach for testing hypotheses about the effect of temperature on biological systems among locations that have access to the same regional species pool. We tested for correlations between fish presence, and temperature with physical variables (area and depth) and water
chemistry (conductivity, pH, alkalinity, total phosphorus [TP], total Kjeldahl nitrogen [TKN], and dissolved organic carbon [DOC]) (Table 1A.1). We were not able to measure total phosphorus, which was always below the detection limit of our analytical methods (http://anlab.ucdavis.edu/).
Most physical and chemical variables did not show patterns of association with the presence of stocked fish populations (Table 1A.1). However, lakes with fish had higher conductivity (Figure 1A.1), although this relationship is not significant when the outlier with the highest conductivity was removed. Lakes with fish also had higher pH (Figure 1A.1). A likely explanation is that these lakes had higher productivity due to fish predation on zooplankton, as shown in Yosemite lakes by Sarnelle and Knapp (2005) resulting in increased pH. It is therefore unlikely that the effects of fish on community or ecosystem structure detected in our analyses were related to spurious correlations with physical or chemical variables.
30 Other than temperature, the only variable correlated with elevation was
dissolved organic carbon (DOC) (Figure 1A.1). DOC was low at high elevation, particularly above tree line, where input of terrestrial vegetation was low. DOC affects communities of both consumers and producers by attenuating UV radiation and fueling microbial production that can sustain zooplankton (Hessen and Anderson 1990). In addition, DOC is likely to increase along with higher temperatures due to accelerated decomposition in warmer soils.
To determine if elevation was acting on response variables more strongly through temperature or DOC we use structural equation models (SEMs). We did this separately for both lakes that contained fish and lakes that are fishless. We used log-transformed data, to ensure all relationships were linear. We compared linear models to models including a squared term using AICc, and all relationships were best modeled using a linear function. We fit our SEM by fixing the variance of each exogenous variable to 1, which means we were not estimating variance for each variable, and instead accepting the variance of the measured variable. We chose this due to low sample size and our goal of estimating path parameters. We used fish status as a grouping variable, and compared models using log-likelihood tests where each path coefficient was either same, or allowed to vary between the fish and fishless group. We fit the model using the function sem() in the lavaan package in R (Rosseel 2012). For both benthic production and litter decomposition we found that temperature was the only significant predictor (Figure 1A.2), therefore we used temperature as the predictor variable for further analysis.
31 To show the way that fish and elevation influenced zooplankton species
composition, we completed a permutational multivariate analysis of variance using Bray-Curtis community dissimilarity. We found that both fish and elevation had a significant effect on zooplankton community composition, and the interaction between fish and elevation was marginally significant (Figure 1A.3). To plot these results, we completed a redundancy analysis (RDA; Figure 1A.3).
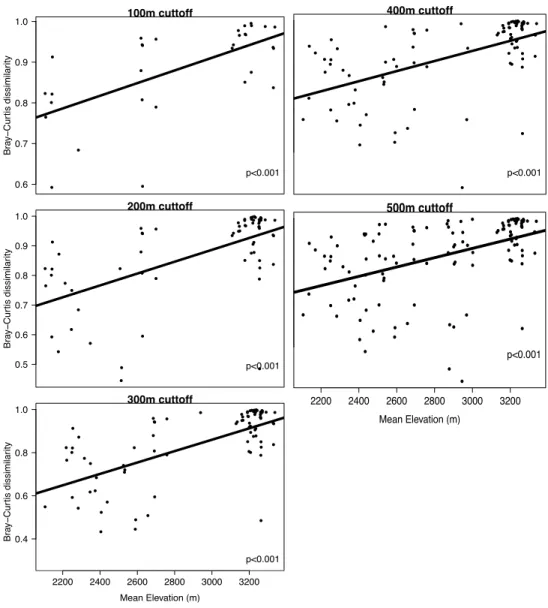
Finally, we wanted to determine if the effect of fish on community composition varied with elevation. The Bray-Curtis dissimilarity of zooplankton communities from all pairwise comparisons of lakes where one contained fish and one was fishless was regressed against the mean elevation of the two lakes. We found that fish and fishless lakes had entirely distinct zooplankton communities in high elevation lakes, but converged in composition at lower elevation (Figure 1A.3). However, we wanted to determine if this result was partially due to the pseudoreplication of using all pairwise comparisons. To check this, we used pairs of lakes that were within a certain elevational range (100m, 200m, 300m, 400m and 500m) to reduce the number of comparisons. We found that our original result was consistent for all cutoffs (Figure 1A.4).
32 Table 1A.1: p-values of ANOVAs testing the effects of elevation
and fish presence on physical and chemical lake variables
Elevation Fish E*F
Temperature (C) <0.001* 0.28 0.03* Area (ha) 0.63 0.14 0.89 Depth (m) 0.33 0.37 0.94 Conductivity (µS cm-1) 0.81 0.01* 0.82 pH 0.09 <0.01* 0.11 TKN (mg L-1) 0.89 0.82 0.60 DOC (mg L-1) <0.01* 0.19 0.59 Alkalinity (ppm) 0.16 0.06 0.11
33
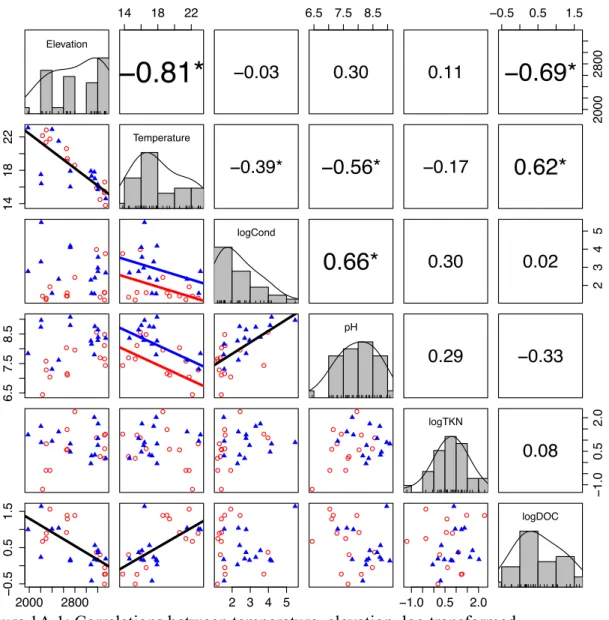
Figure 1A.1: Correlations between temperature, elevation, log transformed
conductivity, pH, log-transformed TKN and log-transformed DOC. Histograms along the diagonal represent the distribution of the variable. Numbers in the top right panels are the correlation coefficients, significant is denoted * with a p value <0.05 of a Pearson correlation test. Panels on the bottom right show the relationship between the variables. Lakes with fish are represented by blue triangles and fishless lakes are represented by red circles. Black lines are present on plots that have a significant correlation. Separate blue (fish lakes) and red (fishless lakes) lines are present when there was a significant fish effect.
Elevation 14 18 22
−
0.81*
−0.03 6.5 7.5 8.5 0.30 0.11 −0.5 0.5 1.5 2000 2800−
0.69*
14 18 22 Temperature −0.39*−
0.56*
−0.170.62*
logCond0.66*
0.30 2 3 4 5 0.02 6.5 7.5 8.5 pH 0.29 −0.33 logTKN − 1.0 0.5 2.0 0.08 2000 2800 − 0.5 0.5 1.5 2 3 4 5 −1.0 0.5 2.0 logDOC34
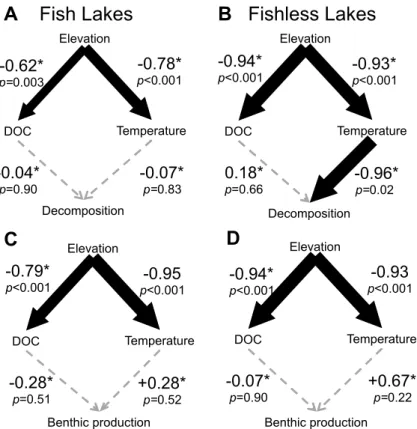
Figure 1A.2: The results of the SEM for (A, C) lakes with fish and (B, D) lakes
without fish. (A, B) show results of the SEM for litter decomposition, and (C, D) show results for the benthic production. The width of the arrows are scaled to the
standardized coefficients which are also reported with the corresponding p-values next to each arrow. Significant relationships are shown in black, while non-significant relationships are shown in grey. * represents path coefficients that are significantly different between fish and fishless lakes.
Elevation DOC Temperature Decomposition -0.62* p=0.003 -0.78* p<0.001 -0.07* p=0.83 -0.04* p=0.90 Elevation DOC Temperature Decomposition A Fish Lakes -0.94* p<0.001 -0.93* p<0.001 -0.96* p=0.02 0.18* p=0.66 B Fishless Lakes Elevation DOC Temperature Benthic production -0.94* p<0.001 -0.93 p<0.001 +0.67* p=0.22 -0.07* p=0.90 Elevation DOC Temperature Benthic production C -0.79* p<0.001 p-0.95 <0.001 +0.28* p=0.52 -0.28* p=0.51 D
35
Figure 1A.3:A RDA of the zooplankton community data. The percent of variation explained by each axis is in parentheses. Black triangles are the site scores for lakes with fish, and open circles are site scores for fishless lakes. Black arrows represent the environmental loadings, and blue arrows represent species loadings. Only species loadings greater than 0.1 were included for clarity. The species included are: Daphnia dentifera (dden), Diaphanosoma brachyurum (dbra), Holopedium gibberum (hgib),
Eucyclops agilis (eagi), calanoid copepidid (cac), Keratella sp. (ker) and Bosmina longirostris (bos). The names of the taxa are scaled according to their body size.
−0.5 0.0 0.5 1.0 − 0.5 0.0 0.5 1.0 RDA 1 (8.6%) RD A 2 (6%) Fish Temp F: p=0.001* T: p=0.001* F*T: p=0.054 bos
cac
dden
dbra eagihgib
ker36
Figure 1A.4:The Bray-Curtis dissimilarity of zooplankton communities in fish-fishless pairs of lakes as a function of the mean elevation of the lakes. Pairs of lakes were used if they were within a certain elevational range of each other. The cutoff used is shown at the top of each plot. p-values represent linear regressions.
References
Hessen, D. O., and T. Andersen. 1990. Bacteria as a source of phosphorus for zooplankton. Hydrobiologia 206:217-223.
Rosseel, Y. 2012. lavaan: An R Package for Structural Equation Modeling. Journal of Statistical Software 48:1-36. 0.6 0.7 0.8 0.9 1.0 100m cuttoff Br a y − Cur tis dissimilar ity p<0.001 0.5 0.6 0.7 0.8 0.9 1.0 200m cuttoff Br a y − Cur tis dissimilar ity p<0.001 0.4 0.6 0.8 1.0 300m cuttoff Br a y − Cur tis dissimilar ity p<0.001 0.4 0.6 0.8 1.0 400m cuttoff Br a y − Cur tis dissimilar ity p<0.001 2200 2400 2600 2800 3000 3200 0.4 0.6 0.8 1.0 500m cuttoff Mean Elevation (m) Br a y − Cur tis dissimilar ity p<0.001 0.6 0.7 0.8 0.9 1.0 100m cuttoff Br a y − Cur tis dissimilar ity p<0.001 0.5 0.6 0.7 0.8 0.9 1.0 200m cuttoff Br a y − Cur tis dissimilar ity p<0.001 0.4 0.6 0.8 1.0 300m cuttoff Br a y − Cur tis dissimilar ity p<0.001 0.4 0.6 0.8 1.0 400m cuttoff Br a y − Cur tis dissimilar ity p<0.001 2200 2400 2600 2800 3000 3200 0.4 0.6 0.8 1.0 500m cuttoff Mean Elevation (m) Br a y − Cur tis dissimilar ity p<0.001 0.6 0.7 0.8 0.9 1.0 100m cuttoff Br a y − Cur tis dissimilar ity p<0.001 0.5 0.6 0.7 0.8 0.9 1.0 200m cuttoff Br a y − Cur tis dissimilar ity p<0.001 0.4 0.6 0.8 1.0 300m cuttoff Br a y − Cur tis dissimilar ity p<0.001 0.4 0.6 0.8 1.0 400m cuttoff Br a y − Cur tis dissimilar ity p<0.001 2200 2400 2600 2800 3000 3200 0.4 0.6 0.8 1.0 500m cuttoff Mean Elevation (m) Br a y − Cur tis dissimilar ity p<0.001 0.6 0.7 0.8 0.9 1.0 100m cuttoff Br a y − Cur tis dissimilar ity p<0.001 0.5 0.6 0.7 0.8 0.9 1.0 200m cuttoff Br a y − Cur tis dissimilar ity p<0.001 0.4 0.6 0.8 1.0 300m cuttoff Br a y − Cur tis dissimilar ity p<0.001 0.4 0.6 0.8 1.0 400m cuttoff Br a y − Cur tis dissimilar ity p<0.001 2200 2400 2600 2800 3000 3200 0.4 0.6 0.8 1.0 500m cuttoff Mean Elevation (m) Br a y − Cur tis dissimilar ity p<0.001
37 Sarnelle, O., and R. A. Knapp. 2005. Nutrient recycling by fish versus zooplankton
grazing as drivers of the trophic cascade in alpine lakes. Limnology and Oceanography 50:2032-2042
38 CHAPTER 2
Gone but not forgotten: Non transitive effects of fish addition and removal on mountain lake plankton communities
Abstract
The impacts of global changes on ecosystems are shaped by evolution of organismal traits, plasticity and turnover in community structure. To test if phenotypic selection within and among species alters community responses to environmental change, we conducted a plankton community transplant experiment. We exposed communities that assembled and evolved at different elevations in the presence or absence of fish to different elevations and fish predation. Local adaptation predicts highest fitness in home environments, but instead we found that past selection by fish resulted in non-transitive effects of predator addition and removal. Daphnia pulicaria
that evolved with fish reached greater biomass under fishless conditions than those from fishless lakes, resulting in greater zooplankton community biomass and average size. Eco-evolutionary effects were observed in response to predation but not
elevation. These results indicate phenotypic evolution and community compositional turnover over broad environmental gradients can determine ecosystem responses to the extirpation of predators.
Keywords
resilience; life-history evolution; local adaptation; temperature; climate change; Daphnia pulicaria; elevation; historical contingency
39
Introduction
To persist under climate change, populations and communities must ‘migrate, acclimate, adapt or die’ (Gienapp et al. 2008). Adaptation can maintain population fitness in the face of environmental change by altering the frequency of phenotypes in response to selection (Bell and Gonzalez 2009). These shifts in species composition can stabilize ecosystem properties (e.g., community biomass, ecosystem function) against environmental change if sites are colonized by species and/or genotypes that possess traits that match the new conditions according to the “spatial insurance” hypothesis (Bell and Gonzalez 2011, Thompson and Shurin 2012, Symons and Arnott 2013). The ecological impact of environmental change therefore depends on
phenotypic variability within and among species, and the distribution of this
variability within local communities and across broad landscapes. The time scales of experimental studies of ecosystem response to environmental change are typically too short for ecological or evolutionary shifts to occur (Alexander et al. 2016; but see Zuppinger-Dingley 2014 for an example), thus the contributions of phenotypic selection within and among species to community resilience are largely unknown.
One mechanism by which ecological and evolutionary history influences community responses to environmental change is through local adaptation of populations to their environment. For example, prey populations sympatric with predators often evolve resistance to predation, which may dampen cascading effects of predation on lower trophic levels (Ingram et al. 2012, Martin et al. 2015). This type of standing genetic variation, including via phenotypic plasticity, throughout a species’ range may be an important source of resilience to environmental change (Jump et al.
40 2009, Lande 2009). Adaptation to the new environment can allow species to persist during environmental change, resulting in a more stable community structure.
Evolutionary processes are generally expected to maintain fitness under environmental change. However, local adaptation may also produce surprising population responses to novel forms of selection (Handelsman et al. 2013). Selection in one environment may result in traits that affect fitness under anomalous conditions that a population has never encountered. For example, under ‘prodigal son’ dynamics an environmental change that increases fitness (e.g., higher CO2 for plants, predator
removal) may transiently increase local abundance before it returns to a similar “pre-disturbance” abundance, despite the environment remaining in its new state (Collins 2016). One mechanism to explain this decline in abundance is a trade-off between the intrinsic rate of increase (r) and competitive ability (Gill 1974). Populations with an increased r may be invaded by slower growing, more competitive genotypes over time. For instance, Schaum and Collins (2014) found that Chlamydomonas that were exposed to high CO2 initially increased cell division rates, but over time this rate
decreased to the cell-division rate of their ancestors in low CO2, likely to reduce
damage associated with fast cell division rates. As a result, adaptive evolutionary responses may buffer populations and communities against changing environmental conditions, however the capacity of most populations for evolutionary rescue is largely unknown.
To test how evolutionary and ecological history influence community responses to environmental change, we conducted a transplant experiment that exposed plankton communities from mountain lakes to two ecologically relevant
41 stressors: an elevational gradient in climate including temperature, and predation by a non-native fish. Our experiment is a community-level analog to a common garden, designed to measure the impact of the environment and genotype on the phenotype of an organism. We established communities of aquatic organisms (phytoplankton, zooplankton, bacteria and benthos) originating from four types of lakes in the California Sierra Nevada mountains: all factorial combinations of alpine and sub-alpine elevations, with and without introduced trout predators. The source lakes vary in temperature along an elevational gradient, and in history of fish stocking, thus some communities have evolved and assembled in the presence of fish. We grew these four types of plankton communities at three elevations crossed with the presence of fish predators in the experimental pond mesocosms. Our goal was to test the hypothesis that evolutionary and ecological history of elevation and fish predation would affect the contemporary population, community and ecosystem level responses of plankton to these same perturbations.
Materials and Methods Experiment overview
To test the hypothesis that phenotypic selection within and among species buffers ecosystems to environmental changes, we conducted a plankton community transplant experiment across elevation in mesocosms (Figure 2.1). We collected
communities of plankton and micro-organisms from lakes that varied in their
environment due to elevation, and history of fish stocking. Thus, the treatments were:
• History of elevation (HElev): source community elevation (2 levels,
42
• History of fish (HFish): source community fish presence (2 levels, +/-)
• Experimental elevation treatment (EElev): transplant elevation (3 levels,
montane [1200m], sub-alpine [2149m] and alpine [3093m])
• Experimental fish treatment (EFish): fish presence in the transplant
environment (2 levels, +/-)
This experimental design allows us to partition the variance in the response of community and population variables to the present and historical environment and their interaction. The response of plankton species and aggregate community metrics to the experimental treatments was modeled as a function of the current ecological conditions in the experiment (E), the ecological history of the community from which they originated (H), and the interaction between the two (E*H), where E = EFish + EElev
+ EFish*EElev and H = HFish + HElev + HFish*HElev. EFish is the presence of fish in the
mesocosms, EElev is the elevation of the experimental environment, and EFish*EElev is
the interactive effects of contemporary conditions. The conditions in the community of origin are represented by history (H), where the presence or absence of fish predators in the source community is HFish, and its elevation is HElev. Each term represents a
treatment or interaction in the mixed effects model table. The two-way interaction terms E*H = EFish*HFish + EFish*HElev + EElev*HFish + EElev*HElev represents the eco-evo
interaction, or the impact of selection history of the community on the outcome of contemporary ecological interactions.
Experimental set-up
We established mesocosm arrays at three elevations, located at three UC Natural Reserves (White Mountain [WM], 3093m, 37.499044, -118.171597; Sierra