NBER WORKING PAPER SERIES
THE EVOLUTION OF INCOME CONCENTRATION IN JAPAN, 1886-2002:
EVIDENCE FROM INCOME TAX STATISTICS
Chiaki Moriguchi
Emmanuel Saez
Working Paper 12558
http://www.nber.org/papers/w12558
NATIONAL BUREAU OF ECONOMIC RESEARCH
1050 Massachusetts Avenue
Cambridge, MA 02138
October 2006
We thank seminar participants at the NBER Japan Meeting, Berkeley University, Columbia University,
Harvard University US-Japan Relations Program, University of Tokyo, Hitotsubashi University, Keio
University, and Osaka University for helpful discussions. In particular, we are grateful to Joseph Ferrie,
Laura Hein, Charles Horioka, Yasushi Iwamoto, Ryo Kambayashi, Anil Kashyap, Lawrence Katz,
Wojciech Kopczuk, Ryoshin Minami, Joel Mokyr, Fumio Ohtake, Tetsuji Okazaki, Makoto Saito,
Osamu Saito, Toshiaki Tachibanaki, Gail Triner, David Weinstein, and Hiroshi Yoshikawa for their
comments and suggestions. Financial support from NSF Grant SES-0134946, the Alfred P. Sloan Foundation,
and the Abe Fellowship Program is gratefully acknowledged. The views expressed herein are those
of the author(s) and do not necessarily reflect the views of the National Bureau of Economic Research.
© 2006 by Chiaki Moriguchi and Emmanuel Saez. All rights reserved. Short sections of text, not to
exceed two paragraphs, may be quoted without explicit permission provided that full credit, including
© notice, is given to the source.
The Evolution of Income Concentration in Japan, 1886-2002: Evidence from Income Tax
Statistics
Chiaki Moriguchi and Emmanuel Saez
NBER Working Paper No. 12558
October 2006
JEL No. H24,N15
ABSTRACT
This paper studies the evolution of income concentration in Japan from 1886 to 2002 by constructing
long-run series of top income shares and top wage income shares, using income tax statistics. We find
that (1) income concentration was extremely high throughout the pre-WWII period during which the
nation underwent rapid industrialization; (2) a drastic de-concentration of income at the top took place
in 1938-1945; (3) income concentration has remained low throughout the post-WWII period despite
the high economic growth; and (4) top income composition in Japan has shifted dramatically from
capital income to employment income over the course of the 20th century. We attribute the precipitous
fall in income concentration during WWII primarily to the collapse of capital income due to wartime
regulations and inflation. We argue that the change in the institutional structure under the occupational
reforms made the one-time income de-concentration difficult to reverse. In contrast to the sharp increase
in wage income inequality observed in the United States since 1970, the top wage income shares in
Japan have remained remarkably stable over the recent decades. We show that the change in technology
or tax policies alone cannot account for the comparative experience of Japan and the United States.
Instead we suggest that institutional factors such as corporate governance and union structure are important
determinants of wage income inequality.
Chiaki Moriguchi
Department of Economics
Northwestern University
2001 Sheridan Road
Evanston, IL 60208-2600
and NBER
chiaki@northwestern.edu
Emmanuel Saez
University of California
549 Evans Hall #3880
Berkeley, CA 94720
and NBER
saez@econ.berkeley.edu
1. Introduction
Following the seminal work by Kuznets (1955), economists have devoted much effort to analysing the evolution of income inequality during the process of economic development. This analysis is also central for the policy debate: The left argues that concentration of wealth biases the political process in favor of the rich that in turn perpetuates the inequality, calling for progressive taxation as a necessary counter-measure. The right views concentration of wealth as a natural if not necessary outcome of economic growth. Thus, progressive taxation may redistribute income and reduce wealth concentration, but may also reduce economic growth by depressing entrepreneurship and capital accumulation incentives.
To cast better light on the debate, it is critical to understand the empirical relationship between economic growth and income distribution. To this end, economic historians have studied changes in income and wealth inequality over centuries in leading industrial nations such as Britain, the United States, or France (e.g., Soltow (1968, 1969); Williamson and Lindert (1980); Williamson (1985); Lindert (1986, 2000); Piketty, Postel-Vinay, and Rosenthal (2006)). Historical studies, however, were often hampered by the absence of long-run homogeneous series of income and wealth. Recently, a number of studies have used income tax statistics to generate such series for several European and Anglo-Saxon countries (see Atkinson and Piketty (2006) and Piketty (2005)). Although these studies focus on the shares of top income groups due to the nature of the data, they provide the first consistent series of income inequality measure in these countries that cover most of the 20th century.
The objective of this paper is to construct the long-run top income shares series for Japan and evaluate Japan’s experience from historical and comparative perspectives. The data for Japan are of particular interest, not only because Japan is the world’s second largest economy after the United States today, but also because its process of industrialization was compressed within a very short time period. After the 1868 Meiji Restoration, modern economic growth in Japan took off in the 1880s, and the nation underwent three phases of industrial revolution – from textiles, heavy industries, to high-tech industries – within less than 100 years. To illustrate this point, Figure 1 depicts the real GDP per capita in Japan, 1820-2004, against that in the United States, 1790-2004. Japan’s GDP per capita in 1890 was at the level of U.S. GDP per capita in 1790, or about $1,200 in 2004 dollars which is roughly comparable to the GDP per capita of the poorest countries in the world today. By 1970, however, Japan caught up with other developed
countries, and now has a GDP per capita only slightly lower than the United States. Real GDP per capita in Japan grew at the annual compound rate of 2.7% in 1886-1940 and at 4.7% in 1948-2002. Because the Japanese government introduced a comprehensive income tax system in 1887 – a remarkably early date by international standards – we can trace the evolution of income concentration during the entire process of industrialization using the Japanese tax statistics.1 As the top income shares series compiled so far for the Western countries span only part of their industrialization process, the Japanese data provide us with a unique opportunity to examine the relationship between income concentration and modern economic growth. To explore the causes of dynamic changes in income concentration and provide additional evidence, we also compile the series of top income composition, marginal tax rates, top estates and its composition, and top wage income shares, all based on tax statistics.
From our data, three main findings follow. First, income concentration at the top 1% income group in Japan was extremely high throughout the pre-WWII period with some short-term fluctuations. Top income shares declined abruptly and precipitously during WWII and remained remarkably low for the rest of the 20th century. Our data thus indicate that the defining event for the evolution of income concentration in Japan was a historical accident, namely the Second World War, which accompanied large-scale government intervention, inflation, and war destruction.
Second, using income composition data, we show that the dramatic fall in income concentration at the top was primarily due to the collapse of capital income during WWII. Evidence from estate tax statistics confirms the drastic decline in top wealth holdings during and immediately after WWII. We argue that the transformation of the institutional structure under the postwar occupational reforms, such as the abolishment of primogeniture, the establishment of progressive tax, and the changes in corporate governance and union structure, prevented the re-concentration of income. Importantly, such redistributive government policies, which likely hindered the “natural” process of capital accumulation, were accompanied by one of the most impressive and sustained economic growths in modern history.
Third, according to our wage income data, wage income concentration also fell sharply during WWII. In sharp contrast to the United States where wage income inequality has increased dramatically since the 1970s, top wage income shares in Japan have
1 By contrast, comprehensive income tax was instituted in Prussia in 1891, in the United Kingdom in 1909, in
the United States in 1913, and in France in 1914, times at which the industrial revolution was already well underway in those countries.
remained remarkably low in the last three decades. As employment income became a major component of the top income after WWII, in addition to the collapse of capital income, we identify the fall in wage income inequality as an important reason for the permanent decline in income concentration. Comparing the Japanese and U.S. data in more detail, we find that technological progress (i.e., skill-biased technological change) or tax incentives (i.e., the reduction in marginal income tax rates) alone cannot account for the divergent experience of the two countries. Instead we suggest institutional factors, most notably corporate governance and internal labor markets, as important determinants of wage inequality.
We draw two broader lessons from Japan’s experience. First, our data indicate that Japan achieved two “economic miracles” before and after WWII under very different socio-economic conditions, casting immediate doubts on any theory that predicts simple correlations between economic growth and income inequality.2 Second, it was the exogenous shock of WWII, rather than endogenous economic or political process, that transformed Japan into more equitable society. Consistent with the experience in many developing countries today, it underscores the difficulty of undertaking drastic redistributive policies in the absence of major impetus.
The rest of the paper is organized as follows. Section 2 summarizes the preceding literature on income inequality in Japan. Section 3 describes the data and estimation methods. Section 4 presents our findings from the top income shares series, 1886-2002. Section 5 investigates the causes of the observed changes in income concentration, using the top income composition and top estates series. Section 6 presents the top wage income shares series, 1929-2002. Section 7 provides comparative perspectives and concludes. The detail description of our data and methods, as well as a complete set of results, are presented in Appendix.
2. Literature Review
By international standards, modern Japan has been widely perceived as a society of relatively low income inequality (e.g., Sawyer (1976)). Although comparing income statistics across nations is notoriously difficult and must be interpreted with caution, recent OECD reports (Atkinson et al. (1995); Burniaux et al. (1998)) and Japanese government
2 Our findings lend further support to the view that emphasizes the distinctiveness of the post-WWII economic
systems in Japan (Okazaki and Okuno-Fijiwara (1993); Noguchi (1995); Teranishi (2005)). In stark contrast to the pre-WWII system that operated much like a neo-classical market economy, the post-WWII system seems to have facilitated high economic growth and low income inequality.
studies (Nishizaki et al. (1998); Kokumin Seikatsukyoku (1999)) together offer a better comparative picture. As Panel A of Table 1 shows, in the mid 1980s, Japan’s Gini coefficient of the distribution of household income before tax and government transfers was one of the lowest among major industrial nations. When we consider the distribution of income after tax and government transfers, as one may expect, Northern European welfare states ranked below Japan (see Panel B). Even though the income inequality in Japan rose somewhat during the asset price appreciation in the late 1980s, Japan’s ranking among the OECD countries remained approximately the same in the 1990s (Burniaux et al. (1998)). In other words, one of the distinct characteristics of Japan today is its low income inequality in the absence of government redistribution. When did Japan become a nation of low income inequality? Or has Japan always been the so-called “equal society”?
There is an extensive body of empirical work – albeit published mostly in Japanese – examining Japan’s income distributions during the 20th century.3 The lack of household survey data has been a major obstacle in estimating the income distribution before WWII, however. In the absence of such data, some scholars used income tax statistics.4 Most notably, Shiomi (1933) and Hayakawa (1951) combined national income tax statistics and local income tax records to estimate the income distributions of all households in selected cities and years. Using similar methods and compiling comprehensive local income tax data, Minami (1995, 1998) has recently provided the estimates of the income distribution of all Japanese households in selected years. By contrast, Ono and Watanabe (1976) studied the long-run changes in income inequality during the pre-WWII period, using several indirect measures such as urban-rural and intra-industry wage differentials. They also estimated the Pareto coefficients of the income distributions of high-income earners based on national income tax data and found that the time trends in these coefficients coincided with those indicated by the indirect measures. Otsuki and Takamatsu (1978) calculated the Pareto coefficients from 1887 to 1940 using the average and minimum household incomes based on the Long-term Economic Statistics (Ohkawa et al. (1974)).
For the post-WWII period, several types of survey data became available. Wada (1975) estimated the income distribution in the 1950s combining the Employment Status Survey and the Farm Household Economics Survey. Mizoguchi and Takayama (1984)
3 For a comprehensive survey of income distribution before WWII, see Terasaki (1986); Minami (1995),
Chapter 1. For the post-WWII period, see Mizoguchi and Takayama (1984), Chapter 1; Mizoguchi and Terasaki (1995); Yazawa (2004).
and Mizoguchi and Terasaki (1995) used the People’s Living Conditions Survey to examine the changes in income inequality from 1962 to 1990. The income distribution of Japanese households can be also estimated from the Family Income and Expenditure Survey (e.g., Ohtake (2005)) and the Income Redistribution Survey (e.g., Tachibanaki (2000)). Because these surveys employ disparate sampling methods and income definitions, the resulting estimates of income inequality can differ considerably.
Figure 2 summarizes the long-run changes in income inequality based on the above studies (for simplicity, we use the Gini coefficients to represent their findings).5 Although the Gini coefficients in a given year differ across studies, they display coherent time trends. First, the income inequality in Japan rose sharply from 1890 to 1940. Second, after WWII, income inequality peaked around 1960, declined in the 1960s, and stabilized in the 1970s. Third, the income inequality has been on the rise since 1980, although scholars have disagreed over the extent of the increase. For example, in his recent study, Tachibanaki (1998) has declared Japan as an equal society a “myth,” generating much discussion among scholars, government officials, and the rest of population.6
It is important to note that there is no data between 1940 and 1955. In addition, the Gini coefficients before 1940 and after 1955 in Figure 2 cannot be compared due to major data discontinuity. Nevertheless, general consensus among scholars based on indirect evidence is that the income inequality dropped substantially between 1940 and 1955, presumably due to WWII and post-war occupational reforms (Mizoguchi and Terasaki (1995), p.61). One of the objectives of this study, therefore, is to compile new data that enable us for the first time to compare the level of inequality between the pre- and post-WWII periods and shed better light on the process of the alleged fall in income inequality. Note also that most of the pre-WWII studies provide the estimates only for a handful of years that may or may not be representative data points. Furthermore, since most of the existing studies concern with the income distribution of entire population, we know relatively little about high-income groups.7 In particular, due to the problem of small sample and top coding, household surveys cannot be used for a study of high income earners.
To fill these gaps, we construct continuous and homogeneous series of the top income shares, i.e., the shares of total income accruing to the upper groups of the income distribution, from 1886 to 2002. Although top income shares are not necessarily an ideal
5 Pareto coefficients are converted to Gini coefficients by the formula g=1/(2*p-1) assuming the Pareto Law. 6 Tachibanaki (2005) is an English version of Tachibanaki (1998). See Ohtake (2005) for the debate. 7 For important exceptions, see Yazawa (1992) and Miyamoto and Abe (1995), Chapter 6.
measure of income inequality – as it does not reflect the shape of the bottom 95% of the income distribution – they nonetheless provide valuable information about the degree of income concentration that likely affects entrepreneurial incentives and capital accumulation in a capitalist economy. Finally, because we employ the same methodology used in the recent high income studies presented in Atkinson and Piketty (2006), we can compare our data with that of other industrial nations and offer a comparative historical analysis of income concentration.
3. Data and Methodology
In this section, we describe briefly the nature of data and the methods of estimation. A complete description can be found in Appendix at the end of the paper. Our estimates of top income shares are based on income tax return statistics published annually by the Japanese tax administration since the introduction of national income tax in 1887.8 We define “fiscal year” as the year in which tax returns were processed and tax collected, in contrast to “actual year” in which the income subject to taxation was earned. We identify the correspondence between actual years and fiscal years based on income tax laws and Japan National Tax Administration (1988), which is reported in columns (1) and (2) in Table A0 in Appendix. Typically, the statistics present the number of taxpayers, the amount of income reported by taxpayers, the amount of income tax paid, and the composition of the reported income, all by income brackets.
Income, in our definition, is a gross income before deductions of direct and payroll taxes paid by individuals, but after employers’ payroll taxes and corporate income taxes. It includes all income components reported in tax returns, namely, salaries and wages, unincorporated business income, farm income, self-employment income, dividends, interest, rents, royalties, and other small items. Realized capital gains, however, is excluded from our definition of income for two reasons. First, realized capital gains were not taxable before 1947 in Japan and thus missing from the income tax statistics. Second, in general, realized capital gains form a volatile component of income with large fluctuations and not a steady source of annual income. Thus, in this study, we focus on the series that exclude capital gains.9
8 Japan Ministry of Finance, Tax Bureau, Shuzeikoku Tokei Nenposho, 1887-1945, and Japan National Tax
Administration, Kokuzeikoku Tokei Nenposho, 1946-2002.
Before 1950, the tax unit was “family” defined as a married couple (or a single household head) with cohabitating dependents. Incomes of family dependents in a single household were aggregated for tax purposes. Starting in 1950, the tax unit became “individual,” whereby spouses were taxed separately on their incomes. To produce homogeneous series over the entire period, we estimate top income shares using the individual tax unit. Thus, our top income groups are defined relative to the total number of adults, defined as age 20 and above, in Japan in each year based on official population statistics (reported in column (4) in Table A0). Because of high exemption points, only a small fraction of individuals filed income tax returns before 1947 (reported in column (6) in Table A0). For this reason, our analysis is necessarily restricted to the high end of the income distribution. That is, we can estimate the income share for the entire period of 1886-2002 only within the top 1% income group, while we also provide estimate of the top 5% income share for sub-periods.
As the top tail of the income distribution is well approximated by a Pareto distribution, we estimate the Pareto coefficient for each year using the tabulations of taxpayers by income brackets. We then use simple parametric interpolation methods to estimate the thresholds and average income levels of top income groups. As Table 2 shows, in 2002, the threshold income levels for the top 1% and 0.01% income groups in Japan were $110,000 and $264,000, respectively. The top 0.01% income group in the same year consisted of roughly 10,000 individuals who earned more than $649,000, and their average income was $1.2 million.
We estimate a top income share by dividing the amount of income accruing to a top income group by total personal income computed from National Accounts for 1930-2002 and from Long-Term Economic Statistics (Ohkawa et al. (1974)) for 1886-1929.10 The total and average real incomes per adult from 1886 to 2002 are reported in columns (7) and (8) in Table A0. We convert current income to real income in 2002 yen, using the CPI deflator from Long-Term Economic Statistics (Ohkawa et al. (1967)). Our top income shares estimates are reported in Table A1 in Appendix.
We estimate the composition of income accrued to the top 1% group, using income composition statistics. For years in which composition data are reported by income brackets, we use a Pareto interpolation method to obtain the top 1% estimates. For years in which only aggregate composition data are published, we use these data.
10 Note that estimates for total personal income before 1930 are less reliable than after 1930, introducing
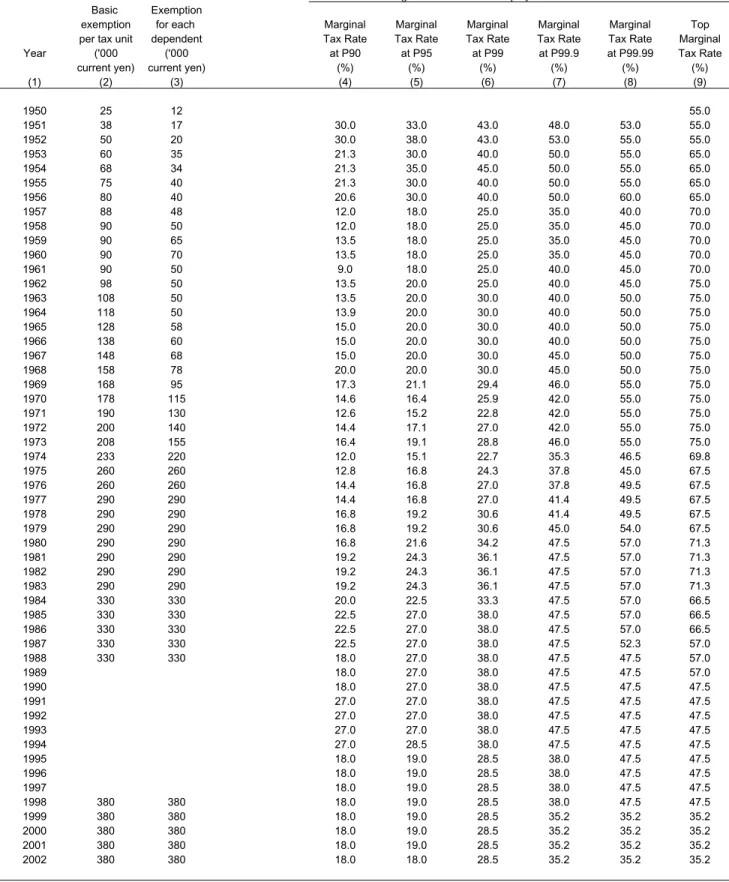
Our top income composition series are reported in Table A2. We also estimate marginal tax rates for the average individual in the top income groups from 1886 to 2002. The estimates are made for an individual with a non-working spouse and two dependent children and include standard deductions but exclude local taxes. The series are reported in Table A3.
Next, we construct top estates series using estate tax return statistics published annually by the tax administration since 1905. Top estate groups are defined relative to the total number of adult deaths in Japan in each year obtained from official population statistics. Due to the difficulty in estimating total assets in Japan, the top estate series are expressed in the level (as opposed to the share) in 2002 yen using the CPI deflator. Our top estates estimates are reported in Table B1 in Appendix.11 We also provide estate composition series, 1926-2002, using aggregate estate composition data, which are presented in Table B2. Because estate compositions are not available by estate brackets, we cannot produce homogenous top estate composition series.
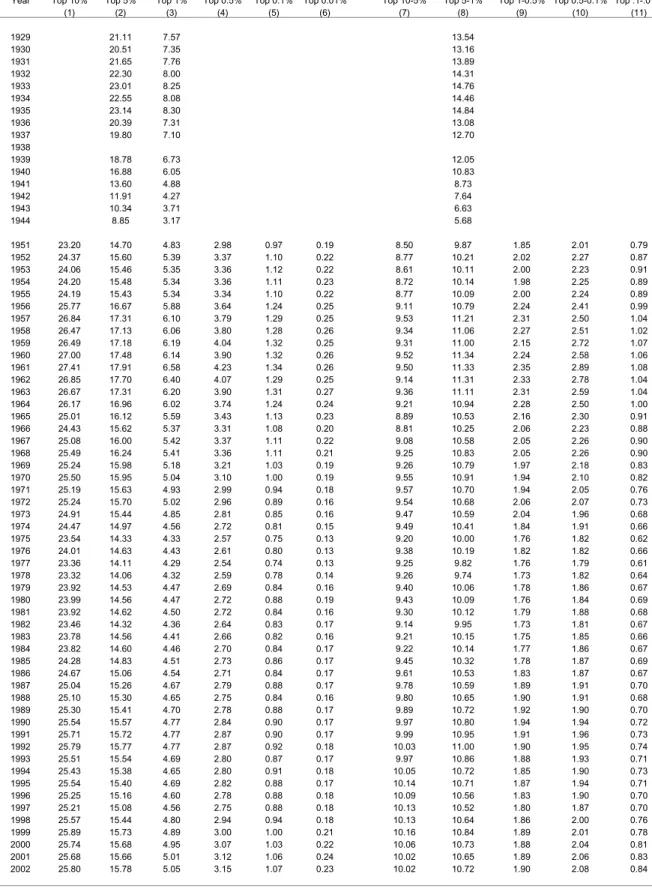
Finally, we compute top wage income shares using the similar methodology. For the post-WWII period, wage income data are compiled from the Survey on Private Wages and Salaries published by the tax administration annually since 1951.12 The survey covers virtually all employees in the private sector but excludes government employees. Wage income in our definition includes wages, salaries, bonuses, and allowances, but exclude non-cash compensation and retirement benefits. Top groups are defined relative to the total number of regular employees in the private sector in Japan. Our estimates of the total wage income denominator are based on total salaries from National Accounts. For the pre-WWII period, we use salary and bonus data reported in the income tax statistics for the fiscal years 1930-1945. Top groups are defined relative to the total number of regular employees in Japan. The total wage income denominators are based on total salaries and wages from National Accounts.13Table C1 in Appendix presents the number of wage income earners and total wage income from 1929 to 2002. Our estimates for top wage income shares for 1929-2002 are reported in Table C2, and marginal tax rates for top wage income earners for 1951-2002 are presented in Table C3 in Appendix.
Over the 116 years of our sample period, there are at least three major tax reforms, in addition to numerous revisions in income and estate tax laws. These changes
11 Due to the difficulty in reconstructing estate statistics for actual years, our top estates for 1905-57 are
imprecisely estimated. See Appendix Section B for a detailed discussion.
12 Japan National Tax Administration, Minkan Kyuyo no Jittai, 1951-2002.
13 Due to the limited data, our estimates for 1929-1944 are based on restrictive assumptions. See Appendix
potentially affect the comparability of our data across years. Therefore, to construct homogeneous series, we make a number of careful adjustments to the original data (see Appendix for a complete description). There are two major challenges in constructing the top income shares series that call for special attention.
First, after the introduction of an extensive withholding system (gensen choshu seido) in 1949, most individuals with only employment or pension income were no longer required to file self-assessed income tax returns. As a result, even though most income earners pay income taxes in Japan, only a minority of taxpayers is required to file a self-assessed tax return. Fortunately, as mentioned above, the Japanese tax administration publishes the wage income statistics from the withholding system that include virtually all wage earners in the private sector. We thus use these data to complement the self-assessed income tax statistics and produce top income shares series.
The second and perhaps more serious issue is tax erosion and evasion, that is, lawful and unlawful under-reporting of income by taxpayers. Because the self-assessed income tax statistics are by definition based on reported income, there is a concern that our data might reflect trends in tax avoidance and evasion rather than true changes in income inequality. For example, compared to wage income that is captured at source, farm income and business income in general are said to be subject to a higher degree of tax evasion. In effort to avoid tax, employers often shift their compensation from cash to perquisites. Most important, in the post-WWII period, all or part of interest and dividend incomes are taxed separately at flat rates and withheld at source (gensen bunri kazei) and missing from comprehensive income tax base. We discuss these problems associated with tax avoidance and evasion in Section 5 and provide sensitivity analysis.
4. Top Income Shares in Japan, 1886-2002 4.1 Historical Background
During the early Meiji period, Japan was predominantly a rural society based on agriculture and handicraft industry. After the fiscal reform that resulted in the Matsukata deflation in 1881-84, the Japanese economy began to modernize and grow rapidly (see Figure 1). Large-scale corporations in modern industries, such as railroads and textiles, were formed for the first time in the late 1880s. As a result, most historians regard 1886 as the starting year of the industrial revolution in Japan (Minami (1981); Miyamoto et al. (1995), Chapter 6). The proportion of employment in agriculture declined from 78% in
1876 to 65% in 1900; and fell further to 51% in 1920, and 42% in 1940 (NRUS (1959). After WWII, it declined even faster from 44% in 1950, to 16% in 1973, and 7.3% in 1995.
To provide an overview of our sample period, Figure 3 depicts the average real income per adult and the CPI in Japan from 1886 to 2002. The average real income more than quadrupled from 1886 to 1938, the peak year in the pre-WWII period. It grew particularly fast from 1887 to the end of Sino-Japanese War (1894-95), during WWI (1914-18), and during the period of military expansion (1932-38). Then the average income declined sharply towards the end of WWII (1939-45) that destroyed much of the nation’s physical and human capital. The two World Wars were accompanied by high inflation. In particular, Japan experienced hyperinflation in 1944-48 during which consumer prices rose by 5,300%. After the postwar U.S. Occupation (1945-52), the average real income recovered quickly, surpassing the 1938 level by 1959. During the so-called high-growth period of 1955-73, real average incomes increased by a factor of six, achieving one of the fastest sustained economic growths in modern history. After the 1973 Oil Crisis, the income grew at a slower pace in 1975-90. Since the collapse of the asset bubble in 1991, the average real income has declined for a decade. Except for the brief period during the Oil Crises, the inflation rate has been stable throughout the post-1950 period in Japan.
4.2 Trends in Top Income Shares
Figure4 reports our estimates of the top 1% income share from 1886 to 2002 and the next 4% (denoted as “top 5-1%”) income share for 1907-24, 1937-38, and 1947-2002. We first focus on the top 1% income share series. Between 1886 and 1938, the top 1% adult population in Japan received as much as 14 to 20% of total personal income. The share, however, fell abruptly and precipitously from 1938 to 1945 from 20% to 6.4%, and remained relatively stable at around 8% throughout the post-WWII period. There are fairly large fluctuations in the top 1% income share before WWII: after a steep fall in 1886-91, it declined temporarily during the Sino-Japanese War (1894-95), the Russo-Japanese War (1904-05), WWI (1914-18), and the Great Depression (1929-31), each time followed by an immediate recovery. In terms of the long-run trend, the top 1% income share was high throughout the initial stage of industrialization in 1886-1913 with no clear positive trend. Similarly, the extraordinary economic growth from 1950 to 1973 was accompanied by little change in the top 1% income share. Finally, despite the recent concerns over rising
income inequality, we observe only a modest increase in the top 1% income share in Japan during the last ten years.
The next 4% income share series displays a substantially different pattern. During the pre-WWII period, although estimates are not available for some years, the share was consistently smaller than the top 1% income share, where the next 4% population received on average about 12% of total income. By contrast, after 1947 it has been consistently and substantially larger than that of the top 1% and rose from 12% to 16% between 1970 and 2000, becoming almost twice as large as the top 1% income share. The most striking difference is that WWII did not have much impact on the next 4% income share. Figure 4 thus suggests that the income de-concentration phenomenon that took place during WWII was limited to within the top 1% income groups.
Figure 5 demonstrates this point further by decomposing the top percentile into three subgroups: the top 0.1%, the next 0.4% (“top 0.5-0.1%”), and the bottom half of the top 1% (“top 1-0.5%”). Although the three series exhibit similar overall patterns, the higher income group experienced the faster and larger fall in their share during WWII. While the share of the top 1-0.5% group declined by 50% (from 4.0% to 2.0%) in 1941-45, for the next 0.4% group it fell by more than 60% (from 6.7% to 2.5%) in 1938-45, and for the top 0.1% group it fell by 80% (from 9.2% to 1.9%) in 1938-45. Our series shows that the fall for the top 0.01% income share is even more dramatic: it collapsed from 3.8% to 0.6% in 1938-45 and has remained around the same level for the rest of the 20th century (see Table A1 in Appendix and Figure 9). Note also that, for the top 0.1% and 0.01% income groups, their shares show a positive trend before WWII, indicating gradual concentration of income at the very top.
Finally, to provide a comparative perspective, Figure 6 plots the top 0.1% income share series in Japan with that in the United States and France, estimated respectively by Piketty and Saez (2003) and Piketty (2003) using the same methodology. The data indicate that the top 0.1% income share in Japan was higher than in the United States or Fance during the interwar period. Recall that the United States in the 1920s, in particular, was the world’s technological leader with giant corporations in capital-intensive industries that generated enormous fortunes (Chandler (1962)). Therefore, it is perhaps surprising to observe that Japan, whose major exports were textiles and light machinery during the same period, exhibited the similar level of income concentration. The top 0.1% income share in the United States and France declined roughly in three stages, first during WWI, then during the Great Depression, and finally during WWII. Interestingly, by the 1960s, the
shares in all three countries had converged to 2%. The figure illustrates a sharp contrast in the evolution of income concentration between the United States, on one hand, and Japan and France, on the other hand, since 1980. While the top income shares in Japan and France have remained low, the share in the United States has tripled in the last two decades, returning to the pre-WWII level. In Section 6, we explore the divergent experience of Japan and the United States using wage income tax statistics.
4.3 Trends in Top Income Composition
To better understand the mechanisms that led to the drastic and permanent decline in the top 1% income share during WWII in Japan, we use composition data from the income tax statistics. In Figure 7, we decompose the top 1% income share into the five categories: (a) employment income (wages, salaries, bonuses, allowances, and pensions, excluding benefits-in-kind), and (b) business income (profits from unincorporated businesses, farm income, and self-employment income), and (c) rental income (from land and buildings, excluding imputed rents), and (d) interest income (from bonds, deposits, and savings accounts, excluding returns on insurance policies), and (e) dividends (from privately held and publicly traded stocks). Immediate caveats are in order. First, for 1886-1945, our estimates are based on the composition of total income reported in the income tax statistics. During this period, the series are not homogenous as the fractions of adults filing tax returns fluctuated between 1% and 4% (see Table A2 in Appendix). Second, because most interest income has been either tax exempted or taxed separately at source since 1947, and so were large part of dividends since 1965, these components were missing from the income tax statistics (Iwamoto et al. 1995). Namely, the disappearance of interest income and the low share of dividends after WWII in the top 1% income in our estimates can be due to the data limitation. Third, the introduction of the withholding system in 1949 might have reduced tax evasion of wage earners. By contrast, in the absence of such withholding system, a potentially large portion of business income is said to be missing from the income tax statistics.
With these caveats in mind, we make the following observations from the top income composition data. First, throughout the 1886-1937 period, approximately 50% of the top 1% income consisted of capital income (i.e., rents, interest, and dividends). Within capital income, dividends steadily gained its share, while the share of interest income declined. Although not shown in the figure, within rental income, farm rents were a major component in the earlier years, but its share declined after 1915. Initially, the share of
business income in the top 1% income was higher than the share of employment income, but by 1930 the order was reversed. The decline of farm rents and the rise of employment income likely reflect the gradual shift from an agrarian economy with concentrated land ownership to an industrial economy with professional managers. Second, from 1937 to 1947, both the capital income and employment income components fell dramatically: right after WWII, the top 1% income was almost entirely composed of business income. Third, since 1950, the share of employment income in the top 1% income has increased steadily at the expense of business income. This trend is likely due to the further shift towards a highly industrialized economy with large corporations. Unlike the United States in the similar stage of economic development, however, this shift was accompanied by little increase in income concentration in Japan. Finally, after WWII, capital income has become a less important component in the top 1% income.
To assess the robustness of the above findings, we provide three additional analyses. First, in Figure A3 in Appendix, we present the average composition of total personal income in Japan from 1930 to 2002 based on National Accounts (in Panel A) and compare with the top 1% income composition (in Panel B). It shows that the share of capital income component in total personal income recovered from the collapse in WWII only gradually: not until the 1980s the shares of dividends and interest came close to their prewar peaks, and the share of rents has remained well below its prewar peak. As in the top 1% income, the share of business income in total personal income also declined monotonically and dramatically in the post-WWII period.14 Second, we estimate top income composition using an alternative source, a household wealth survey, which includes the capital income components missing from the tax statistics. As we show in Section 5.5, our findings are robust to the inclusion of the missing components. Third, we examine the changes in wealth distribution using estate tax statistics, which we report in next section.
4.4 Evidence from Top Estates
Our income composition series suggest that capital income accrued to the top 1% income group fell dramatically during WWII, never returned to the pre-WWII level, and was replaced by employment income. Total capital income in the economy, however, did recover albeit gradually. Then the fall in the top capital income must have been caused by
a permanent decline in wealth concentration. In order to test this hypothesis, we turn to estate tax return statistics published annually since the introduction of estate tax in 1905.15
Figure 8 plots the average sizes (in real 2002 yen) of the top 0.01% estates and the bottom half of top 1% estates (“top 1-0.5%”) from 1905 to 2002 in logarithmic scale. The top 0.01% estates, namely, the “very top” wealth holdings, correspond to the roughly top 100 decedents in 2002, whose average was about 5 billion yen or $40 million.16 By contrast, the average of the bottom half of top 1% estates, namely, the “moderately high” wealth holdings, was about 310 million yen or $2.5 million in the same year.17 According to the figure, both the top 0.01% and 1-0.5% estates increased substantially from 1905 to 1936. The top 0.01% estates then declined precipitously by a factor of 140 from 1936 to 1949, and the top 1-0.5% estates declined by a factor of 18 during the same period. In contrast to top incomes, top estates not only fell dramatically in 1941-45 but also continued to fall during the initial four years of the postwar occupational reforms. Both estate levels grew rapidly during the high economic growth period of 1955-73, but they have been on decline since the burst of the asset bubble in 1991. While the level of the top 1-0.5% estates surpassed the pre-WWII peak by 1970, the level of top 0.01% estates in 2002 is still smaller (in real terms) than in 1936 in spite of a ten-fold increase in GDP per capita.
When we compare the two series, the top 0.01% estates were initially about 50 times larger than the bottom half of top 1% estates, and by the 1930s, about 100 times larger. Because of the differential impact of WWII and the postwar reforms on the two estate levels, however, by 1949 the former were only about 20 times larger than the latter. Moreover, this ratio has remained fairly constant from 1950 to 2002 despite the changes in macro economic conditions during these years. In other words, there was a permanent decline in the level of the top wealth relative to the moderately high wealth after 1950.
Table 3 presents estate compositions for selected years, 1935, 1950, and 1987, for which the fraction of adult decedents filing estate tax returns are constant at about
15 Due to the data limitation, our top estates series are less precisely estimated than top income share series.
See Appendix Section B and Table B1 for complete results and a detailed discussion.
16 Due to the small sample size (50 to 100), year-to-year estimates of the top 0.01% estates can be sensitive
to the presence of a single extremely large wealth holder.
17 Although $2.5 million may still seem large, given the high real estate prices in Japan, an upper-middle
income class family owning a large apartment in Tokyo could leave an estate of that size. Studies suggest that the average household assets are considerably higher in Japan than in the United States (see Takayama (1992), Chapter 1).
9%.18 Estates are decomposed into: (1) land (both farm and residential), (2) houses and structures, (3) business assets (unincorporated business assets and farm assets), (4) stocks, (5) fixed claim assets (bonds, cash, deposits, and savings accounts), and (6) other assets (including household properties, pensions, and life insurances). The figure shows that the largest component of the top 9% estates shifted from financial assets (stocks and fixed claim assets) in 1935 to movable properties (business assets, houses and structures, and household properties) in 1950, to real estate (predominantly residential land) in 1987. The share of stocks and fixed claims assets in the top estates declined sharply from 49% in 1935 to 15% in 1950, and then rose to 22% in 1987. Namely, the share of financial assets in large estates in the midst of the bubble period was still less than half of that in 1935. Thus the top estate composition data provide additional evidence for our claim that the shares of dividends and interest in the top income collapsed during WWII and have not returned to the pre-WWII level to date.
To summarize, our top estates series suggest that a permanent reduction in the level of the top wealth relative to the moderately high wealth took place during and immediately after WWII. This dramatic fall in wealth concentration at the top is not only consistent with our findings from the top income shares series, but also provides better insights as to why the precipitous decline in top income shares was concentrated within the top 1% income group. WWII and the occupational reforms had a very large impact on the high end of the wealth distribution, destroying much of the source of capital income. Because in general the share of capital income in total income increases with the size of income, top income earners likely suffered a disproportionately large loss of their income. In other words, our data suggest that WWII and the subsequent reforms had an irreversible effect in wiping out high-income rentiers.
5. Understanding the Evolution of Income Concentration
Using the income and estate tax statistics, we have documented that (1) income concentration in Japan was extremely high during 1886-1940 by both historical and international standards; (2) the drastic de-concentration of income at the top took place in 1938-45; (3) income concentration has remained low throughout the post-WWII period; (4) the size of top wealth relative to moderately high wealth declined sharply in 1936-49 and stayed low, and (5) top income composition has shifted dramatically from capital and
18 Table B2 and Figure B1 present aggregate estate compositions from 1925 to 2002. See Appendix Section
business incomes toward employment income over the course of the 20th century. In this section, we explore the causes of the evolution of income concentration.
5.1 High Income Concentration in pre-WWII Japan
One of the merits of our data is that they allow a quantitative comparison of income concentration before and after WWII. Our findings strongly confirm the received view based largely on qualitative evidence that there was high concentration of income and wealth among the elite class in prewar Japan.19 Preceding studies suggest three major constituencies of the very rich: landlords, shareholders, and corporate executives.
First, there was a concentration of land ownership to a small number of “absentee landlords” (fuzai jinushi) mostly in rural areas whose lands were cultivated by tenant farmers. Especially in the earlier years, landowners enjoyed social and economic privileges over their tenants. After WWI, however, both the commercialization of agriculture and the rise of tenant unions led to lower rents and stronger tenant rights (Waswo and Nishida (2003), pp.14-7). As a result, large landowners began to diversify their assets and invest in financial and industrial assets. These observations are consistent with the substantive farmland rents component in the top 1% income during 1886-1915 and its gradual decline thereafter in our income composition data.
Second, before WWII, large firms raised its capital primarily from stock markets, and business ownership was heavily concentrated on a small number of individual (as opposed to institutional) shareholders. For example, Okazaki (2000) finds that, in 1935, at ten largest zaibatsu firms, top 10 shareholders held as much as 66% of total stocks (pp.103-5). In addition, prewar firms paid out high dividends to their shareholders. According to the study by Miyamoto et al. (1995) based on corporate charters of fifty companies in the 1880s, on average 70% of profit was distributed to shareholders as dividends (p.276). Okazaki (1993) also finds that, in the 1930s the average dividend to profit ratio at leading manufacturing firms was close to 70%, while it was less than 50% in the 1950s (p.184).
19 According to our data, the top income shares stayed relatively flat or increased only modestly from 1890 to
1940. By contrast, as Figure 2 shows, concerning the income distribution of all households, the preceding studies find a sharp increase in income inequality during the same period. Our findings are not necessarily contradictory to these results, if the increase was driven by the changes in the lower end of the income distribution. In fact, Mizoguchi and Terasaki (1995) and Minami (1995) attribute the rising income inequality in 1890-1940 primarily to the widening rural and urban income gap and the increasing intra-industry wage differentials.
Third, during the interwar period, top management at large corporations received extremely high compensation. In addition to high monthly salary, they were rewarded large year-end bonuses. According to Miyamoto and Abe (1995), the same fifty corporate charters stipulated that 10% of profit be distributed as executive bonuses (p.276). At leading manufacturing firms, directors on average received 6% of profit in the form of bonus in the 1930s, compared to 2% in the 1960s (Okazaki (1993), p.184). At five leading electric power companies, executive bonus was 28 times larger than the average income per capita in 1936, while in 1955 it was only 1.5 times larger (Minami (1995), p.123). By contrast, paying bonus for rank-and-file employees was an exception rather than a norm in prewar firms. Moreover, large shareholders themselves were often corporate directors in prewar firms, exacerbating the income concentration. For example, Okazaki (2000) finds that, at twenty leading manufacturing firms, top ten shareholders held 23% of the director positions in 1935, while they held none after 1947 (pp.103-5).
In a unique study using individual-level data, Yazawa (1992) compares the 5,000 highest income taxpayers in 1936 and 1982 based on Who’s Who that published their names, income tax paid, addresses, and occupational titles. He finds that, out of the top 5,000 income earners in 1936 – which corresponds roughly to the top 0.01% income group in our study – 31% were in retail business, 22% were in manufacturing, 22% were in finance, and 7% had no occupation (pp.155-9). He also shows that they were concentrated in metropolitan areas, such as Tokyo (45%) and Osaka (25%).20 Only 2.2% of them, however, were the members of aristocracy and only 3.0% were affiliated with zaibatsu holding companies, which indicates that the importance of aristocrats and zaibatsu families among the elite class should not be overstated (pp.160-6).
Last but not least, the legal system in prewar Japan proved favorable to the affluent class. Initially, both the 1886 income tax law and the 1905 estate tax law set extremely low tax rates in which the highest possible rates were 3% and 1.8%, respectively. Although the rates were increased subsequently, until the 1937 temporary tax increase law, the effective marginal tax rates for top income and estates groups had remained low (see Table A3 in Appendix). In addition, the prewar estate tax law endorsed primogeniture and allowed the first-born son (or a designated legal heir) to inherit entire family estates as a family head under preferential tax rates and high exemption points. In
20 Note that his sample covers 26 major prefectures out of total 47 prefectures in Japan, under-representing
other words, with the minimum government intervention, rich families could accumulate their wealth over several generations before WWII.
5.2 Mechanisms of Income De-concentration in 1938-1945
Our data indicate that the top income shares fell precipitously and disproportionately during WWII, but not at all during the occupational reforms. We explore the two key questions in turn: how did WWII reduce the income concentration in such a short period of time, and why did the occupational reforms have such little impact?
WWII likely caused the drastic income de-concentration through three main channels: wartime regulations, inflation, and war destruction. First of all, after the 1937 China Incident and the promulgation of the 1938 National General Mobilization Act, the military government implemented a set of regulations affecting landlord rights, shareholder rights, and executive compensation (Hoshi (1998), Hoshi and Kashyap (2001), Chapter 3; Okazaki (1993)). With respect to landlords, the government facilitated the redistribution of farmland from landlords to tenants in 1938 and 1943, regulated rents and land prices starting in 1939, introduced a two-tier price system for rice production in 1941 under which the government paid much higher prices to owner- and tenant-farmers than to landlords, and revised land and house lease laws in 1941 to augment tenant rights (Waswo and Nishida (2003), pp.22-3). Although their primary goal was to stimulate food production, all of these measures reduced both land value and rental income for landlords.
With respect to shareholders, the government regulated dividends starting in 1939, and capped a dividend-to-equity ratio at 8% in 1940 and at 5% in 1945. As the ratio at major companies before WWII often exceeded 10%, the regulation considerably lowered the returns on stocks. Moreover, the pressure on shareholders led to the decline in the number of shareholders in director positions at major companies after 1940 (Okazaki (2000), p.108). The government also regulated interest rates for private bonds in order to encourage the absorption of government bonds, reducing the returns on corporate bonds. With respect to executives, the government controlled wages and salaries starting in 1939 and placed a ceiling on executive bonuses in 1940. The 1938 law mandated the establishment of works councils, aiming at productivity increase through employee empowerment. These measures likely compressed not only inter-firm but also within-firm pay differentials during WWII. As shown in Figure 7, the changes in the different components of the top 1% income coincide well with the timing of the corresponding wartime regulations, indicating their importance in reducing income concentration.
Moreover, despite the stringent controls, the price level began to surge after 1938 and rose dramatically towards the end of WWII (see Figure 3). The inflation likely played a key role in reducing the top estates, as it diminished the real value of fixed claim assets (e.g., bonds and deposits). It also likely played a role in the collapse of the top capital income, because it reduced not only interest income but also rental income as the 1941 lease laws made it difficult for landlords to increase rents. Furthermore, to finance the rapid military expansion, the government increased individual and corporate income taxes in 1937, 1938, 1940, 1942, 1944, and 1945 (Japan National Tax Administration (1988)). The sharp increase in corporate tax rates mechanically reduced dividend distributions from corporations to shareholders.21
Finally, WWII led to large-scale destruction of physical and human capital that claimed 25% of physical assets and 668,000 civilian casualties by the end (Keizai Antei Honbu (1947)). In particular, repeated air raids of major cities by the U.S. air force starting in March 1945 likely had a devastating effect on the high income earners who were concentrated in the metropolitan areas (Yazawa and Minami (1993), p.366). Note, however, that the late timing of the bombing implies that it could not have been a major reason for the income de-concentration that had started in 1938. In summary, WWII can be seen as a one-time shock that reduced income and wealth inequality in Japan through the combination of government regulations, inflation, and war destruction.
5.3 Impact of U.S. Occupational Reforms in 1945-1952
Upon Japan’s surrender in August 1945, the nation was placed under the indirect governance of the Supreme Commander for the Allied Powers until 1952. As preceding studies have emphasized, the postwar occupational reforms could potentially have a large effect in equalizing the income distribution (Yazawa and Minami (1993); Minami (1995)). Three particularly powerfully redistributive measures were implemented during this period. First, the land reform in 1947-1950 mandated landlords to sell their farmland to ex-tenants, eliminating virtually all large- and medium-sized landowners. As a result, the percentage of land cultivated by tenants declined sharply from 46% in 1941 to 9% in 1955. Due to hyperinflation, compensation paid to landowners in real terms was a mere fraction of the land value. Second, to finance its large deficits, the government imposed
21 At the same time, one may suspect that the higher marginal tax rates would have invited a higher degree of
tax avoidance and evasion. Although we cannot deny this possibility, as discussed later, it was also true that the government intensified their effort to collect taxes during WWII.
extremely heavy and highly progressive property tax (zaisan zei) from 1946 to 1951. The property tax affected approximately 13% of all households in Japan in the initial year, and taxed away on average 33% of their properties. For the top 5,000 households, more than 70% of their properties were transferred to the government.
Third, under the dissolution of zaibatsu in 1946-48, not only ex- and current directors of zaibatsu firms were expelled, but also their stocks were confiscated and redistributed to a large number of employees and other investors at a market price. Consequently, these three measures transferred a significant amount of assets (i.e., land, stocks, and other household properties) from the high to the lower end of distribution. In addition, the hyperinflation in 1944-48 hit hard high-income rentiers. By contrast, farmers and small business owners who sold their products in underground markets were said to have earned substantive income in the immediate postwar years, explaining the surge of business income component in the top 1% income in Figure 7.
Despite the emphasis placed on the importance of the occupational reforms in reducing income inequality in the literature, our data indicate that, although they affected the top estate levels, they had practically no impact on the top income shares. Namely, we find WWII, rather than the occupational reforms, as the single most important event in reducing income concentration. Our finding may seem surprising at first, but the following observations indicate otherwise. First, our finding is consistent with the view that the occupational reforms were in many ways a continuation of the wartime policies (Okazaki and Okuno (1993); Noguchi (1995); Teranishi (2005)). That is, the restrictions on landlord and shareholder rights, the adoption of progressive taxation, and the check on executive compensation had already begun during WWII, which likely had set off the process of income de-concentration well before the postwar democratization and demilitarization. As such, there was little room left for the occupational reforms in further reducing top incomes.22 By contrast, our top estates series indicate that the reforms did have a large effect in reducing wealth concentration, whose implications will be discussed in next section.
Second, our finding is also consistent with the comparative evidence that indicates a universal role of WWII in reducing income concentration in such diverse countries as the
22 It is also likely that some redistributive measures equalized income at the lower end of the distribution
without changing the mean. For example, the land reform redistributed land primarily from middle-sized landowners to tenants, creating a large number of small-sized farmers. In such cases, we may not observe much change in the top 1% income share.
United Kingdom, France, the United States, and Canada (Atkinson and Piketty, 2006). Note that none of these countries was occupied after WWII and some did not even experienced major war destruction in their homelands. But, without exception, the war was accompanied by large-scale government intervention and inflation in these countries. In short, in the absence of quantitative evidence, the preceding studies have likely overstated the effect of the occupational reforms in equalizing income in Japan.
5.4 Low Income Concentration in Post-WWII Japan
Perhaps the more challenging question is why the top income shares did not recover from the profound yet temporary shock of WWII in the decades that followed. Why has the degree of income concentration in Japan remained at the historic low reached in the late 1940s? We argue that it was in this context that the occupational reforms played a critical role. Most simply, by redistributing assets and reducing wealth (as opposed to income) concentration, they equalized the distribution of capital income in subsequent years. More importantly, deriving their origins from the wartime policies, the postwar reforms transformed the one-time measures into lasting ones, facilitating a structural change in the Japanese economy that likely prevented re-concentration of income in subsequent decades.
First, the fiscal reforms in 1950 made progressive taxation a permanent feature of the Japanese tax system. Recall that the enormous fortunes that generated the high top 1% income share in the pre-WWII period had been accumulated at the time when progressive income tax hardly existed and capitalists could reinvest almost all of their incomes for further capital accumulation. The fiscal environment faced by capitalists after WWII was vastly different. As Figure 9 shows, after a spike in 1945-50 caused by temporary tax increases and hyperinflation, the marginal tax rate for the top 0.01% income group stayed high at around 60% from 1950 until the tax reform in the late 1980s. Tax rates on corporate income show similar trends. With respect to estate tax, the 1947 law abolished primogeniture and mandated the division of estate among surviving spouse and children, and the 1950 law instituted highly progressive estate and gift taxes with top rates in excess of 70%. As a result, inter-generational transfers of large wealth became much more difficult after WWII. Progressive taxation likely hindered the re-accumulation of large wealth, resulting in more equal distribution of capital income.
Second, the permanent decline in the share of capital income in the top income can be further attributed to measures specific to each capital income component. Since
the introduction of the land and house lease laws in 1941 until their repeal in 1992, the government had heavily protected tenant rights, which depressed the supply of rental housing. As a result of both high home ownership rate and more equal land distribution, rental income became a less significant source of income for top income earners in the postwar period. As for interest income, the government expanded tax-exempted saving instruments for small asset holders since the 1960s until they were abolished in 1988. These measures had likely promoted wealth accumulation among the middle class, equalizing the distribution of interest income. With respect to dividend income, a new corporate governance system characterized by bank-centered debt finance and cross-shareholdings among affiliated companies likely resulted in stable institutional shareholders and low dividend rates (Fukao (1995); Teranishi (2000)). As a result, dividends too became less concentrated among top income groups in postwar Japan.
Third, the changes in human resource management and union structure in Japan likely compressed wage distributions within firms. As the so-called “lifetime employment” became a hallmark of human resource management at large firms in the 1960s, most if not all management positions were filled by long-term employees promoted from within (Okazaki (2000)). Moreover, after violent confrontations in 1945-1955, most large firms in Japan were organized by single enterprise unions that represented both white- and blue-collar employees of the firms. By the 1970s, management regularly consulted with unions over personnel matters including wages and promotions (Morishima (1991); Moriguchi (2000); Kato and Morishima (2002)). These changes likely resulted in less wage differentials between white- and blue-collar employees as well as more equitable executive compensation. We will turn to wage income statistics to examine these hypotheses more closely in Section 6.
5.5 The Effects of Tax Evasion and Avoidance
In the above analysis, we provided historical explanations for the evolution of the top income shares estimated from the income tax statistics. As discussed briefly in Section 3, however, the incomes reported by individuals for tax purposes are subject to lawful and unlawful under-reporting, and hence may not reflect their true economic incomes. In this section, we discuss what is known about the extent of tax evasion and avoidance in Japan, and provide sensitivity analysis to show whether our findings can be explained away by these phenomena.
The precipitous and permanent drop in income concentration after WWII could be explained by tax evasion only if the evasion among top income groups relative to the rest of the population increased dramatically during WWII and remained high ever since. One may assume that tax evasion must have been rampant during WWII when labor and material shortages disrupted normal functioning of any administration. Yet, seeking additional sources for war finance, the government not only imposed various temporary taxes but also tightened the monitoring over tax collection during the war. For instance, both the numbers of local tax offices and their personnel rose during WWII (Japan National Tax Administration (1988)). Second, it is unlikely that tax evasion was lower in the prewar period when the tax administration was smaller and when most businesses did not compile systematic accounting records. By contrast, after WWII, both the enforcement power and technology available for the tax administration were considerably expanded, and most economic transactions took place within large corporations or financial institutions that used accounting methods leaving records that the tax administration could examine. For instance, it is widely believed that there is little tax evasion in Japan today concerning employment, dividend, and interest incomes, precisely because the sophisticated withholding system captures these incomes at source with the cooperation from corporate employers and financial institutions.
By contrast, tax evasion is considered to be substantially higher for business and farm incomes for which the withholding system does not apply.23 According to the estimate by Hayashi (1987), while nearly 100% of employment incomes were captured, only 50% of business income and 10% of farm income were reported to the tax administration. However, both business and farm income components in the top income are so small in recent years that it would require rates of evasion an order of magnitude higher than these estimated rates to generate the top income shares as high as in the pre-WWII period. For example, if we assume that only 10% of farm income and 50% of business income are reported in 1999, then our estimate of the top 1% income share would increase modestly from 7.8% to 8.5%.24 In short, it is difficult to argue that the apparent permanent decline in income concentration was due to tax evasion or unlawful under-reporting of income.
23 Most advanced countries face similar problems. For example, in the U.S., the Internal Revenue Service also
estimates that most income tax evasion takes place among small business owners.
24 In 1999, business income and farm income represent 8.3% and 0.1% of reported incomes in the top1%
income group. With no evasion, they would represent 16.6% and 1%, respectively, and the top 1% income share would be approximately 9% larger than our estimate.
In addition to tax evasion, individuals may shift their income using legal means and instruments to reduce tax payments. One such example is the usage of non-cash compensation instead of wages, which will be discussed in Section 6.2. Another way is to take advantage of special exemptions. As stated earlier, during the post-WWII period, various special treatments had been given to different components of capital income, most notably, interest, dividends, and realized capital gains (Iwamoto et al. (1995)). These treatments effectively allowed taxpayers to pay tax separately at source (gensen bunri kazei), instead of aggregating these components to other incomes and face progressive income tax schedule. As a result, the self-assessed income tax statistics do not include these capital income components. Therefore, it is important to evaluate the impact of the missing capital income components on our estimates of the top income shares.
The best available source for estimating the distribution of capital income by income group is the comprehensive household survey, National Survey of Family Income and Expenditure (NSFIE).25 In particular, the NSFIE in 1999 reports the holdings of various financial assets per household tabulated by the size of household head’s income. We combine these asset distribution data and National Accounts data to estimate the shares of three capital income components missing from the tax statistics (i.e., interest, dividends, and the returns on life and other insurance policies) in total income for various top income groups. In Table 4, we compare our estimates from the income tax statistics in 1999 (in Panel B) with the estimates from the NSFIE in the same year (in Panel C). Three observations follow.
First, the estimated average incomes from the NSFIE coincide well with those from the tax statistics up to the top 1% income group. For the top 0.5% income group, the two estimates differ significantly, however. Because the NSFIE uses a representative sample (about 50,000 households) that contains few observations at the high end of income distribution, it is difficult to provide precise estimates for the top 0.5% income group and above using NSFIE data. It is important to note that we find no systematic downward bias in estimating the average incomes using tax statistics compared to the NSFIE. The claim that the tax statistics are useless due to systematic under-reporting is thus not necessarily valid.
Second, according to Iwamoto et al. (1995), in recent decades, because of tax exemptions and separate taxation at source, approximately 80% of dividend income, over
25 Statistics Bureau of Japan, National Survey of Family Income and Expenditure (Zenkoku Shohi Jittai
99% of interest income, and 100% of the returns on insurance savings are not subject to the progressive income tax and not included in the self-assessed income tax statistics. The NSFIE estimates indicate that, compared to the national average, the higher income group receives larger portions of their income as dividends but smaller portions of their income as interest or the returns on insurance policies. Furthermore, even in the NSFIE data, the three capital income components make up very small portion of total income for the top income groups. For example, they respectively constitute 1.9%, 2.2%, and 4.5% of total income for the bottom half of the top 1% income group (the column “top 1-0.5%” in Panel C). Taken together, the table suggests that these components are not particularly concentrated at the top of the income distribution in today’s Japan.
Third, Panel A shows that interest and dividends constitute only a small share (2.8%) of total personal income in Japan. Even if we make the extreme assumption that all dividends and interest income go to the top 1% income group, it would increase the top 1% income share by 2.8 percentage point from 7.8% to 10.6%. Observe that this upper bound estimate is still substantially smaller than the pre-WWII share of 16%.
We provide similar sensitivity analysis for 1979-1999, using the NSFIE data. Our results are reported in Table D1 in Appendix. Consistent with the estimates from the income tax statistics, the table shows that there is only a very modest increase in the top top 5% income shares during this period. The share of the three capital income components in total income for the top 5% group was only moderately higher than the national average in 1979 and 1984, and was actually lower than the national average in 1989, 1994, and 1999. Therefore, fully incorporating the missing components would have only small effects (a slight increase in the 1980s and a slight decrease in the 1990s) on our estimates for the top income shares. In summary, adding back the missing capital income components would not change our main conclusion that the degree of income concentration fell drastically in Japan from the pre-WWII to post-WWII period.
6. Top Wage Income Shares in Japan, 1929-2002 6.1 Trends in Wage Income Concentration
In this section, we present our estimates of top wage income shares in Japan to investigate the role of employment income in the evolution of income concentration. Wage income in our definition includes wages, salaries, bonuses, and pecuniary benefits, but excludes non-cash compensation and retirement benefits. For the pre-WWII period, we