By
Paula L. Hedley
Dissertation presented for the degree of Doctor of Philosophy (Medical
Biochemistry) in the Faculty of Medicine and Health Sciences
Ăƚ^ƚĞůůĞŶďŽƐĐŚhŶŝǀĞƌƐŝƚLJ
Promoter: Prof Valerie A. Corfield
Co-promoter: Prof Johanna C. Moolman-Smook
Co-promoter: Dr Michael Christiansen
April 2014
MOLECULAR AND FUNCTIONAL
CHARACTERISATION OF LONG QT
Page i
DECLARATION
By submitting this dissertation electronically, I declare that the entirety of the work contained therein is my own, original work, that I am sole author thereof (save to the extent explicitly otherwise stated), that reproduction and publication thereof by Stellenbosch University will not infringe any third party rights and that I have not previously in its entirety or in part submitted it for obtaining any qualification.
This dissertation includes two first author reviews, one editorial, three original first author papers and one original co-authored paper published in peer-reviewed journals or books and
three unpublished publications. The development and writing of the papers (published and unpublished) were my principal responsibility and, where this is not the case, a declaration is included in the dissertation indicating the nature and extent of the contributions of co-authors.
Signature
Paula Louise Hedley
Name in full
Date
Copyright© 2014 Stellenbosch University All rights reserved
Page ii
ABSTRACT
Ventricular arrhythmias are the most important cause of sudden cardiac death (SCD) among adults living in industrialised nations. Genetic factors have substantial effects in determining population-based risk for SCD and may also account for inter-individual variability in
susceptibility. Great progress has been made in identifying genes underlying various Mendelian disorders associated with inherited arrhythmia susceptibility. The most well studied familial arrhythmia syndrome is the congenital long QT syndrome (LQTS) caused by mutations in genes encoding subunits of myocardial ion channels. Not all mutation carriers have equal risk for experiencing the clinical manifestations of disease (i.e. syncope, sudden death). This observation has raised the possibility that additional genetic factors may modify the risk of LQTS manifestations.
This study establishes the genetic aetiology of LQTS in South Africa and Denmark through the identification and characterisation of LQTS-causative mutations in five previously identified genes, as well as examining possible novel genetic causes of LQTS in a cohort comprising Danish and British probands. We have functionally characterised several of the mutations identified in this study and examined other cardiac phenotypes that may be explained by variants causing repolarisation disorders.
Page iii
OPSOMMING
Ventrikulêre aritmie bly die enkele belangrikste oorsaak van skielike hart dood (SCD) onder volwassenes wat in geïndustrialiseerde lande woon. Genetiese faktore het aansienlike gevolge in die bepaling van bevolking-gebaseerde risiko vir SCD en kan ook verantwoordelik wees vir die inter-individuele variasie in vatbaarheid. Groot vordering is gemaak in die identifisering van gene onderliggende verskeie Mendeliese siektes wat verband hou met geërf aritmie
vatbaarheid. Die mees goed bestudeerde familie aritmie sindroom is die aangebore lang QT-sindroom (LQTS) wat veroorsaak word deur mutasies in gene kode subeenhede van
miokardiale ioonkanale. Nie alle mutasie draers het 'n gelyke risiko vir die ervaring van die kliniese manifestasies van die siekte (dws sinkopee, skielike dood). Hierdie waarneming het die moontlikheid genoem dat genetiese faktore anders as die primêre siekte-verwante mutasie kan die risiko van LQTS manifestasies verander.
Hierdie studie stel die genetiese oorsake van LQTS in Suid-Afrika en Denemarke deur die identifisering en karakterisering van LQTS-veroorsakende mutasies in vyf voorheen
geïdentifiseer gene, asook die behandeling van moontlike nuwe genetiese oorsake van LQTS in 'n groep wat bestaan uit van die Deense en die Britse probands. Ons het funksioneel gekenmerk verskeie van die mutasies wat in hierdie studie ondersoek en ander kardiovaskulêre fenotipes wat deur variante veroorsaak repolarisasie versteurings verduidelik word.
Page iv
ACKNOWLEDGEMENTS
I would like to express my sincere thanks and appreciation to the following people without whom this thesis and the studies comprising it would not have been possible.
Firstly, I would like to thank my promoter Prof Valerie Corfield without whom my achievements thus far would not have been possible. She has been a most incredible mentor, her knowledge, drive and dedication are a constant source of inspiration. I would like to thank her for her help, encouragement, motivation and guidance.
Secondly, I would like to thank my co-promoter Prof Hanlie Moolman-Smook for her supervision and advice during the course of these studies. She is a talented scientist and excellent mentor, her input in these studies has been invaluable.
Thirdly, I would like to thank my co-promoter Dr Michael Christiansen, who despite being a late addition to the team has certainly contributed to the shape and flavour of these studies. His clinical and scientific insights and inputs have been vital to these studies.
Thanks also to my lab-mates and colleagues who have contributed greatly to my scientific development. I greatly appreciate their support, advice and scientific discussion. In particular, I’d like to thank Dr Craig Kinnear for all his efforts in supporting these projects scientifically and supporting me personally.
With regard to the South African portion of these studies, I’d like to thank Dr Lize van der Merwe for statistical advice, Prof Paul Brink, Sr Althea Goosen and Dr Marshall Heradien for all their clinical work in these projects and Mrs Ina Le Roux, Mrs Lundie Korkie for expert technical assistance. In respect to the Danish portion of these studies, I’d like to thank Ms Mette
Hougaard, Ms Christine Valdez, Mr Dennis Petersen, Mr Dennis Schmidt, Ms Karina Madsen, Mr Michael Petersen and Mrs Kirstin Lindboe for their technical contributions to these studies. I would like to thank my many wonderful co-authors and colleagues whose intellectual discussion and clinical/technical expertise have not only supported these studies but have contributed to my own intellectual growth and development.
I would like to thank and acknowledge the funders of these projects: the South African National Research Foundation, The Harry and Doris Crossley Foundation and The Danish Strategic Research Foundation.
Finally, I would like to thank my family and friends for their support and encouragement. Particularly, Prof Arshnee Moodley, whose critical revision of this dissertation is much appreciated.
Page v
TABLE OF CONTENTS
Declaration ...i Abstract ... ii Opsomming ... iii Acknowledgements ... ivList of Figures ... viii
List of Tables ... xvi
Preface ... xix
Chapter 1: Introduction ... 1
1.1 The Heart ... 1
1.1.1 Contractility ... 1
1.1.2 Automaticity, Excitability and Conductivity ... 2
1.2 Electrocardiogram ... 3
1.3 Cardiac Arrhythmias ... 5
1.3.1 Terminology of Rhythm Disturbances ... 5
1.3.2 Mechanisms of Arrhythmias ... 6
1.4 Sudden Cardiac Death ... 7
1.5 Inherited Arrhythmia Disorders ... 9
1.5.1 Long QT Syndrome ... 9
1.5.2 Review 1: The Genetic Basis of Long QT and Short QT Syndromes: A Mutation Update ... 11
1.5.3 Review 2: The Genetic Basis of Brugada Syndrome: A Mutation Update ... 38
1.5.4 Editorial: Long QT Testing: Implications for Complex Diagnosis in Personalised Medicine ... 50
Hypothesis ... 54
Aim ... 54
Chapter 2: The Genetic Aetiology of Long QT Syndrome in South Africa ... 55
Paper 1: Long QT Syndrome in South Africa: The Results of Comprehensive Genetic Screening ... 56
Page vi
Chapter 3: The Genetic Aetiology of Long QT Syndrome in Denmark... 64
Paper 2: Mutations in Danish Patients with Long QT Syndrome and Identification of a Large Founder Family with P.F29L in KCNH2 ... 65
Chapter 4: An Examination of Putative Novel Genetic Causes of Arrhythmic Syndromes ... 95
Paper 3: The Role of CAV3 in Long QT Syndrome: Clinical and Functional Assessment of a Caveolin-3/Kv11.1 Double Heterozygote versus Caveolin-3 Single Heterozygote... 96
Paper 4: MicroRNAs in Cardiac Arrhythmia: The Sequence Variation of miR-1 and miR-133a in Long QT Syndrome... 109
Chapter 5: Sodium Channel Disease ... 131
Paper 5: Flecainide Provocation Reveals Concealed Brugada Syndrome in a Long QT Syndrome Family with a Novel L1786Q Mutation in SCN5A ... 132
Paper 6: High Prevalence of Long QT Syndrome–Associated SCN5A Variants in Patients with Early-Onset Lone Atrial Fibrillation ... 158
Chapter 6: Ion Channel Genes Implicated in Structural Heart Disease ... 169
Paper 7: The KCNE Genes in Hypertrophic Cardiomyopathy: a Candidate Gene Study ... 170
Chapter 7: Discussion ... 176
7.1 Genetic Aetiology of Long QT Syndrome ... 176
7.2 Determining the Pathogenicity of Variants in LQTS-causing Genes ... 178
7.3 Identifying and Evaluating New Genetic Causes of Long QT Syndrome ... 181
7.3.1 Copy Number Variants ... 181
7.3.2 Assessing the Evidence ... 182
7.3.3 Genetic Variants of microRNA Genes do not Play a Role in Long QT Syndrome ... 183
7.4 Cardiac Sodium Channel Overlap Syndromes ... 184
7.5 Channelopathy Genes Cause Cardiomyopathy ... 185
Chapter 8: Conclusion and Future Direction ... 187
Chapter 9: References ... 190
Chapter 10: Candidate’s Contributions ... 204
Chapter 1 ... 204
Chapter 2 ... 204
Chapter 3 ... 204
Page vii
Chapter 4 ... 205
Chapter 5 ... 205
Chapter 6 ... 205
Chapter 11: Supplementary Materials ... 206
11.1 List of Abbreviations ... 206
11.2 Table of Genes Examined in the Dissertation ... 210
11.3 Candidate’s Publication list ... 210
11.3.1 Cardiovascular Diseases ... 210
11.3.2 Prenatal Diagnosis and Reproductive Medicine... 212
11.3.3 Immunogenetics ... 213
11.3.4 Pharmacogenetics ... 213
Page viii
LIST OF FIGURES
CHAPTER 1: INTRODUCTION
Figure 1:A. A schematic diagram depicting the chambers, valves and great vessels of the heart, blood flow is indicated by blue and red arrows. Blue arrows indicate the flow of de-oxygenated blood and the red arrows indicate the flow of oxygenated blood. B. A diagrammatic
representation of the layers of the heart wall, the myocardium is the thick middle layer. ... 2 Figure 2: A schematic representation of the cardiac cycle, components of the cardiac conduction system and action potential wave forms from particular areas of the heart. ... 3 Figure 3:A. Positions of ECG electrodes are indicated and labelled appropriately. B. A schematic representation of the ventricular cardiomyocyte action potential which corresponds to the QT interval on an ECG trace. The phases of the action potential are indicated, these represent shifts in ion channel activity and consequent changes in membrane potential. C. A representative diagram of single cycle ECG pattern, the P wave corresponds to the firing of the SA node and depolarization of the atria; the PR interval represents the delay of the electrical impulse at the AV node. The QRS complex corresponds to ventricular depolarization while the T Wave
represents ventricular repolarisation. ... 4 Figure 4: Mechanisms of arrhythmia generation. In all panels Trace 1 (solid line) represents the normal condition A. Trace 2 (dotted line) represents increased automaticity, caused by
inappropriate depolarisation and abnormally rapid firing. B. Trace 2 represents an
afterdepolarisation which has not reached the threshold necessary to become self-perpetuating. Trace 3 represents an afterdepolarisation which has reached threshold to result in a premature ectopic AP before the next expected normal AP. C. Re-entry occurring between two connected zones of tissue (I and II) - as shown on the right. Trace 2 represents a premature activation in zone II. This activation current fails to initiate firing in zone I because zone I is still refractory. Trace 3: This current may conduct back (red dashed line) to zone I at a time when it can respond with an AP. Trace 4: This AP may propagate to initiate in zone II, and the process can continue indefinitely. ... 6 Figure 5: Pathophysiology and epidemiology of SCD. ... 7 Figure 6: SCD incidence and total events for various population pools, showing an inverse relationship between risk and total number of events. ... 8 Figure 7: This Venn diagram indicates the potential interactions of various cardiac factors. The factors may modulate latent arrhythmogenic mechanisms capable of causing sudden death... 9
Page ix
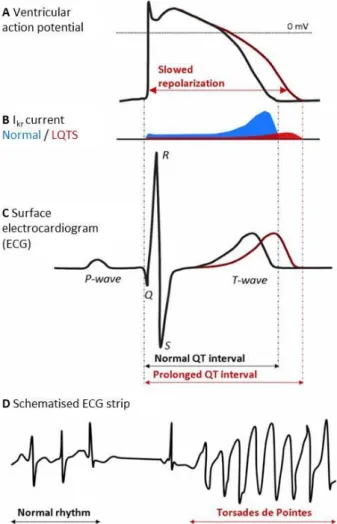
Figure 8:A. Normal and prolonged ventricular action potential. B. Normal and reduced IKr currents. C. Normal and prolonged QT interval on an ECG. D. A schematic representation of Torsade de Pointes... 10
1.5.2 REVIEW 1: THE GENETIC BASIS OF LONG QT AND SHORT QT SYNDROMES: A MUTATION UPDATE
Figure 1: The action potential (AP) and schematic of the currents involved in creating it. The red current represents the sodium current (INa), which is formed by the Na+-channel. The blue
current represents the long-lasting calcium current (ICa-L), which is formed by the long-lasting
Ca2+ channel. The orange currents represent the potassium currents (IK), which are formed by the K+-channels: Kv4.3 conducts the Ito-current, Kv11.1 conducts the IKr-current, Kv7.1 conducts the IKs-current, and Kir2.1 conducts the IK1-current. The yellow current represents the sodium
calcium exchange current (INa/Ca), which is formed by the Na+/Ca2+-exchange channel. The
duration of the AP (APD) increases with decreasing repolarization; e.g., by loss-of-function mutations in the repolarizing potassium channels or gain-of-function mutations in genes coding for depolarizing Na+ and Ca2+ channels. ... 13
Figure 2:A, B: Schematic drawings of the ion channel complexes involving K+-ion channels. The locations of the mutations known to cause SQTS are indicated by blue dots. The genomic
structure with the basic structural elements is indicated, as well as the relative distribution of mutations per exon (in percent of total number of LQTS mutations in the gene) is shown for the involved genes, KCNQ1 (C), KCNH2 (D), AKAP9 (E), KCNE1 (F), and KCNE2 (G). BD: binding domain; CNBD: cyclic nucleotide binding domain; PAC: PAS-associated C-terminal domain; PAS: domain containing the Per-ARNT-Sim motif; S1–6: transmembrane segments 1–6; TM:
transmembrane domain. ... 16 Figure 3:A: Schematic drawing of the ion channel complex conducting the INa current. The
genomic structure with the basic structural elements is indicated, as well as the relative
distribution of mutations per exon (in percent of total number of LQTS mutations in the gene) is shown for the involved genes, SCN5A (B), SNTA1 (C), CAV3 (D), and SCN4B (E). BD: binding domain; DI–IV: domains 1–4; PDZ: PDZ structural domain; PH1: pleckstrin homology domain1; PH2: pleckstrin homology domain2; SU: syntrophin unique domain; TM: transmembrane domain. ... 17 Figure 4: The genomic structure of ANK2, with the basic structural elements indicated and a relative distribution of mutations per exon (percent of total number of mutations in the gene). B56a: protein phosphatase 2A regulatory subunit B56α binding domain; CTD: carboxyl terminal domain; DD: death domain; Hdj-1: molecular chaperone HSP40/Hdj-1 binding domain; IP3R:
Page x inositol 1,4,5-triphosphate receptor binding domain; MBD: membrane binding domain; NCX: sodium calcium exchanger binding domain; SBD: spectrin binding domain. ... 18 Figure 5:A: Schematic drawing of Kir2.1, the locations of known LQTS-associated and SQTS-associated mutations are indicated by red and blue dots, respectively. B: The genomic structure with the basic structural elements indicated. Kir2.1 is encoded by a single exon of KCNJ2, and all mutations identified to date are contained within this exon. M1: transmembrane region 1; M2: transmembrane region 2; PIP2: phosphatidylinositol 4,5-bisphosphate binding domain; SF: selectivity filter. ... 22 Figure 6: Schematic drawing of Cav1.2 ion channel α-subunit and the Cavβ2-subunit. A: The locations of the two LQT8 mutations are indicated by red dots while the locations of the SQTS-causing mutations are indicated by blue dots. B: The genomic structure with the basic structural elements indicated. Both mutations are located in exon 8 of CANCA1C. Ca2+BD: calcium binding domain; DI–IV: domains 1–4. ... 23
1.5.3 REVIEW 2: THE GENETIC BASIS OF BRUGADA SYNDROME: A MUTATION UPDATE
Figure 1: A schematic representation of the action potential (AP) with the ion channels of major significance for the AP, and the currents they conduct as a function of the AP. The red channel depicts the INa conducted by the Nav1.5; the yellow channel represents the Na+/Ca2+-exchange
ion channel; the blue channel represents the long lasting Ca2+ current IL.Ca conducted by the Cav1.2 ion channel; the orange channel represents the major repolarizing K+ ion currents. Kv4.3 conducts the Ito; Kv11.1 conducts the IKr-current; Kv7.1 conducts the IKs-current, and Kir2.1
conducts the IK1-current... 41 Figure 2: A schematic drawing of the Nav1.5 ion channel with the BrS-associated mutations shown as red dots and phenotypes, colour coded, as described in the table. ... 42 Figure 3: A schematic drawing of the Cav1.2 ion channel with its associated Cavβ2-subunit. The three mutations associated with BrS are shown as red dots. ... 42 Figure 4: A schematic drawing of MiRP2 with the BrS-associated mutation marked as a red dot. ... 42
CHAPTER 3: THE GENETIC AETIOLOGY OF LONG QT SYNDROME IN DENMARK
PAPER 2: MUTATIONS IN DANISH PATIENTS WITH LONG QT SYNDROME AND IDENTIFICATION OF A LARGE FOUNDER FAMILY WITH P.F29L IN KCNH2
Figure 1: Location of microsatellite markers used in haplotyping the p.F29L and p.K101E mutations in KCNH2. ... 94
Page xi CHAPTER 4: AN EXAMINATION OF PUTATIVE NOVEL GENETIC CAUSES OF ARRHYTHMIC
SYNDROMES
PAPER 3: THE ROLE OF CAV3 IN LONG QT SYNDROME: CLINICAL AND FUNCTIONAL ASSESSMENT OF A CAVEOLIN-3/KV11.1 DOUBLE HETEROZYGOTE VERSUS CAVEOLIN-3
SINGLE HETEROZYGOTE
Figure 1: Caveolin-3 domain organization and mutation map. The primary structure of
caveolin-3 in which each amino acid is represented as a stripe, the 4 domains are demarcated by coloured blocks and are labelled in the figure (N-terminal [amino acid (aa) 1–53]— blue,
scaffolding domain [aa 54–73]—pink, transmembrane domain [aa 74–106]—green, and C-terminal domain [aa 107–151]—orange). The FEDVIAEP caveolin signature domain is indicated within the N terminal. Previously reported mutations have been indicated as green stripes along with the diseases reported to be associated with them. Caveolin-3:p.T78M is represented by a red stripe. Non-synonymous variants represented in the exome variant server are indicated in black, and the frequencies of these variants are shown for European Americans (EA) and African Americans (AA). DCM indicates dilated cardiomyopathy; DM, distal myopathy; H-CK,
hyperCKemia; HCM, hypertrophic cardiomyopathy; LGMD, limb-girdle muscular dystrophy; LQTS, long–QT syndrome; RMD, rippling muscular dystrophy; and SIDS, sudden infant death syndrome. ... 98 Figure 2: Pedigree representation of the family carrying both caveolin-3:p.T78M and
Kv11.1:p.I400N. The pedigree indicates the transmission of both the caveolin-3:p.T78M mutation and the Kv11.1:p. I400N mutation. The proband is indicated with an arrow.
□
represents male members of the pedigree and○
represents female members. Filled symbols represent long–QT syndrome affected individuals. QTcB=corrected QT interval using Bazett formula (QTcB=QT/√ RR); +/− Kv11.1:p.I400N carriers; −/+ caveolin-3:p.T78M carriers; +/+ double heterozygote carriers of Kv11.1:p.I400N and caveolin- 3:p.T78M; *ICD units, no appropriate shocks have been registered. CA indicates cardiac arrest; and ICD, implantable cardioverter defibrillator. ... 101 Figure 3: Western blot of Kv11.1 wild-type (WT) and Kv11.1:p.I400N mutant (A). The densities of the 155-kDa bands of the WT and the Kv11.1:I400N mutant are normalized to theirrespective 135-kDa band and are plotted in B as relative values to the amount of Kv11.1 channel present in the endoplasmic reticulum (n=8; P=0.001). The actin bands in A show that equal amounts of total protein were loaded on the gel. ... 102 Figure 4: Electrophysiological readings. A. Representative Kv11.1 wild-type (WT) and
Kv11.1:p.I400N traces. The voltage clamp protocol is shown in inset. B. Steady state peak
Page xii currents measured at 0 mV and peak tail currents measured at 60 mV for WT and
Kv11.1:p.I400N. C. Deactivation; representative current traces after a deactivation protocol (in inset). D. Maximum tail currents measured in WT and Kv11.1:p.I400N. E. Tau values after double exponential fitting to the decaying phase of the traces obtained for WT and
Kv11.1:p.I400N. All deviations of mean averages are given as SEM. hERG indicates human ether-a-go-go-related gene. ... 103 Figure 5:A. Western blot analysis of immunoprecipitated human embryonic kidney 293 (HEK293) protein extracts. Double-transfected HEK293 cells with KCNH2 and CAV3 were immunoprecipitated with anti-Kv11.1 antibodies and blotted for the presence of caveolin-3. Lane 2 shows that caveolin-3 coimmunoprecipitates with Kv11.1. Cells transfected with only 1 of the constructs (CAV3 or KCNH2) and cells transfected with empty plasmids were used as controls (lanes 5, 7, and 9). No caveolin-3 is detected in any of the control lanes, including the sample, where immunoprecipitation was carried out with normal goat serum polyclonal IgG (lane 3) instead of anti-Kv11.1 antibodies, thus confirming the specificity of the Kv11.1–
caveolin-3 binding. B. Western blot analysis of immunoprecipitated Kv11.1 wild-type (WT) and mutant protein. The caveolin-3:p.T78M and the Kv11.1:p.I400N mutants were investigated in coimmunoprecipitation experiments and compared with WT. The interaction between
caveolin-3 and Kv11.1 mutants is not disrupted in any combination as shown by the presence of the caveolin-3 band in all the immunoprecipitation lanes. ... 104 Figure 1 of Supplemental Material: ECG traces of family members solely carrying the caveolin 3:p.T78M mutation. A. II2, B. II4 and C. III7 ... 106-108
PAPER 4: MICRORNAS IN CARDIAC ARRHYTHMIA: THE SEQUENCE VARIATION OF MIR-1 AND MIR-133A IN LONG QT SYNDROME
Figure 1:A) Genomic structure of the miR-1 and miR-133 clusters. B) Genomic structure of mir-1-2 and mir-133a-2, variants identified in this study are represented by a red line. The minor allele frequencies (MAF) indicated here are representative of the CEU population as reported in 1000 genomes, except rs200375711 (mir-133a-2:n.98C>T) which was not identified in 1000 genomes but was identified in one of 493 atherosclerosis patients of European descent from the ClinSeq whole-exome sequencing project. ... 129 Figure 2:A) Pri-miR-1-2 multiple species sequence alignment. Pre-miR-1-2 is indicated in a blue box; mature MiR-1 is indicated in a red box; the seed region is highlighted; rs9989532 is indicated by a black arrow. B) Pre-miR-1-2 secondary structure, mature MiR-1 is indicated in Red. Secondary structure was predicted using RNAfold Web Server. ... 129
Page xiii
Figure 3:A) Pri-miR-133a-2 multiple species sequence alignment. Pre-miR-133a-2 is indicated in a blue box; mature MiR-133A is indicated in a red box; the seed region is highlighted;
rs13040413 and rs200375711 are indicated by black arrows. B) Pre-miR133a-2 secondary structure, mature MiR-133A is indicated in Red, n.98C is indicated in blue. Secondary structure was predicted using RNAfold Web Server. ... 130
CHAPTER 5: SODIUM CHANNEL DISEASE
PAPER 5: FLECAINIDE PROVOCATION REVEALS CONCEALED BRUGADA SYNDROME IN A LONG QT SYNDROME FAMILY WITH A NOVEL L1786Q MUTATION IN SCN5A
Figure 1:A) The homology alignment of the SCN5A sequences across eight species indicating the conservation of the mutated L1786 residue. Published LQTS and BrS mutations in this region are also indicated. B) This residue is also conserved in all types of human SCN alpha channels. ... 154 Figure 2: Biophysical properties of wt vs L1786Q Nav1.5 channels A) Voltage clamping of either WT or mutant (L1786Q) SCN5A transfected HEK293 cells at 37 ˚C. Representative traces.
Increasing depolarizing voltages increasingly activates the Nav1.5 channels. However, as the reversal potential of sodium is approximately 50 mV, the peak current decreases at potentials higher than approximately – 20 mV. B) Current voltage (I-V) relationship. C) Normalized peak current at the maximum current recorded (wt; -20 mV, L1786Q; -5 mV). D) Steady-state inactivation as a function of voltage. E) Steady-state activation as a function of voltage. The Boltzmann curves were obtained as described under “Experimental Procedures”. The applied voltage protocols are shown in inserts. Arrows indicate were the current values are recorded. The left-ward shift in inactivation and the right-ward shift in activation of L1786Q compared to WT are both parameters that will reduce peak sodium current. F) Sustained current at different potentials recorded from wt and L1786Q expressing cells at 37 ˚C. Normalised for cell size. *p < 0.05, **p < 0.01, ***p < 0.001. ... 155 Figure 3:A) The sustained current was addressed by depolarising the Nav1.5 transfected cells to -20 mV for 500 ms. Following the initial opening and inactivation of the sodium channel a small sustained current was observed (black traces). The part of this current conducted through the Nav1.5 channels was established by adding 50 μM tetrodotoxin (TTX) (red traces).
B) Normalised TTX sensitive peak current. C) Normalised TTX sensitive sustained current. **p < 0.01. ... 156 Figure 4: Family pedigree, empty symbols (circles indicate females, and squares, males) depict unaffected members, filled symbols depict carriers of the SCN5A L1786Q mutation. The
Page xiv corrected QT interval (QTc) is shown above the gender symbol. The arrow indicates the
proband (II-1). ... 157 Figure 5: ECG and EGM traces: A) ECG trace from the proband with QT prolongation but
without any signs of ST elevation. B) ECG trace from the proband during flecainide test with coved pattern. C) BrS pattern with ST elevation and a premature beat with a short coupling interval eliciting the arrhythmia. D) LQTS pattern of induction without ST elevation in EGM and a short-long-short coupling sequence. E) ECG trace from the proband’s brother (Figure 1: II-3) during flecainide testing. F) ECG trace from the proband’s niece (Figure 1: III-3) during
flecainide testing. ... 157
PAPER 6: HIGH PREVALENCE OF LONG QT SYNDROME–ASSOCIATED SCN5A VARIANTS IN PATIENTS WITH EARLY-ONSET LONE ATRIAL FIBRILLATION
Figure 1:A. DNA sequencing traces (chromatograms) for variants identified in SCN5A. B. Evolutionary conservation between species. The location of mutated amino acid is marked in red. C, The position of the mutations indicated in schematic of protein topology. ... 161 Figure 2: Electrophysiological characterization of SCN5A mutants. A. Representative current traces obtained with a current/voltage protocol (inset in D) for wild-type (WT) and the 5 Nav1.5 mutations. B. Onset of fast inactivation; single exponential fit to the decaying phase of the current traces (as shown in A). C. Current/voltage relationship of WT and Nav1.5 mutants.
D. Steady-state activation curves. Activation properties were determined from I/V relationships by normalizing peak INa to driving force and maximal INa, and plotting normalized conductance
vs mV. E. Steady-state inactivation curves. Boltzmann curves were fitted to both steady-state activation and inactivation data. F. Time- and voltage-dependent recovery from inactivation. The time-dependent recovery from inactivation at different voltage potentials (inset) was fitted with a monoexponential relationship, and the τ values were plotted. A and C-E, Averaged values and the numbers of cells measured are presented in Table 3. B and F, n=10 for each group. *P<0.05, **P<0,01, and ***P<0,001.
●
WT, ◊ R340Q, ▼ R1626H, Δ R1897W,○
D1819N,□
V1951M. Error bars represent the mean±SEM. In some figures, the SEM bars are smaller than the data symbols. ... 164
Page xv
Figure 3: The sustained sodium current (INaL) of R1626H and D1819N is increased at different
voltages. Representative recordings in the absence or presence of tetrodotoxin (TTX) for wild-type (WT) (n=6) (A), R1626H (n=6) (B), and D1819N (n=6) (C). Currents were activated by a 500-ms step to –20 mV from a holding potential of –100 mV. For comparison, the peak and late current are shown at different scales. The sustained currents were normalized to the peak current observed in each trace. D. Summarized data of INaL at different voltages. Currents were
activated by a 500-ms step from –30 to 0 mV in 10-mV increments from a holding potential of – 100 mV. Currents in the presence of TTX were subtracted from currents recorded in the absence of TTX to determine the TTX-sensitive current. INaL was measured as the mean current
between 450 and 500 ms, and the ratio between the TTX-sensitive peak and the late current was calculated for WT, R1626H, and D1819N. At each condition, the difference in INaL between
R1626H or D1819N and WT was significant. *P<0.05, **P<0.01, and ***P<0.001. ... 166
CHAPTER 7: DISCUSSION
Figure 9: A decision tree for the clinical interpretation of genetic variants. Types of evidence are shown in the box at the bottom left of the figure. ... 178 Figure 10:A. Common signs and B. symptoms of SCN5A-disease. ... 182
Page xvi
LIST OF TABLES
CHAPTER 1: INTRODUCTION
Table 1: The proportion of the US population hospitalised or deceased as a result of
arrhythmias in 2003, data taken from Rosamond et al. (2007). The ratios were calculated from the number of people hospitalised as a result of an arrhythmia as well as the number of people whose deaths were caused by arrhythmias in 2003. The number of people who developed arrhythmias or died as a result of an arrhythmia, which was a secondary complication to their
condition, was not included. ... 5
1.5.2 REVIEW 1: THE GENETIC BASIS OF LONG QT AND SHORT QT SYNDROMES: A MUTATION UPDATE Table 1: Diagnostic criteria of long QT syndrome ... 13
Table 2: The genes associated with long QT syndrome ... 14
Table 3: The genes associated with short QT syndrome ... 15
Table 4: Mutations causing SQT1–SQT5 ... 16
Table 5: LQT4 mutations in ANK2 ... 19
Table 6: LQT5 mutations in KCNE1 and LQT6 Mutations in KCNE2 ... 21
Table 7: LQT7 mutations in KCNJ2 ... 23
Table 8: LQT8-, LQT9-, LQT10-, LQT11-, and LQT12-causing mutations in CACNA1C, CAV3, SCN4B, AKAP9, SNTA1, respectively ... 24
Table 9: Summary of various population screening surveys ... 27
1.5.3 REVIEW 2: THE GENETIC BASIS OF BRUGADA SYNDROME: A MUTATION UPDATE Table 1: BrS types and associated genes ... 41
Table 2: Mutations in genes causing BrS2–BrS7 ... 43
Page xvii CHAPTER 2: THE GENETIC AETIOLOGY OF LONG QT SYNDROME IN SOUTH AFRICA
PAPER 1: LONG QT SYNDROME IN SOUTH AFRICA: THE RESULTS OF COMPREHENSIVE GENETIC SCREENING
Table 1: Demographic and clinical characteristics of 44 index patients ... 58
Table 2: Disease-causing mutations identified in the South African LQTS probands as well as an indication of which platforms identified the variant ... 59
CHAPTER 3: THE GENETIC AETIOLOGY OF LONG QT SYNDROME IN DENMARK PAPER 2: MUTATIONS IN DANISH PATIENTS WITH LONG QT SYNDROME AND IDENTIFICATION OF A LARGE FOUNDER FAMILY WITH P.F29L IN KCNH2 Table 1: Mutations identified in KCNQ1. ... 89
Table 2: Mutations identified in KCNH2... 90
Table 3: Mutations identified in SCN5A, KCNE1 or KCNE2. ... 91
Table 4: In silico functional analysis of missense variants. ... 92
Table 5: Haplotyping of the p.K101E and p.F29L families. The ancestral alleles are indicated blue or red text with regard to each mutation. Alleles are represented by approximate number of repeats. ... 93
Table 6: Distribution of mutations and mutation types in this study and four other large studies ... 93
CHAPTER 4: AN EXAMINATION OF PUTATIVE NOVEL GENETIC CAUSES OF ARRHYTHMIC SYNDROMES PAPER 3: THE ROLE OF CAV3 IN LONG QT SYNDROME: CLINICAL AND FUNCTIONAL ASSESSMENT OF A CAVEOLIN-3/KV11.1 DOUBLE HETEROZYGOTE VERSUS CAVEOLIN-3 SINGLE HETEROZYGOTE Table 1: Genetic variants in CAV3 and their frequency in a white population and LQTS ... 100
Table 2: Clinical characteristics of Caveolin-3:p.T78M carriers, an aggregation of data from Vatta et al and the present study ... 101
Page xviii Paper 4: MicroRNAs in Cardiac Arrhythmia: The Sequence Variation of miR-1 and miR-133a in Long QT Syndrome
Table 1: Gene information and primer sequences for mir-1-1, mir-1-2, mir-133a-1 and
mir 133a-2 amplification ... 128
CHAPTER 5: SODIUM CHANNEL DISEASE PAPER 5: FLECAINIDE PROVOCATION REVEALS CONCEALED BRUGADA SYNDROME IN A LONG QT SYNDROME FAMILY WITH A NOVEL L1786Q MUTATION IN SCN5A Table 1: Biophysical properties of INa recorded in HEK293 cells expressing WT Nav1.5 and L1786Q Nav1.5. *p<0.005, **p<0.005, ***p<0.001. ... 148
Table 2: Electrophysiological characteristics of mutations associated with a mixed LQTS and BrS phenotype... 148
PAPER 6: HIGH PREVALENCE OF LONG QT SYNDROME–ASSOCIATED SCN5A VARIANTS IN PATIENTS WITH EARLY-ONSET LONE ATRIAL FIBRILLATION Table 1: Clinical characteristics of the lone AF population (n=192) ... 160
Table 2: Summary of Nav1.5 sodium channel mutations and rare variants in SCN5A ... 162
Table 3: Clinical characteristics of probands with SCN5A variants ... 165
Table 4: Electrophysiological properties of wild-type and mutant Nav1.5 channels ... 166
CHAPTER 6: ION CHANNEL GENES IMPLICATED IN STRUCTURAL HEART DISEASE PAPER 7: THE KCNE GENES IN HYPERTROPHIC CARDIOMYOPATHY: A CANDIDATE GENE STUDY Table 1: Genetic variants within the KCNE genes identified in a Danish HCM cohort ... 173
Table 2: Primer sequences, amplicon size and melting temperatures for the KCNE gene mutation screening ... 174
Page xix
PREFACE
Long QT syndrome (LQTS) will be presented here as a paradigm of an inherited arrhythmia disorder. Such disorders are interesting as they increase the risk of developing syncope and sudden death. The problems associated with inherited arrhythmia disorders are that the genetic basis is not fully established, the knowledge of phenotype modifiers is lacking and clinical inference is not evidence based.
In Chapter 1, I will provide a general over view of the clinical definitions and genetic bases of LQTS, short QT syndrome and Brugada syndrome (BrS) in the form of two reviews [1, 2]. Additionally, I have included an editorial highlighting the implications and evidence base of LQTS testing in clinical practice [3].
In Chapters 2 and 3, the genetic aetiology of LQTS in South Africa and Denmark is described in two papers which document the results of comprehensive genetic screening in these
populations [4, 5].
In Chapter 4, CAV3 (encoding caveolin-3)was examined in a cohort of Danish and British LQTS probands and a genetic variant, which was identified in a family known to carry a KCNH2 (LQT2-causing gene) LQTS-causing mutation, was evaluated with respect to its aetiological and clinical significance [6]. Additionally, the role of microRNAs in LQTS was examined in a subset of this LQTS cohort [7].
In Chapter 5, the role that the SCN5A gene plays in the development of mixed/overlapping phenotypes is discussed in two papers. The first paper presents a complex phenotype
(LQTS/BrS) [8]; and the second paper deals with SCN5A mutations in atrial fibrillation patients and the prevalence of known LQT3-causing mutations in this group [9].
Patients with hypertrophic cardiomyopathy (HCM) are at risk of atrial and ventricular
arrhythmias and minK (encoded by KCNE1) is reported to form part of an “electro-mechanical feed-back” system which links cardiomyocyte stretching to changes in ion channel function. Consequently, in Chapter 6, genes which encode cardiac ion channel subunits were examined as possible causes of HCM [10].
These studies have substantially enhanced our understanding of LQTS and inherited arrhythmia disorders, and have contributed to the much needed evidence base for LQTS and, in doing so, expanded our understanding of SCD.
Page 1
CHAPTER 1: INTRODUCTION
1.1 THE HEART
The human heart is a muscular organ composed of four-chambers (Figure 1A) which, by rhythmic contractions, is responsible for pumping blood through the pulmonary and systemic circulation. Efficient functioning of the heart requires strict coordination of the particular functions of the pacemaker cells and cardiomyocytes within the myocardium (Figure 1B). These cells exhibit the characteristics of automaticity, excitability, conductivity and contractility. Automaticity, the ability to initiate an impulse (measured as an action potential (AP)), is a characteristic of pacemaker cells. Conductivity is the ability to propagate the AP to other areas of the heart. Excitability is the ability to respond to an impulse by depolarising and repolarising, thus propagating the AP. Finally, contractility is the ability of cardiomyocytes to mechanically respond to an electrical impulse by contracting.
Cardiac muscle is structurally different to skeletal muscle in that cardiomyocytes are connected to one another through interlocking, porous membranes (intercalated discs) at the ends of adjacent cells. Gap junctions within the intercalated discs create a continuous electromechanical syncytium, which allows the movement of ions and consequently the propagation of an AP throughout the myocardium [11, 12].
1.1.1 CONTRACTILITY
During a contraction (systole) both atria contract simultaneously, pumping blood to the ventricles – which subsequently contract, pumping the blood out of the heart. The right ventricle receives oxygen-poor venous blood from the right atrium and pumps it into the pulmonary circulation for gaseous exchange in the lungs. The left ventricle receives oxygen-rich arterial blood from the left atrium and pumps it into the systemic circulation (Figure 1). The four chambers of the heart each have a one-way valve to prevent blood from flowing backwards (Figure 1). To complete the contraction cycle (heartbeat), the heart muscle relaxes (diastole) which allows blood to fill the heart ready for the next contraction. The myocardium (layer of cardiac muscle within the heart wall) and the cardiac valves (tricuspid, pulmonary, mitral and aortic valves) (Figure 1) are key elements in ensuring the efficient pumping of blood through the heart. The contractility of the myocardium generates the force needed to circulate the blood and the valves ensure blood flows in the correct direction based on pressure differences across the valves.
Page 2
Figure 1: A. A schematic diagram depicting the chambers, valves and great vessels of the heart, blood flow is indicated by blue and red arrows. Blue arrows indicate the flow of de -oxygenated blood and the red arrows indicate the flow of oxygenated blood. B. A diagrammatic representation of the layers of the heart wall, the myocardium is the thick middle layer. Figures adapted from
http://www.nhlbi.nih.gov/health//dci/Diseases/hhw/hhw_anatomy.html and http://anatomyandphysiologyi.com/heart-anatomy/
1.1.2 AUTOMATICITY, EXCITABILITY AND CONDUCTIVITY
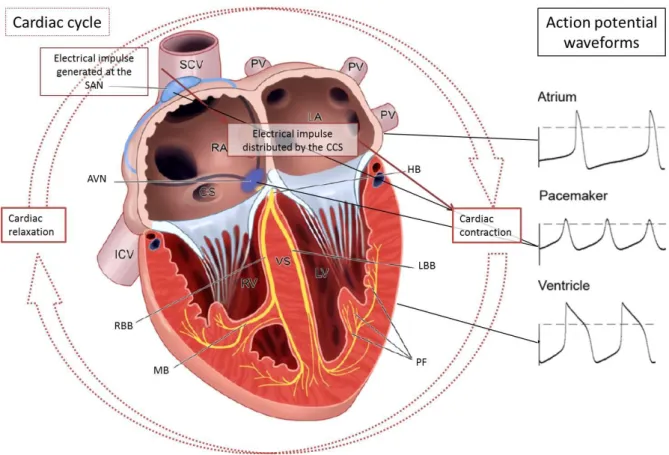
The efficient coordination of a synchronous heartbeat is maintained by the heart’s electrical system (Figure 2). All cardiomyocytes are excitable cells with respect to their ability to transmit an AP (Figure 2); while, automaticity is a specific characteristic of pacemaker cells. The cardiac conduction system (CCS) is responsible for the conduction of electrical impulses around the heart and is composed of several distinct anatomical structures that consist of highly specialised cardiomyocytes and conduction fibres (Figure 2). The sinoatrial node (SAN) is the pacemaker of the heart; electrical impulses are generated in the SAN more rapidly than any other part of the CCS. The propagation of the electrical impulse through the atrial wall initiates waves of
depolarisation that causes the atria to contract. The atrioventricular node (AVN) conducts the depolarising wave through to the ventricles. The impulse is then propagated through the bundle of His which is a band of atypical cardiac muscle fibres specialised for conduction that originates
Page 3 at the AVN, and then passes along the interventricular septum to the ventricles where it
branches into the left and right bundle branches (LBB and RBB, respectively). From the LBB and RBB the impulse is propagated on to the Purkinje fibre network which results in depolarisation of the ventricular cardiomyocytes and excitation-contraction [13].
Figure 2: A schematic representation of the cardiac cycle, components of the cardiac conduction system and action potential wave forms from particular areas of the heart.
AVN: atrioventricular node, CCS: cardiac conduction system, CS: coronary sinus, HB: bundle of His,
IVC: inferior vena cava, LBB: left bundle branch, LV: left ventricle, MB: moderator band, PF: Purkinje fibres,
PV: pulmonary vein, RA: right atrium, RBB: right bundle branch, RV: right ventricle, SAN: sinoatrial node,
SCV: superior caval vein, VS: ventricular septum. Figure adapted from [13, 14].
The human cardiac excitatory process was first mapped in normal hearts by Durrer et al.
(1970) [15]. Understanding this physiological process was the first step towards understanding abnormal electrical activity in arrhythmic diseases.
1.2 ELECTROCARDIOGRAM
The invention of Eithoven’s string galvanometer at the beginning of the 20th century provided the opportunity to assess the heart’s electrical activity in a non-invasive manner. The
galvanometer greatly improved the sensitivity of recording electrical potentials and led to the development of the ECG technology [16]. It became possible to classify clinically occurring arrhythmias as to their clinical presentation, mechanism and focal origin [17].
Page 4 The ECG uses twelve leads, each of which connects a surface-electrode to an amplifier within the ECG apparatus. The electrical activity from particular parts of the heart is measured based on the position of the lead on the body as shown in Figure 3. As the heart beats, the electrical information is translated into wave patterns; Einthoven labelled the ECG waves: P, Q, R, S and T; these labels are still the standard nomenclature when referring to ECG waves (Figure 3). The cardiac electrical impulse is generated in the SAN and spreads through both atria (Figure 2). This electrical activity is represented by the P-wave on an ECG trace (Figure 3). When the impulse reaches the AVN, the bundle of His is activated and the impulse spreads via the RBB and LBB (Figure 2) – depolarising the ventricles. Ventricular depolarisation is represented by the QRS complex on an ECG trace (Figure 3). The coordinated conduction of the impulse to both ventricles results in ventricular contraction. The repolarisation of the ventricles (return to normal resting potential) is represented by the T-waves on the ECG. Thus the QT interval represents the duration of the ventricular action potential (Figure 3).
Figure 3: A. Positions of ECG electrodes are indicated and labelled appropriately [18]. B. A schematic representation of the ventricular cardiomyocyte action potenti al which corresponds to the QT interval on an ECG trace. The phases of the action potential are indicated, these represent shifts in ion channel activity and consequent changes in membrane potential [19]. C. A representative diagram of single cycle ECG pattern, the P wave corresponds to the firing of the SA node and depolarization of the atria; the PR interval represents the delay of the electrical impulse at the AV node. The QRS complex corresponds to ventricular
depolarization while the T Wave represents ventricular repolarisation. Figure adapted from http://www.as.miami.edu/chemistry/2086/NEW -Chap20/NEW-Chapter%2020_part2.htm
As the QT interval is strongly influenced by the heart rate (RR interval), it is necessary to correct for this influence when reporting a QT interval. Several mathematical formulas have been developed in order to calculate the corrected QT (QTc) interval, QTc intervals reported throughout this thesis have been calculated using Bazett’s formula ( ) [20].
Page 5
1.3 CARDIAC ARRHYTHMIAS
Cardiac arrhythmias pose a significant health burden. The approximate ratios of people affected by particular heart rhythm disturbances are indicated in Table 1. Heart rhythm disturbances may abolish the synchronicity of the heartbeat, causing myocardial fibres to contract in a
random, uncoordinated fashion resulting in atrial fibrillation (AF) or ventricular fibrillation (VF) depending on which chambers are affected. As a consequence of the frequency and societal impact of cardiac arrhythmias, the molecular mechanisms involved in arrhythmogenesis or the molecular determinants of disease have become a focus of cardiac research [21].
Table 1: The proportion of the US population hospitalised or deceased as a result of arrhythmias in 2003, data taken from Rosamond et al. (2007) [22]. The ratios were calculated from the number of people hospitalised as a result of an arrhythmia as well as the number of people whose deaths were caused by arrhythmias in 2003. The number of people who developed arrhythmias or died as a result of an arrhythmia, which was a secondary complication to their condition, was not included.
Heart rhythm disturbance Approximate proportion of US population
Arrhythmia 1:300
AF 1:600
VT 1:3500
VF 1:40000
AF: atrial fibrillation, VF: ventricular fibrillation, VT: ventricular tachycardia.
1.3.1 TERMINOLOGY OF RHYTHM DISTURBANCES
The normal heart rhythm is referred to as the sinus rhythm (because is it paced by the SAN), which results in the regular (60-100 bpm) rhythm characteristic of a normal ECG pattern (Figure 3). A slower than normal heart rate is called a sinus bradycardia and a faster than normal heart rate is called a sinus tachycardia. An aberrant heart rhythm is referred to as an arrhythmia; if the arrhythmia coincides with a slow or fast heart rate, it is referred to as a bradyarrhythmia or a tachyarrhythmia, respectively.
Supraventricular tachycardias (SVTs) are atrial in origin and interfere with the efficient flow of blood into the ventricles. The most common SVTs are AF, atrioventricular nodal reentrant tachycardia (AVNRT) and atrioventricular reentrant tachycardia (AVRT). SVTs can be described as paroxysmal or incessant. A paroxysmal arrhythmia is an irregular rhythm that occurs
infrequently, comes and goes, lasts a few minutes to hours and then stops on its own. An incessant arrhythmia is a continuous arrhythmia which affects atrial contractions. This in turn affects the ventricles.
Ventricular tachycardias (VTs) are ventricular in origin; mild cases can effectively pump blood and maintain blood pressure. Serious cases, however, lead to VF, which leads to cardiac arrest,
Page 6 hypoxia and, without medical intervention will result in death.VTs can be described as
monomorphic or polymorphic. Monomorphic VT (MVT) manifests as a regular rhythm with similar QRS complexes in each ECG lead. Polymorphic VT (PVT) manifests as frequent changes morphology and axis of the QRS complexes on ECG. Furthermore, the duration of the VT
episodes is another means of classification. Episodes of VT which last more than 30 seconds are called sustained VTs, while those which self-terminate before 30 seconds are called
non-sustained VTs. These abnormalities often occur in people with structural heart problems, such as an infarct from a previous heart attack or rare inherited heart defects. Although the
functional substrate, transient initiating event and arrhythmia mechanism may differ in these two cases understanding the development of arrhythmias in inherited arrhythmic diseases may shed light on the mechanisms by which arrhythmias develop in coronary artery disease (CAD) and myopathy patients.
1.3.2 MECHANISMS OF ARRHYTHMIAS
There are three basic mechanisms of arrhythmias as illustrated in Figure 4: namely, increased automaticity, triggered activity and re-entry. Automaticity is a measure of the propensity of a fibre to initiate an impulse spontaneously. Increased automaticity causes arrhythmias by the inappropriate spontaneous depolarisation of cardiac tissue. Triggered activity relates to the occurrence of ‘afterdepolarisations’. These can occur before full repolarisation –
early-afterdepolarisations (EADs), or after full repolarisation - delayed-early-afterdepolarisations (DADs). These afterdepolarisations can become self-perpetuating if they reach threshold potential and trigger another afterdepolarisation, thereby generating an arrhythmia. Re-entry is the most common arrhythmia mechanism whereby a block of the electrical impulse causes a feedback “loop”.
Figure 4: Mechanisms of arrhythmia generation. In all panels Trace 1 (solid line) represents the normal condition A. Trace 2 (dotted line) represents increased automaticity, caused by inappropriate depolarisation and abnormally rapid firing. B.
Trace 2 represents an afterdepolarisation which has not reached the threshold necessary to become self-perpetuating. Trace 3 represents an afterdepolarisation which has reached threshold to result in a premature ectopic AP before the next expected normal AP. C. Re-entry occurring between two connected zones of tissue (I and II) - as shown on the right. Trace 2 represents a premature activation in zone II. This activation current fails to initiate firing in zone I because zone I is still refractory. Trace 3: This current may conduct back (red dashed line) to zone I at a time when it can respond with an AP. Trace 4: This AP may propagate to initiate in zone II, and the process can continue indefinitely. Image taken from [23].
AP: action potential, RP: refractory period, TP: threshold potential.
Page 7
1.4 SUDDEN CARDIAC DEATH
Sudden cardiac death (SCD), defined as death by cardiac causes occurring within one hour from the onset of symptoms [24], accounts for the worldwide loss of more than three million people per annum [25]. While the true incidence of SCD is difficult to determine [26], it has been estimated to range from 180,000- >450,000 [27] within the USA, this indicates that ~7-18% of mortality in the USA is attributed to SCD. Epidemiological studies suggest that ~90 % of SCD cases are a consequence of arrhythmias [28], consequently, a better understanding of arrhythmogenesis is required to address this issue [29].
Regardless of the underlying disease state, progression to SCD typically follows the same course: VT degenerates to VF and circulatory arrest and death [25, 30] as indicated in Figure 5.
Figure 5: Pathophysiology and epidemiology of SCD [31].
Page 8 To date, clinical surveys have failed to define risk markers which accurately predict the risk of SCD for individuals in the general population. Those risk factors which have been identified include: abnormal cardiovascular function, e.g. left ventricular ejection fraction (LVEF) [30]; electrocardiographic variables, e.g. QT and QRS measurements as well as T wave alternans [29]; abnormalities in electrophysiological testing [31]; variation in cardiac autonomic function e.g. heart rate variability and baroreflex sensitivity [24] and finally, ambient ventricular
arrhythmias [29, 30]. These predictors are appropriate for identifying risk of SCD in highly selected groups, such as those with CAD, congestive heart failure (CHF) and myocardial infarction (MI) survivors. However, as shown in Figure 6, these high risk groups make up a small proportion of total SCD cases per annum. Only 10% of SCD victims have a high risk profile [17]. Members of the general population have a low relative risk of SCD, but the absolute number of deaths is high [24, 29]. This indicates a need for more specific markers to identify risk in the general population.
Figure 6: SCD incidence and total events for various population pools, showing an inverse relationship between risk and total number of events [25].
AVID: Antiarrhythmics vs. Implantable Defibrillators Trial, CAD: coronary artery disease, CHF: congestive heart failure, Hx: history, LVEF: left ventricular ejection fraction, MADIT: Multicentre Automatic Defibrillator Implantation Trial,
MI: myocardial infarction, MUSTT: Multicentre Unsustained Tachycardia Trial, SCD-HeFT: Sudden cardiac death in Heart Failure Trial
A popular hypothesis is that SCD is an electrical mishap, whereby functional and structural substrates, modulated intrinsic or extrinsic triggers such as electrolyte imbalance or drug intake, impact on the potential arrhythmic mechanisms universal to all hearts (Figure 7).
Page 9
Figure 7: This Venn diagram indicates the potential interactions of various cardiac factors. The factors may modulate latent arrhythmogenic mechanisms capable of causing sudden death [29].
CAD – Coronary Artery Disease, DCM – Dilated Cardiomyopathy, EMD – Electromechanical dissociation,
HCM - Hypertrophic Cardiomyopathy, RVD – Right Ventricular Dysplasia, VT – Ventricular Tachycardia,
VF - Ventricular Fibrillation.
1.5 INHERITED ARRHYTHMIA DISORDERS
Primary arrhythmogenic disorders remain the single most important cause of SCD among young, healthy individuals living in industrialised nations [32]. Genetic factors have substantial effects in determining population-based risk for SCD and may also account for inter-individual variability in susceptibility [33]. Inherited arrhythmia disorders encompass a group of
syndromes with unique genetic defects and presentations but with very similar clinical outcomes and complications. Much progress has been made in identifying genes underlying various Mendelian disorders associated with inherited arrhythmia susceptibility.
1.5.1 LONG QT SYNDROME
Ventricular repolarisation as represented by the QT interval on an ECG recording (Figure 3 and Figure 8) is subject to a great deal of physiological variability with an upper limit of the QTc interval of 470ms in post-pubertal males and 480ms in post-pubertal females [34].
Pathologically prolonged QTc intervals are characteristic ECG findings in long QT syndrome (LQTS). QTc interval prolongation is a consequence of delayed cardiac repolarization which may be caused by mutations in the genes encoding cardiac ion channels or proteins which modulate
Page 10 their function; this form of LQTS is called congenital LQTS [1]. Alternatively, and more
frequently, delayed cardiac repolarisation and consequent QT prolongation may be acquired.
Figure 8: A. Normal and prolonged ventricular action potential . B. Normal and reduced IKr currents. C.
Normal and prolonged QT interval on an ECG. D. A schematic representation of Torsade de Pointes. Figure taken from [35].
The most frequent mechanism of acquired QT prolongation is the drug-induced inhibition of the IKr current (Figure 8). In both congenital and acquired LQTS, abnormal cardiac repolarisation predisposes to the development of torsades de pointes (TdP), a PVT frequently associated with LQTS and SCD (Figure 8). QTc prolongation is considered a marker of the arrhythmogenic potential of a drug. However, the relationship between QTc and SCD is unknown with no clearly defined QTc length which could be considered the “tipping point” of the risk for developing a potentially fatal arrhythmia [36]. A better understanding of the congenital form of LQTS will undoubtedly also improve our understanding of acquired LQTS.
Congenital LQTS is the focus of the work reported here and the acronym (LQTS) has been used to define the congenital form of LQTS, throughout. Reviews of the genetic bases of LQTS, SQTS and BrS, as well as an editorial describing the implications which LQTS genetic testing have for personalised medicine, follow.
Page 11
1.5.2 REVIEW 1: THE GENETIC BASIS OF LONG QT AND SHORT QT SYNDROMES: A
MUTATION UPDATE
Paula L. Hedley, Poul Jørgensen, Sarah Schlamowitz, Romilda Wangari, Johanna Moolman-Smook, Paul A. Brink, Valerie A. Corfield and Michael Christiansen.
Human Mutation 30:1486-1511, 2009.
(2012 Impact Factor of Human Mutation is 5.7)
Page 12
Page 13
Page 14
Page 15
Page 16
Page 17
Page 18
Page 19
Page 20
Page 21
Page 22
Page 23
Page 24
Page 25
Page 26
Page 27
Page 28
Page 29
Page 30
Page 31
Page 32
Page 33
Page 34
Page 35
Page 36
Page 37
Page 38
1.5.3 REVIEW 2: THE GENETIC BASIS OF BRUGADA SYNDROME: A MUTATION UPDATE
Paula L. Hedley, Poul Jørgensen, Sarah Schlamowitz, Johanna Moolman-Smook, Jørgen K. Kanters, Valerie A. Corfield and Michael Christiansen.
Human Mutation 30:1256-1266, 2009.
(2012 Impact Factor of Human Mutation is 5.7)
Page 39
Page 40
Page 41
Page 42
Page 43
Page 44
Page 45
Page 46
Page 47
Page 48
Page 49
Page 50
1.5.4 EDITORIAL: LONG QT TESTING: IMPLICATIONS FOR COMPLEX DIAGNOSIS IN
PERSONALISED MEDICINE
Michael Christiansen and Paula L. Hedley.
Personalized Medicine 7(2):125-127, 2010.
(2011 Impact Factor of Personalized Medicine is 1.5)
Page 51
Page 52
Page 53
Page 54
HYPOTHESIS
The primary hypothesis is that there are molecular causes of LQTS in South African and Danish families, and that the disease-causing mutations may be harboured in the 13 genes that have been previously implicated in this disorder in international studies. The causative relationships between mutations and disease should be carefully established. Additionally, we hypothesise that some of the as yet unaccounted for genetic causes of LQTS may be found in genetic rearrangements of these genes. Alternatively, genes involved in transcript regulation of these genes may be harbouring potentially pathogenic variants. Finally, we hypothesise that the phenotypic spectrum of LQTS-associated genes may be very broad comprising other arrhythmias and structural heart diseases.
AIM
The first facet of this project is the identification of the spectrum of LQTS-causative mutations, in previously identified genes, in South African and Danish population groups. The second facet involves the assessment of the evidence-base of “LQTS-associated genes” and the identification of novel genes involved in LQTS aetiology. Finally, the role LQTS-causing genes play in other phenotypes will be determined.
Page 55
CHAPTER 2: THE GENETIC AETIOLOGY OF LONG QT SYNDROME
IN SOUTH AFRICA
Page 56
PAPER 1: LONG QT SYNDROME IN SOUTH AFRICA: THE RESULTS OF
COMPREHENSIVE GENETIC SCREENING
Paula L. Hedley, Glenda A. Durrheim, Firzana Hendricks, Althea Goosen, Cathrine Jespersgaard, Birgitte Størvring, Tam T. Pham, Michael Christiansen, Paul A. Brink and Valerie A. Corfield.
Cardiovascular Journal of Africa 24(6):231-237, 2013.
(2011 Impact Factor of CVJA is 0.78)
Page 57
Page 58
Page 59
Page 60
Page 61
Page 62
Page 63
Page 64
CHAPTER 3: THE GENETIC AETIOLOGY OF LONG QT SYNDROME
IN DENMARK
Page 65
PAPER 2: MUTATIONS IN DANISH PATIENTS WITH LONG QT SYNDROME AND
IDENTIFICATION OF A LARGE FOUNDER FAMILY WITH P.F29L IN KCNH2
Michael Christiansen, Paula L Hedley, Juliane Theilade, Birgitte Støvring, Trond P. Leren, Ole Eschen, Karina M Sørensen, Anne Tybjærg-Hansen, Lilian B Ousager, Lisbeth N. Pedersen, Ruth Frikke-Schmidt, Frederik H. Aidt, Michael G Hansen, Jim Hansen, Poul E. Bloch Thomsen,
Egon Toft, Finn L Henriksen, Henning Bundgaard, Henrik K. Jensen, and Jørgen K Kanters.
BMC Medical Genetics SUBMITTED, 2013.
(2012 Impact Factor of BMC Genetics is 2.5)
Page 66
Page 67 ABSTRACT:
Background: Long QT syndrome (LQTS) is a cardiac ion channelopathy which presents clinically with palpitations, syncope or sudden death. More than 700 LQTS-causing mutations have been identified in 13 genes, all of which encode proteins involved in the execution of the cardiac action potential. The most frequently affected genes, covering > 90% of cases, are KCNQ1, KCNH2 and SCN5A.
Methods: We describe 64 different mutations in 70 unrelated Danish families using a routine five-gene screen, comprising KCNQ1, KCNH2 and SCN5A as well as KCNE1 and KCNE2.
Results: Twenty-two mutations were found in KCNQ1, 28 in KCNH2, 9 in SCN5A, 3 in KCNE1 and 2 in KCNE2. Twenty-six of these have only been described in the Danish population and 24 of these are novel. One compound heterozygote (1.4 % of families) was found. A founder mutation, p.F29L in KCNH2, was identified in 5 unrelated families. Disease association, in 31.2 % of cases, was based on the type of mutation identified (nonsense, insertion/deletion, frameshift or splice-site). In 22.7 % of missense mutations functional analysis was available. Only one novel missense mutation was not found to be possibly causative using either Polyphen-2, SIFT or Mutation Assessor prediction servers. None of the mutations were found in 364 Danish alleles and only three, all functionally characterised, in the Exome Variation Server, albeit at a frequency of < 1:1000.
Conclusion:
The genetic aetiology of LQTS in Denmark is similar to that found in other
populations. A large founder family with p.F29L in
KCNH2 was identified. In 48.4 % of
the mutations disease causation was based on mutation type or functional analysis.
Page 68
BACKGROUND
Long QT syndrome (LQTS) is a genetic disease of the cardiac electrical system which presents clinically with palpitations, syncope and sudden death [1, 2]. To date, more than
700 disease-causing mutations have been found in 13 genes [1-3] and the total number of mutations is probably even larger [4]. All these genes are directly or indirectly involved in the execution of the cardiac action potential (AP) [2]. LQTS is a consequence of a prolongation of the repolarisation phase of the AP, caused by decreased activity of the repolarising inward K+-currents, Iks and Ikr, or increased late activity of the outward depolarising Na+-current, INa. The delayed repolarisation leads to the appearance of early after depolarisations (EADs), due to enhancement of the Na+/Ca2+-exchanger and the L- type Ca2+ channel [5]. These, together with increased
refractoriness, may trigger malignant arrhythmias [2].
In Denmark, genetic diagnostics of LQTS has been performed since 1996. From 2006 the
management of LQTS patients has followed national guidelines [6]. The genetic diagnostic work is centred in five University cardiology clinics and patients are offered a five-gene screen of the most frequently affected genes, KCNQ1, KCNH2, SCN5A, KCNE1 and KCNE2. Initially, the screen was performed using single strand conformation polymorphism analysis (SSCP) of the coding regions of the genes with intronic amplification primers [7-9]. In recent years, the mutation analysis has been performed by bi-directional Sanger sequencing of coding regions and all previous patients have been re-analysed. Here we report the disease-causing mutations identified in Danish LQTS families during the preceding 15 years. Furthermore, as the evidence base for considering mutations disease-causing is not always clear [10], and rare variants not associated with disease are found in controls [11], we report our reasoning for considering them disease- causing. Finally, we compare the distribution of mutations with that found in other population studies.

![Figure 3: A. Positions of ECG electrodes are indicated and labelled appropriately [18]](https://thumb-us.123doks.com/thumbv2/123dok_us/1580928.2712555/24.892.114.780.507.857/figure-positions-ecg-electrodes-indicated-labelled-appropriately.webp)


![Figure 5: Pathophysiology and epidemiology of SCD [31].](https://thumb-us.123doks.com/thumbv2/123dok_us/1580928.2712555/27.892.135.756.420.1060/figure-pathophysiology-epidemiology-scd.webp)
![Figure 6: SCD incidence and total events for various population pools, showing an inverse relationship between risk and total number of events [25]](https://thumb-us.123doks.com/thumbv2/123dok_us/1580928.2712555/28.892.219.672.495.730/figure-incidence-events-various-population-showing-inverse-relationship.webp)