doi:10.3168/jds.2007-0786
©American Dairy Science Association, 2008.
Effects of Grass Silage and Soybean Meal Supplementation on Milk
Production and Milk Fatty Acid Profiles of Grazing Dairy Cows
O. A. Rego,*1S. M. M. Regalo,* H. J. D. Rosa,* S. P. Alves,†‡ A. E. S. Borba,* R. J. B. Bessa,† A. R. J. Cabrita,§ and A. J. M. Fonseca‡
*Centro de Investigac¸a˜o e Tecnologia Agra´ria dos Ac¸ores, Departamento de Cieˆncias Agra´rias, Universidade dos Ac¸ores, 9701-851 Angra do Heroı´smo, Portugal
†Rede de Quı´mica e Tecnologia (REQUIMTE), Unidade de Produc¸a˜o Animal, Instituto Nacional de Recursos Biolo´gicos, Fonte Boa, 2005-048 Vale de Santare´m, Portugal
‡REQUIMTE, Instituto de Cieˆncias Biome´dicas de Abel Salazar (ICBAS), and
§REQUIMTE, Secc¸a˜o Auto´noma de Engenharia das Cieˆncias Agra´rias (SAECA), Faculdade de Cieˆncias, Universidade do Porto, Campus Agra´rio de Vaira˜o, Rua Padre Armando Quintas, 4485-661 Vaira˜o VC, Portugal
ABSTRACT
The effects of supplementation with grass silage and replacement of some corn in the concentrate with soy-bean meal (SBM) on milk production, and milk fatty acid (FA) profiles were evaluated in a replicated 4 ×4 Latin square study using 16 dairy cows grazing pasture composed of ryegrass, Kentucky bluegrass, and white clover. Each experimental period lasted for 3 wk. The 4 dietary treatments were PC, 20 h of access to grazing pasture, supplemented with 6 kg/d of corn-based concen-trate mixture (96% corn; C); PCSB, 20 h of access to grazing pasture, supplemented with 6 kg/d of corn- and SBM-based concentrate mixture (78% corn and 18% SBM; CSB); SC, 7 h of access to grazing pasture during the day and 13 h of ad libitum access to grass silage at night, supplemented with 6 kg/d of C concentrate; and SCSB, 7 h of access to grazing pasture during the day and 13 h of ad libitum access to grass silage at night, supplemented with 6 kg/d of CSB concentrate. The con-centrate mixtures were offered twice each day in the milking parlor and were consumed completely. Grass silage supplementation reduced dietary crude protein and concentration of total sugars, and dietary SBM in-clusion increased dietary crude protein concentration and decreased dietary starch concentration. Milk yield and energy-corrected milk were increased by SBM sup-plementation of cows with access to grass silage. Milk protein concentration was lower in cows offered grass silage, regardless of whether SBM was fed. Dietary SBM inclusion tended to increase milk fat concentration. Plasma urea N was reduced by silage feeding and in-creased by SBM supplementation. Supplementation with grass silage overnight could represent a useful
Received October 17, 2007. Accepted March 31, 2008.
1Corresponding author: orego@uac.pt
strategy for periods of lower pasture availability. Dietary inclusion of SBM in solely grazing cows had no effects on milk production and composition, exacerbated the inefficient capture of dietary N, and increased diet cost. Grass silage supplementation affected milk FA profiles, increasing both the FA derived from de novo synthesis and those derived from rumen microbial biomass, and decreasing the sum of C18 FA (mostly derived from diet or from mobilization of adipose tissue reserves). Milk fat concentrations of conjugated linoleic acidcis-9,trans-11, vaccenic acid (18:1trans-11), and linolenic acid (18:3n-3) were unaffected by grass silage supplementation, sug-gesting that partial replacement of pasture by unwilted grass silage does not compromise the dietary quality of milk fat for humans.
Key words:dairy cow, grass silage and protein supple-mentation, grazing, milk fatty acid
INTRODUCTION
The Azorean archipelago, located in the Atlantic Ocean, is an important dairy region, being responsible for 27% of the total milk production of Portugal. In con-trast to the dairy production systems of mainland Portu-gal, where cows are confined all year round and fed diets based on corn silage supplemented with high amounts of compound feeds, the climatic conditions of the Azores allow the grazing of animals throughout the year. This could be an advantage because intensive pasture-based systems could contribute to increased profitability and reduced feed costs (Clark and Kanneganti, 1998). How-ever, the increase in the genetic potential of the animals in recent years has led to a higher utilization of com-pound feeds, because pasture does not meet the nutrient requirements for high-producing dairy cows (Kolver and Muller, 1998). Indeed, 2 factors that limit milk produc-tion on pasture are low DMI (Bargo et al., 2003) and a high content of highly degradable CP relatively to NSC
(Carruthers et al., 1997; Mulligan et al., 2004). The low ruminal N capture contributes to both N pollution and to increased energetic expenditure for urea synthesis (Kolver and Muller, 1998). Therefore, one of the chal-lenges of using pasture is maximizing ruminal N cap-ture. This is often achieved by offering a compound feed consisting mainly of grain, with the type and processing method of grains having different effects (Reis and Combs, 2000; Wu et al., 2001; Mulligan et al., 2004).
The increase in the genetic potential of the animals in this region has also led to supplementation during the periods of lower pasture availability (winter) with conserved forages, mainly grass silage obtained from pasture in spring. The high level of CP, particularly NPN, means that additional supplementation with true protein may be beneficial for stimulating rumen fermen-tation and for increasing AA absorption (Brito et al., 2007). This study was designed to evaluate the effects of grass silage supplementation and the replacement of part of the corn in a concentrate with soybean meal (SBM) on the productive response of grazing dairy cows during winter. Additionally, it is well known that grazing dairy cows produce milk with a more favorable fatty acid (FA) profile for human health—with increased concen-trations of rumenic acid [18:2cis-9,trans-11, hereafter termed conjugated linoleic acid (CLA) cis-9, trans-11], vaccenic acid (18:1trans-11), and linolenic acid (18:3n-3)—than milk from confined cows fed diets based on conserved forages (Dewhurst et al., 2006). Moreover, milk FA profiles have recently been used in assessing rumen function (Cabrita et al., 2003; Vlaeminck et al., 2006).
MATERIALS AND METHODS
Pasture
The feeding trial was conducted at the Dairy Unit of the Department of Agriculture Sciences, University of Azores (Portugal), from January 5 to March 30, 2005, following the European Union animal welfare Directive Number 86/609/EEC. This unit has approximately 60 milking cows, with a mean 305-d lactation record in 2005 of 7,000 kg. Animals had access to a permanent pasture comprising approximately 76% ryegrass (Lolium per-enne), 14% Kentucky bluegrass (Poa pratensis), 5% white clover (Trifolium repens), and 5% weeds and dead mat-ter. Cows grazed paddocks of 2 ha, divided by traditional stone walls, at a herbage allowance of 28 kg of DM/ cow per d. Pregrazing pasture mass (kg of DM/ha) was measured by cutting 6 quadrats (0.25 m2) to ground level
at 3-d intervals. Target herbage masses varied between 2,600 and 2,900 kg of DM/ha. Strips were grazed for 1 d, and were delimited by mobile electric fences. Drinking water was always available at pasture.
Design, Diets, and Management
Sixteen multiparous [parity number 3.5 (SD = 1.0)] Holstein cows averaging 547 kg of BW (SD = 51.0), 145 DIM (SD = 43.7), and 24 kg of milk/d (SD = 4.6) were used. Cows were grouped according to milk production, parity, and DIM and randomly assigned to dietary treat-ment sequences in a changeover design (four 4×4 Latin squares). Each experimental period lasted for 3 wk. The 4 dietary treatments werePC, 20 h of access to grazing pasture, supplemented with 6 kg/d of corn-based concen-trate mixture (96% corn; Table 1; C); PCSB, 20 h of access to grazing pasture, supplemented with 6 kg/d of corn- and SBM-based concentrate mixture (78% corn and 18% SBM; Table 1;CSB);SC, 7 h of access to grazing pasture during the day and 13 h of ad libitum access to grass silage at night, supplemented with 6 kg/d of C concentrate; andSCSB, 7 h of access to grazing pasture during the day, and 13 h of ad libitum access to grass silage at night, supplemented with 6 kg/d of CSB concen-trate. Grass silage was prepared, during late May, from regrowth pasture sections (target areas of pasture were fertilized with 120 kg of N/ha and closed for 7 wk). Grass silage was harvested directly with a precision-chop har-vester (FX 40, New Holland, Carnaxide, Portugal) at a theoretical chop length of 20 mm, and ensiled in a bunker silo with the use of a silage additive (Biomax;
Lactobacil-lus plantarum and Pediococcus pentosaceus; Vetagri,
Cantanhede, Portugal), applied at a rate of 2 L/t of green forage. The silo was opened after 6 mo. The raw materi-als were ground through a hammer mill with a 4-mm screen, and the concentrate mixtures were prepared in a single batch. The concentrate mixtures (3 kg) were offered twice each day in the milking parlor and were consumed completely. Cows supplemented with grass silage were housed at night (1800 h) and individually fed in a tie-stall barn, and had continuous access to water. Grass silage was offered for ad libitum intake, with fresh feed offered each night (1800 h). The troughs were cleaned out each morning and orts were collected and weighed throughout the experiment. Grass silage offered was adjusted each week to produce weighbacks of approximately 15% of amounts fed. Samples of pasture, grass silage, concentrates, and orts were sampled daily during the last 5 d of each period and, after oven DM determination (65°C, 48 h), were composited by period. Total DMI was predicted according to NRC (2001) [equa-tion [1-2] in NRC (2001); DMI = (0.372×FCM + 0.0968
×BW0.75)×(1−e[−0.192×(wk of lactation+3.67)])], and the DMI of pasture was calculated by difference. Cows were milked twice daily at 0730 and 1530 h.
Milk production was measured throughout the experi-mental period. Milk was sampled at both milkings on 2 consecutive days during the last week of each
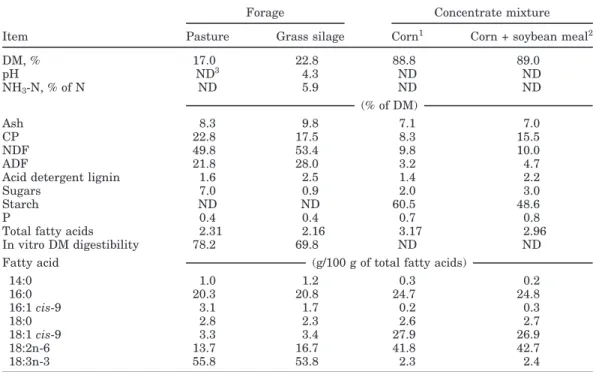
experimen-Table 1.Chemical analysis and fatty acid composition of experimental feeds
Forage Concentrate mixture
Item Pasture Grass silage Corn1 Corn + soybean meal2
DM, % 17.0 22.8 88.8 89.0 pH ND3 4.3 ND ND NH3-N, % of N ND 5.9 ND ND (% of DM) Ash 8.3 9.8 7.1 7.0 CP 22.8 17.5 8.3 15.5 NDF 49.8 53.4 9.8 10.0 ADF 21.8 28.0 3.2 4.7
Acid detergent lignin 1.6 2.5 1.4 2.2
Sugars 7.0 0.9 2.0 3.0
Starch ND ND 60.5 48.6
P 0.4 0.4 0.7 0.8
Total fatty acids 2.31 2.16 3.17 2.96
In vitro DM digestibility 78.2 69.8 ND ND
Fatty acid (g/100 g of total fatty acids)
14:0 1.0 1.2 0.3 0.2 16:0 20.3 20.8 24.7 24.8 16:1cis-9 3.1 1.7 0.2 0.3 18:0 2.8 2.3 2.6 2.7 18:1cis-9 3.3 3.4 27.9 26.9 18:2n-6 13.7 16.7 41.8 42.7 18:3n-3 55.8 53.8 2.3 2.4
196% corn grain, 0.5% salt, and 3.5% mineral premix (Minervet 2/1, Vetagri Alimentar SA, Cantanhede,
Portugal).
278% corn grain, 18% soybean meal, 0.5% salt, and 3.5% mineral and vitamin premix (Minervet 2/1,
Vetagri Alimentar SA).
3Not determined.
tal period, and proportional composites were analyzed for fat and protein. Milk fat was isolated from individual milk samples, collected on the last day of milk sampling, by centrifugation for 15 min at 822×gand immediately stored at −15°C until FA analysis. On the same day, blood samples were collected into heparinized tubes from the jugular vein of each cow after the a.m. milking. Sam-ples were immediately centrifuged at 822×gfor 10 min, and the plasma was stored at−15°C before analysis for BUN. Cows were weighed at the same time of the day (following the a.m. milking) on the 2 final days of each experimental period.
Duodenal flow of purine bases (PB) was predicted from milk secretion of odd- and branched-chain FA as de-scribed by Vlaeminck et al. (2005) [equation [5] in Vlae-minck et al. (2005); duodenal flow of PB (g/d) = 1.10× milk secretion of odd- and branched-chain FA (g/d)]. The milk secretion of odd- and branched-chain FA (g/d) was calculated as milk fat (kg/d)×0.933×FA (g/100 g)×10.
Chemical Analysis
Samples of feeds from the last week of each experimen-tal period were submitted for chemical analysis. The pH and the NH3-N concentration of grass silage were
determined, in fresh samples, with a pH electrode (no.
209811250, Ingold, Mettler-Toledo Inc., Columbus, OH) and according to Conway (1957), respectively. Ground samples (1 mm) were analyzed for ash (AOAC, 1990; method 942.05) and Kjeldahl N (AOAC, 1990; method 954.01). Crude protein was calculated as Kjeldahl N× 6.25. Neutral detergent fiber, ADF, and acid detergent lignin were determined by the detergent procedures of Van Soest et al. (1991) and Robertson and Van Soest (1981), withα-amylase being added for concentrates dur-ing NDF extraction; sodium sulfite was not added. Neu-tral detergent fiber was expressed without residual ash. Total sugars were determined by an official Portuguese standard method (Norma Portuguesa 1785, 1986) based on the Luff-Schoorl methodology, after extracting sugars with an ethanol solution. Phosphorous was determined by the gravimetric procedure described by the official Portuguese standard method (Norma Portuguesa 873, 1997). Starch was analyzed on finely ground samples (0.5-mm screen) by using the method described by Salo-monsson et al. (1984). In vitro DM digestibility of grass silage and pasture was analyzed by the 2-stage method of Tilley and Terry (1963). Milk fat and protein were determined by automated infrared analysis with a Mil-koScan 605 instrument (Foss Electric, Hillerød, Den-mark; AOAC, 1990). Jugular plasma was analyzed for urea N (AUG40 Automated Chemistry Analyzer,
Olym-pus, Melville, NY) by an enzymatic (urease) method as described by Bauer (1982).
Fatty acid methyl esters of feed lipids were prepared by a one-step extraction transesterification procedure using toluene, according to Sukhija and Palmquist (1988). The internal standard was heptadecanoic acid. For milk FA analysis, 200 mg of the milk fat layer was weighed into culture tubes, and milk lipids were ex-tracted according to the procedure of Folch et al. (1957). Solvents were then evaporated under N, and FA methyl esters were prepared by base-catalyzed transesterifica-tion with sodium methoxide (Christie, 2004). Fatty acid methyl esters were analyzed with an HP6890 gas chro-matograph (Agilent Technologies Inc., Palo Alto, CA), equipped with a flame-ionization detector, and a fused-silica capillary column (CP-Sil 88, 100 m ×0.25 mm × 0.20 m, Chrompack CP 7489, Varian Inc., Walnut Creek, CA). The carrier gas was helium, and the split ratio was 1:50. The injector temperature was 250°C, and the detector temperature was 280°C. The initial oven temperature of 100°C was held for 15 min, then in-creased at 10°C/min to 150°C, where it was held for 5 min, then increased at 1°C/min to 158°C and held for 30 min, and then increased at 1°C/min to 200°C and held for 40 min. Peak identification was based on co-chromatography with known standards of FA methyl esters (Sigma, St. Louis, MO) and, when no commercial standards were available, by using published chromato-grams obtained with similar analytical conditions (Cruz-Hernandez et al., 2004; Alves et al., 2006).
Statistical Analysis
Data from the last week of each experimental period and FA profiles of milk samples were analyzed as repli-cated 4×4 Latin squares by using the MIXED procedure of SAS (SAS Institute Inc., Cary, NC). The model in-cluded the fixed effects of square, period, grass silage supplementation, type of concentrate, and the interac-tion of grass silage supplementainterac-tion × type of concen-trate, the random effect of cow within square, and the random residual error. Differences among treatments were considered to be significant whenP<0.05, whereas whenP>0.05 but<0.10, differences were considered to indicate a trend toward a significant effect.
RESULTS AND DISCUSSION
The chemical and FA compositions of the pasture, grass silage, and concentrate mixtures are given in Table 1. Pasture was relatively high quality, averaging (DM basis) 22.8% CP, 49.8% NDF, 7.0% total sugars, and 78.2% in vitro DM digestibility. Grass silage pH and NH3-N were, respectively, 4.3 and 5.9% of total N,
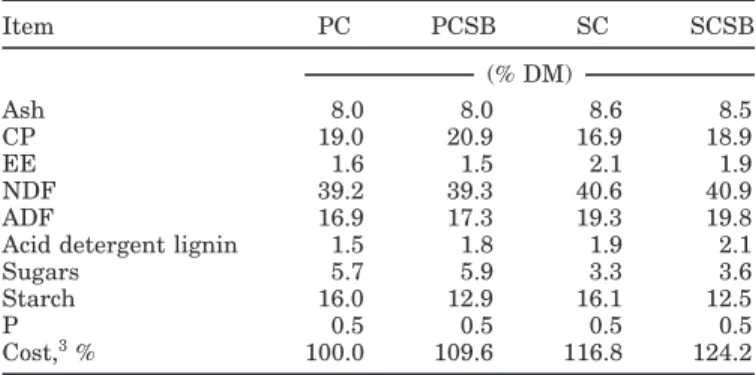
sug-Table 2.Estimated nutrient composition of total diets1,2
Item PC PCSB SC SCSB (% DM) Ash 8.0 8.0 8.6 8.5 CP 19.0 20.9 16.9 18.9 EE 1.6 1.5 2.1 1.9 NDF 39.2 39.3 40.6 40.9 ADF 16.9 17.3 19.3 19.8
Acid detergent lignin 1.5 1.8 1.9 2.1
Sugars 5.7 5.9 3.3 3.6
Starch 16.0 12.9 16.1 12.5
P 0.5 0.5 0.5 0.5
Cost,3% 100.0 109.6 116.8 124.2
1PC = 20 h of access to grazing pasture, supplemented with 6 kg/
d of corn-based concentrate mixture (C); PCSB = 20 h of access to grazing pasture, supplemented with 6 kg/d of corn- and soybean meal-based concentrate mixture (CSB); SC = 7 h of access to grazing pasture during the day and 13 h of ad libitum access to grass silage at night, supplemented with 6 kg/d of C concentrate; SCSB = 7 h of access to grazing pasture during the day and 13 h of ad libitum access to grass silage at night, supplemented with 6 kg/d of CSB concentrate.
2Estimated by using the average chemical composition of pasture
and supplements, and weighing them according to estimated DMI (Table 3).
3Calculated in relation to the cost of the PC diet (according to feed
costs in the Azores in February 2008).
gesting that silage was well preserved. The concentra-tions (DM basis) of CP (17.5%) and NDF (53.4%) as well as the in vitro DM digestibility (69.8%) of the grass silage also suggested that it was of relatively high nutritive value. The chemical composition of the concentrate mix-tures agreed closely with the ingredient composition. The corn-based concentrate contained (DM basis) 8.3% CP and 60.5% starch, and the CSB concentrate contained 15.5% CP and 48.6% starch. Pasture and grass silage were both good sources of linoleic acid (18:2n-6; 13.7 and 16.7% of total FA, respectively) and linolenic acid (18:3n-3; 55.8 and 53.8% of total FA, respectively). Concentrate FA compositions were very similar. The most representa-tive FA were oleic acid (18:1cis-9) and 18:2n-6, agreeing with the FA composition of corn grain. Estimated nutri-ent composition of the total diets (Table 2) showed that grass silage supplementation reduced dietary CP and total sugar concentrations. Dietary SBM inclusion in-creased dietary CP concentration and dein-creased dietary starch concentration.
Feed Intake
The estimation of intake by grazing cows is more com-plicated than that of confined cows. Despite the availabil-ity of several methods based on pasture and animal char-acteristics to estimate pasture intake (e.g., sward-cut-ting technique, estimation of diet digestibility, and fecal production using markers such as chromium oxide and alkanes; Bargo et al., 2003), in the present study, pasture
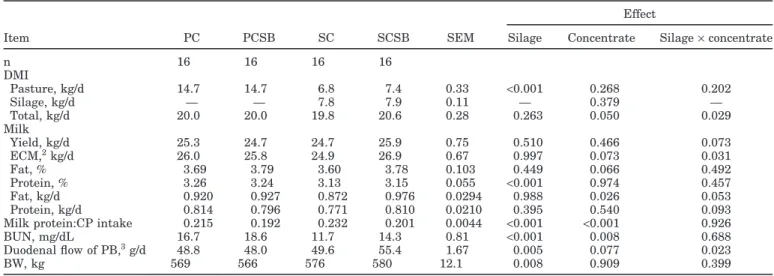
Table 3.Least squares means for DMI, milk production, milk composition, BUN, predicted duodenal flow of purine bases (PB), and BW from the different dietary treatments1
Effect
Item PC PCSB SC SCSB SEM Silage Concentrate Silage×concentrate
n 16 16 16 16 DMI Pasture, kg/d 14.7 14.7 6.8 7.4 0.33 <0.001 0.268 0.202 Silage, kg/d — — 7.8 7.9 0.11 — 0.379 — Total, kg/d 20.0 20.0 19.8 20.6 0.28 0.263 0.050 0.029 Milk Yield, kg/d 25.3 24.7 24.7 25.9 0.75 0.510 0.466 0.073 ECM,2kg/d 26.0 25.8 24.9 26.9 0.67 0.997 0.073 0.031 Fat, % 3.69 3.79 3.60 3.78 0.103 0.449 0.066 0.492 Protein, % 3.26 3.24 3.13 3.15 0.055 <0.001 0.974 0.457 Fat, kg/d 0.920 0.927 0.872 0.976 0.0294 0.988 0.026 0.053 Protein, kg/d 0.814 0.796 0.771 0.810 0.0210 0.395 0.540 0.093
Milk protein:CP intake 0.215 0.192 0.232 0.201 0.0044 <0.001 <0.001 0.926
BUN, mg/dL 16.7 18.6 11.7 14.3 0.81 <0.001 0.008 0.688
Duodenal flow of PB,3g/d 48.8 48.0 49.6 55.4 1.67 0.005 0.077 0.023
BW, kg 569 566 576 580 12.1 0.008 0.909 0.399
1PC = 20 h of access to grazing pasture, supplemented with 6 kg/d of corn-based concentrate mixture (C); PCSB = 20 h of access to grazing
pasture, supplemented with 6 kg/d of corn- and soybean meal-based concentrate mixture (CSB); SC = 7 h of access to grazing pasture during the day and 13 h of ad libitum access to grass silage at night, supplemented with 6 kg/d of C concentrate; SCSB = 7 h of access to grazing pasture during the day and 13 h of ad libitum access to grass silage at night, supplemented with 6 kg/d of CSB concentrate.
2Calculated as (0.324×kg of milk) + (12.95×kg of milk fat) + (7.20×kg of milk protein).
3Predicted from milk secretion of odd- and branched-chain fatty acids as described by Vlaeminck et al. (2005) {equation [5] in Vlaeminck
et al. (2005); duodenal flow of PB (g/d) = 1.10×milk secretion of odd- and branched-chain fatty acids [g/d; calculated as milk fat (kg/d)× 0.933×fatty acids (g/100 g)×10]}.
intake was estimated by difference using the equation proposed by NRC (equation [1–2] in NRC, 2001). Bargo et al. (2003) compared the estimation of DMI obtained by the use of several equations with that obtained by the use of chromium oxide as a fecal marker and con-cluded that the NRC (2001) equation was accurate and had the advantage of being simpler and of requiring only animal factors (FCM, BW, and week of lactation). As in the present study, similarly to the above-mentioned study (Bargo et al., 2003), cows were in midlactation, producing approximately 25 kg of milk/d and supple-mented with 6 kg/d of C, the DMI estimation was ex-pected to be reliable.
Effects on feed intake are presented in Table 3. Grass silage supplementation did not affect total DMI, with the silage×concentrate interaction suggesting that dietary SBM inclusion promoted higher DMI when cows were also supplemented with grass silage. However, caution should be used when interpreting these results because of the limitations in the way total DMI was estimated: cows on treatment SCSB produced more milk (and ECM; Table 3), which would lead to a greater estimate of total DMI. The greater milk production observed with treat-ment SCSB could be due to a greater DMI, to a greater efficiency of nutrient use for milk synthesis, or both.
Milk Production and Milk Composition
Effects on milk production, milk composition, BW, BUN, and predicted duodenal flow of PB are presented
in Table 3. Milk yield and ECM were not affected by silage supplementation. However, replacing part of the corn grain (18%) in the concentrate by SBM (true pro-tein) tended to increase milk yield (P = 0.073) and in-creased ECM in cows with access to silage, whereas there was no effect in cows that were solely grazing. The positive effects could reflect an improvement in ruminal fermentation. Indeed, because the ensiling process in-creases NPN content, replacing part of the corn with a true protein source (SBM) will eventually benefit micro-bial growth through supplying preformed AA (Brito et al., 2007), as well as through the effects on rumen pH (lower dietary starch concentration). Indeed, predicted duodenal flow of PB increased with dietary SBM inclu-sion, suggesting a higher rumen microbial activity. How-ever, this was not reflected in higher milk protein con-tent, and increased the cost of supplement (Table 2).
Grass silage supplementation decreased milk protein concentration, although milk protein production was not affected. Milk protein content of grazing dairy cows tends to be reduced by dietary grass silage inclusion, particu-larly when cows have ad libitum access to pasture (Phil-lips, 1988). This could arise from either the reduction in total energy intake or the low N retention of grass silage compared with fresh herbage. Phillips and Leaver (1985) found that milk protein content tended to be reduced even when total energy intake was increased by grass silage supplementation. The effect of dietary SBM inclu-sion on milk protein production of cows having access
to grass silage reflects the higher milk production. Milk fat concentration (P = 0.066) and production were in-creased by dietary SBM inclusion. These results agree with the lower starch content of treatments PCSB and SCSB (Table 2). It is well known that postruminal glu-cose and ruminal propionic acid preferentially channel nutrients to adipose tissue, resulting in a shortage of nutrients at the mammary gland and thus milk fat de-pression (glucogenic-insulin theory; Brockman and Laarveld, 1986). Silage supplementation led to an im-provement in the BW of cows, as in previous studies (Crosse and Gleeson, 1987; O’Brien et al., 1996).
The conversion of dietary N into milk N was lower in solely grazing cows than in grass silage-supplemented cows, and this efficiency was decreased by dietary SBM inclusion (Table 3). Indeed, grass silage supplementation decreased BUN, and the dietary SBM inclusion in-creased BUN. These results agree with dietary CP con-centration and suggest an inefficient capture of pasture N that is even greater with SBM supplementation. Therefore, the present study does not support the use of SBM in pasture diets because of the higher energy expenditure for excretion of N as well as for the higher cost of the diet (Table 2).
Milk FA
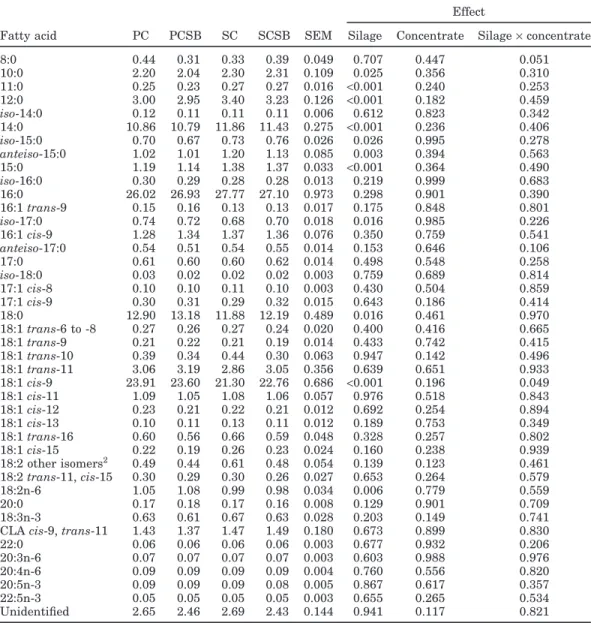
The dietary effects on milk FA profiles are given in Table 4. Grass silage supplementation had only a minor, but significant, effect on milk FA, whereas the type of concentrate did not affect them. Allowing ad libitum access to grass silage during the night increased 10:0, 11:0, 12:0, 14:0,iso-15:0,anteiso-15:0, and 15:0, and de-creasediso-17:0, 18:0, 18:1cis-9, and 18:2n-6. Thus, si-lage supplementation increased the FA derived from de novo synthesis (sum of short and medium even-chained saturated FA; 8:0 to 14:0) from 16.3 to 17.6 (% of total FA), and the FA derived from rumen microbial biomass (sum of odd- and branched-chain FA) from 5.8 to 6.2 (% of total FA). Moreover, grass silage supplementation decreased the sum of C18 FA, mostly derived from diet or from mobilization of adipose tissue reserves from 46.8 to 44.1 (% of total FA). Because body fat mobilization is not expected to be of great importance in cows averaging 145 DIM, the reduction of C18 FA could be explained by a lower intake of these FA. The content of total lipids of silages is generally lower than that of the original grass (Dewhurst and King, 1998). Moreover, ensiling leads to an extensive lipolysis of forage lipids, and thus to a substantial increase in NEFA (Vanhatalo et al., 2007). Nevertheless, in the present trial the differences in FA concentration between pasture and silage were small and the estimated FA intake (499±6.39 g/d) was not affected by treatments. Additionally, the increase in
microbial FA could reflect an improvement in rumen fermentation, and hence higher availability of VFA for de novo synthesis of FA, which could dilute the C18 FA. Milk PUFA concentration averaged 4.2% of total FA, and it was unaffected by treatments. Together, 18:2n-6 and 18:3n-3 constituted 41% of milk PUFA, and this proportion was also unaffected by treatments, in spite of the significant, but small, effect observed on 18:2n-6. Overall, these minor effects could be justified by the small differences between the FA composition of pasture and grass silage used (Table 1). Fatty acid composition of milk produced by grazing cows has consistently higher content of unsaturated FA, particularly of CLA cis-9,
trans-11, 18:1trans-11, and 18:3n-3. Hence, it is
consid-ered to be healthier than milk from confined cows fed diets based on conserved forages (Dewhurst et al., 2006). In the present experiment, the milk FA profile is consis-tent with milk from pasture-fed cows (Dewhurst et al., 2006; Elgersma et al., 2006), and the inclusion of silage did not change it. Additionally, the concentration of CLA
cis-9, trans-11 was high (1.44% of total FA) and was
highly correlated with 18:1trans-11 (r = 0.87, n = 64), as reported by others (Jahreis et al., 1997; Chilliard et al., 2003). Elgersma et al. (2006) reviewed the concentra-tion of CLAcis-9,trans-11 in milk fat; the level of CLA
cis-9, trans-11 reported here was similar to milk from
grazing cows in Ireland and New Zealand and was sur-passed only by milk from cows grazing in the Alpine highlands. The large variation observed in CLA cis-9,
trans-11 and 18:1trans-11 concentrations in milk fat of
individual cows (0.28 to 4.11% and 0.71 to 6.96% of total FA, respectively) has been observed in other studies (Kelly et al., 1998; Rego et al., 2004) and has been attrib-uted to individual differences in the activity of∆9 -desa-turase in animal tissues (Salter et al., 2007).
CONCLUSIONS
Although supplementation with grass silage overnight led to reduced milk protein concentration, there was no effect on the milk production of grazing dairy cows, so it could represent a useful strategy for periods of lower pasture availability. Dietary inclusion of SBM was bene-ficial in cows supplemented with silage. Its inclusion in solely grazing cows had no effect on milk production and composition, exacerbated the inefficient capture of dietary N, and increased diet cost. Milk FA profiles were consistent with milk from pasture-fed cows in earlier work, with the concentration of CLAcis-9,trans-11 being high. Grass silage supplementation increased the FA derived from de novo synthesis and the FA derived from rumen microbial biomass, and decreased the sum of C18 FA, mostly derived from diet or from mobilization of adipose tissue reserves. Milk CLAcis-9,trans-11,
vac-Table 4.Least squares means for milk fatty acids (g/100 g of total fatty acids) from the different dietary treatments1
Effect
Fatty acid PC PCSB SC SCSB SEM Silage Concentrate Silage×concentrate
8:0 0.44 0.31 0.33 0.39 0.049 0.707 0.447 0.051 10:0 2.20 2.04 2.30 2.31 0.109 0.025 0.356 0.310 11:0 0.25 0.23 0.27 0.27 0.016 <0.001 0.240 0.253 12:0 3.00 2.95 3.40 3.23 0.126 <0.001 0.182 0.459 iso-14:0 0.12 0.11 0.11 0.11 0.006 0.612 0.823 0.342 14:0 10.86 10.79 11.86 11.43 0.275 <0.001 0.236 0.406 iso-15:0 0.70 0.67 0.73 0.76 0.026 0.026 0.995 0.278 anteiso-15:0 1.02 1.01 1.20 1.13 0.085 0.003 0.394 0.563 15:0 1.19 1.14 1.38 1.37 0.033 <0.001 0.364 0.490 iso-16:0 0.30 0.29 0.28 0.28 0.013 0.219 0.999 0.683 16:0 26.02 26.93 27.77 27.10 0.973 0.298 0.901 0.390 16:1trans-9 0.15 0.16 0.13 0.13 0.017 0.175 0.848 0.801 iso-17:0 0.74 0.72 0.68 0.70 0.018 0.016 0.985 0.226 16:1cis-9 1.28 1.34 1.37 1.36 0.076 0.350 0.759 0.541 anteiso-17:0 0.54 0.51 0.54 0.55 0.014 0.153 0.646 0.106 17:0 0.61 0.60 0.60 0.62 0.014 0.498 0.548 0.258 iso-18:0 0.03 0.02 0.02 0.02 0.003 0.759 0.689 0.814 17:1cis-8 0.10 0.10 0.11 0.10 0.003 0.430 0.504 0.859 17:1cis-9 0.30 0.31 0.29 0.32 0.015 0.643 0.186 0.414 18:0 12.90 13.18 11.88 12.19 0.489 0.016 0.461 0.970 18:1trans-6 to -8 0.27 0.26 0.27 0.24 0.020 0.400 0.416 0.665 18:1trans-9 0.21 0.22 0.21 0.19 0.014 0.433 0.742 0.415 18:1trans-10 0.39 0.34 0.44 0.30 0.063 0.947 0.142 0.496 18:1trans-11 3.06 3.19 2.86 3.05 0.356 0.639 0.651 0.933 18:1cis-9 23.91 23.60 21.30 22.76 0.686 <0.001 0.196 0.049 18:1cis-11 1.09 1.05 1.08 1.06 0.057 0.976 0.518 0.843 18:1cis-12 0.23 0.21 0.22 0.21 0.012 0.692 0.254 0.894 18:1cis-13 0.10 0.11 0.13 0.11 0.012 0.189 0.753 0.349 18:1trans-16 0.60 0.56 0.66 0.59 0.048 0.328 0.257 0.802 18:1cis-15 0.22 0.19 0.26 0.23 0.024 0.160 0.238 0.939 18:2 other isomers2 0.49 0.44 0.61 0.48 0.054 0.139 0.123 0.461 18:2trans-11,cis-15 0.30 0.29 0.30 0.26 0.027 0.653 0.264 0.579 18:2n-6 1.05 1.08 0.99 0.98 0.034 0.006 0.779 0.559 20:0 0.17 0.18 0.17 0.16 0.008 0.129 0.901 0.709 18:3n-3 0.63 0.61 0.67 0.63 0.028 0.203 0.149 0.741
CLAcis-9,trans-11 1.43 1.37 1.47 1.49 0.180 0.673 0.899 0.830
22:0 0.06 0.06 0.06 0.06 0.003 0.677 0.932 0.206 20:3n-6 0.07 0.07 0.07 0.07 0.003 0.603 0.988 0.976 20:4n-6 0.09 0.09 0.09 0.09 0.004 0.760 0.556 0.820 20:5n-3 0.09 0.09 0.09 0.08 0.005 0.867 0.617 0.357 22:5n-3 0.05 0.05 0.05 0.05 0.003 0.655 0.265 0.534 Unidentified 2.65 2.46 2.69 2.43 0.144 0.941 0.117 0.821
1PC = 20 h of access to grazing pasture, supplemented with 6 kg/d of corn-based concentrate mixture (C);
PCSB = 20 h of access to grazing pasture, supplemented with 6 kg/d of corn- and soybean meal-based concentrate mixture (CSB); SC = 7 h of access to grazing pasture during the day and 13 h of ad libitum access to grass silage at night, supplemented with 6 kg/d of C concentrate; SCSB = 7 h of access to grazing pasture during the day and 13 h of ad libitum access to grass silage at night, supplemented with 6 kg/d of CSB concentrate.
218:2 other isomers = sum of 18:2 isomers eluting after 18:1cis-15 and 18:2trans-11,cis-15.
cenic acid (18:1 trans-11), and linolenic acid (18:3n-3) concentrations were unaffected, suggesting that partial replacement of pasture by unwilted grass silage does not compromise the dietary quality of milk fat for humans.
ACKNOWLEDGMENTS
This work was partially financed by the Luso-Ameri-can Development Foundation (FLAD; Lisbon, Portugal), which is gratefully acknowledged.
REFERENCES
Alves, S. P., C. Marcelino, P. V. Portugal, and R. J. B. Bessa. 2006. Short communication: The nature of heptadecenoic acid in ruminant fats. J. Dairy Sci. 89:170–173.
AOAC. 1990. Official Methods of Analysis. Vol. I. 15th ed. AOAC, Arlington, VA.
Bargo, F., L. D. Muller, E. S. Volver, and J. E. Delahoy. 2003. Produc-tion and digesProduc-tion of supplemented dairy cows on pasture. J. Dairy Sci. 86:1–42.
Bauer, J. D. 1982. Clinical Laboratory Methods. 9th ed. D. Ladig, ed. The C.V. Mosby Co., St. Louis, MO.
Brito, A. F., G. A. Broderick, and S. M. Reynal. 2007. Effects of different protein supplements on omasal nutrient flow and microbial protein synthesis in lactating dairy cows. J. Dairy Sci. 90:1828–1841. Brockman, R. P., and B. Laarveld. 1986. Hormonal regulation of
metab-olism in ruminants: A review. Livest. Prod. Sci. 14:313–334. Cabrita, A. R. J., A. J. M. Fonseca, R. J. Dewhurst, and E. Gomes.
2003. Nitrogen supplementation of corn silages. 2. Assessing ru-men function using FA profiles of bovine milk. J. Dairy Sci. 86:4020–4032.
Carruthers, V. R., P. G. Neil, and D. E. Dalley. 1997. Effect of altering the non-structural:structural carbohydrate ratio in a pasture diet on milk production and ruminal metabolites in cows in early and late lactation. Anim. Sci. 64:393–402.
Chilliard, Y., A. Ferlay, J. Rouel, and G. Lamberet. 2003. A review of nutritional and physiological factors affecting goat milk lipid synthesis and lipolysis. J. Dairy Sci. 86:1751–1770.
Christie, W. W. 2004. Lipid Analysis. 3rd ed. The Oily Press, PJ Barnes & Associates, Bridgwater, UK.
Clark, D. A., and V. R. Kanneganti. 1998. Grazing management system for dairy cattle. Page 331 in Grass for Dairy Cattle. J. H. Cherney, and D. J. R. Cherney, ed. CAB Int., Oxon, UK.
Conway, E. J. 1957. Microdiffusion Analysis and Volumetric Error. Crosby, Lockwood and Son Ltd., London, UK.
Crosse, S., and P. Gleeson. 1987. Supplementation of autumn grass with silage and concentrates for grazing dairy cows in late lacta-tion. Ir. J. Agric. Res. 26:69–75.
Cruz-Hernandez, C., Z. Deng, J. Zhou, A. R. Hill, M. P. Yurawecz, P. Delmonte, M. M. Mossoba, M. E. R. Dugan, and J. K. G. Kramer. 2004. Methods for analysis of conjugated linoleic acid andtrans -18:1 isomers in dairy fats by using a combination of gas chromatog-raphy, silver-ion thin-layer chromatography/gas chromatogchromatog-raphy, and silver-ion liquid chromatography. J. AOAC Int. 87:545–562. Dewhurst, R. J., and P. J. King. 1998. Effects of extended wilting,
shading and chemical additives on the fatty acids in laboratory grass silages. Grass Forage Sci. 53:219–224.
Dewhurst, R. J., K. J. Shingfield, M. R. F. Lee, and N. D. Scollan. 2006. Increasing the concentrations of beneficial polyunsaturated fatty acids in milk produced by dairy cows in high-forage systems. Anim. Feed Sci. Technol. 131:168–206.
Elgersma, A., S. Tamminga, and G. Ellen. 2006. Modifying milk compo-sition through forage. Anim. Feed Sci. Technol. 131:207–225. Folch, J., M. Less, and G. H. Stanley Sloane. 1957. A simple method
for the isolation and purification of total lipids from animal tissues. J. Biol. Chem. 226:497–509.
Jahreis, G., J. Fritsche, and H. Steinhart. 1997. Conjugated linoleic acid in milk fat: High variation depending on production system. Nutr. Res. 17:1479–1484.
Kelly, M. L., E. S. Kolver, D. E. Bauman, M. E. Van Amburgh, and L. D. Muller. 1998. Effect of intake of pasture on concentrations of conjugated linoleic acid in milk of lactating dairy cows. J. Dairy Sci. 81:1630–1636.
Kolver, E. S., and L. D. Muller. 1998. Performance and nutrient intake of high producing Holstein cows consuming pasture or a total mixed ration. J. Dairy Sci. 81:1403–1411.
Mulligan, F. J., P. Dillon, J. J. Callan, M. Rath, and F. P. O’Mara. 2004. Supplementary concentrate type affects nitrogen excretion of grazing dairy cows. J. Dairy Sci. 87:3451–3460.
NRC. 2001. Nutrient Requirements of Dairy Cattle. 7th ed. Natl. Acad. Press, Washington, DC.
Norma Portuguesa 1785. 1986. Determinac¸a˜o do teor de ac¸u´cares. Dia´rio da Repu´ blica, III Se´rie de 30/05, no. 123. Lisbon, Portugal. Norma Portuguesa 873. 1997. Alimentos para animais, determinac¸a˜o
do teor de fo´sforo, me´todo gravime´trico. Lisbon, Portugal. O’Brien, B., S. Crosse, and P. Dillon. 1996. Effects of offering a
concen-trate or silage supplement to grazing dairy cows in late lactation on animal performance and on milk processability. Ir. J. Agric. Res. 35:113–125.
Phillips, C. J. C. 1988. The use of conserved forage as a supplement for grazing dairy cows. Grass Forage Sci. 43:215–230.
Phillips, C. J. C., and J. D. Leaver. 1985. Supplementary feeding of forage to grazing dairy cows. 2. Offering grass silage in early and late season. Grass Forage Sci. 40:193–199.
Rego, O. A., P. V. Portugal, M. B. Sousa, H. J. D. Rosa, C. M. Vouzela, A. E. S. Borbaa, and R. J. B. Bessa. 2004. Effect of diet on the fatty acid pattern of milk from dairy cows. Anim. Res. 53:213–220. Reis, R. B., and D. K. Combs. 2000. Effects of corn processing and supplemental hay on rumen environment and lactation perfor-mance of dairy cows grazing grass-legume pasture. J. Dairy Sci. 83:2529–2538.
Robertson, J. B., and P. J. Van Soest. 1981. The Detergent System of Analysis and Its Application in Human Foods. W. P. T. James and O. Theander, ed. Marcel Dekker Inc., New York, NY.
Salomonsson, A., A. Theander, and E. Westerlund. 1984. Chemical characterization of some Swedish cereal whole meal and bran frac-tions. Swed. J. Agric. Res. 14:111–117.
Salter, A. M., A. L. Lock, P. C. Garnsworthy, and D. E. Bauman. 2007. Milk fatty acids: Implications for human health. Pages 1–18 in Recent Advances in Animal Nutrition. P. C. Garnsworthy and J. Wiseman, ed. Nottingham Univ. Press, Nottingham, UK. Sukhija, P. S., and D. L. Palmquist. 1988. Rapid method for
determina-tion of total fatty-acid content and composidetermina-tion of feedstuffs and feces. J. Agric. Food Chem. 36:1202–1206.
Tilley, J. M. A., and R. A. Terry. 1963. A two stage technique for in vitro digestion of forage crops. J. Br. Grassl. Soc. 18:104–111. Van Soest, P. J., J. B. Robertson, and B. A. Lewis. 1991. Symposium:
Carbohydrate methodology, metabolism, and nutritional implica-tions in dairy cattle. Methods for dietary fiber, neutral detergent fiber, and nonstarch polysaccharides in relation to animal nutri-tion. J. Dairy Sci. 74:3583–3597.
Vanhatalo, A., K. Kuoppala, V. Toivonen, and K. J. Shingfield. 2007. Effects of forage species and stage of maturity on bovine fatty acid composition. Eur. J. Lipid Sci. Technol. 109:856–867.
Vlaeminck, B., C. Dufour, A. M. van Vuuren, A. R. J. Cabrita, R. J. Dewhurst, D. Demeyer, and V. Fievez. 2005. Use of odd- and branched-chain fatty acids in rumen contents and milk as a poten-tial microbial marker. J. Dairy Sci. 88:1031–1042.
Vlaeminck, B., V. Fievez, A. R. J. Cabrita, A. J. M. Fonseca, and R. J. Dewhurst. 2006. Factors affecting odd- and branched-chain fatty acids in milk: A review. Anim. Feed Sci. Technol. 131:389–417. Wu, Z., L. J. Massingli, R. P. Walgenbach, and L. D. Satter. 2001.
Cracked dry or finely ground high moisture shelled corn as a sup-plement for grazing cows. J. Dairy Sci. 84:2227–2230.