SPP Communiqué
SPP Communiqué
Does Alberta have a
Spending Problem?
Ken Boessenkool
Alberta spent the better part of the last decade of the 20th century becoming the paragon of fiscal virtue.1 Following a 1993 election fought over the nature of Alberta’s spending, the Alberta government set the standard for having a clean and closely controlled fiscal framework by vigorously reducing its expenditures. And it reaped the rewards by paying down its debt and making tax cuts that enhanced critical productivity, including the move to a single rate of personal income tax.
The recent return to deficits in Alberta has raised the question of whether the province has a spending problem. The answer to this question has important implications for how the province addresses its deficit. If Alberta has a spending problem, it makes sense to focus on expenditure reductions to reduce the deficit. If not, then relying on economic growth or tax increases might be the appropriate response.
1
I thank Jack Mintz, Andre Plourde and three anonymous reviewers for their helpful and insightful comments and suggestions. Errors remain the author’s alone.
Volume 2
•
Issue 1
February 2010
SPP Communiqués are brief articles that deal with a singular public policy issue and are intended to provide the reader with a focused, concise critical analysis of a specific policy issue.
Copyright © 2010 by The School of Public Policy.
All rights reserved. No part of this publication may be reproduced in any manner whatsoever without written permission except in the case of brief passages quoted in critical articles and reviews.
The University of Calgary is home to scholars in 16 faculties (offering more than 80 academic programs) and 36 Research Institutes and Centres including
The School of Public Policy. Under the direction of Jack Mintz, Palmer Chair in Public Policy, and supported by more than 100 academics and researchers, the work of The School of Public Policy and its students
contributes to a more meaningful and informed public debate on fiscal, social, energy,
environmental and international issues to improve Canada’s and Alberta’s economic and social performance.
This paper will undertake a comparative examination of spending in Alberta as one way to address the question of whether Alberta has a spending problem. To preview the conclusions in per capita terms in fiscal year 2008-09 (denoted as 2009 below), Alberta’s spending is 40 per cent higher than Ontario, 30 per cent higher than British Columbia and 15 per cent higher than the average in the other nine provinces. In dollar terms, program spending in Alberta would have to be reduced by $5 billion to bring its spending in line with the other nine provinces. Cuts of $12 and $8 billion would be required to bring Alberta’s per capita spending in line with Ontario and British Columbia, respectively.
The paper then considers four possible explanations for Alberta to have significantly higher program spending than other provinces. First, it adds local government expenditures to the mix as some provinces push down their spending to the municipal level. Second, it takes a look at relative levels of capital spending, acknowledging that Alberta has higher pressures on the capital side on account of the net inflow of population. Third, it asks whether demographic differences might explain Alberta’s higher spending. Finally, it asks whether relative costs in Alberta justify the province’s higher expenditures. In short, two of these arguments help justify Alberta’s higher spending, one is neutral and the other suggests that the per capita Financial Management System data from Statistics Canada understates the level of provincial
overspending. While there is some validity to each of these arguments, the paper concludes that, together, these possible explanations are not enough to close the gap between spending in Alberta and in other Canadian provinces.
In short, it is reasonable to conclude that if Alberta wanted to have per capita spending in line with the other nine provinces, it would have to reduce its spending by $5 billion dollars.
The paper also considers recent literature to supplement the comparative analysis with a normative case for reducing provincial expenditures. The Alberta Financial Investment and Planning Advisory Commission (FIPAC) provided an analysis of a sustainable fiscal path for Alberta given reasonable expectations for resource revenues. It also demonstrated that this would require a fiscal adjustment — tax increases or expenditure reductions — of $5.67 billion in order to return to a sustainable fiscal track.2 Further, Emery and Kneebone show that Alberta’s overreliance on energy revenues in recent years to support Alberta’s spending feels a lot like the mid 1980s, the last time Alberta’s reliance on resource revenues eventually required a painful fiscal adjustment.3 That the adjustment should be made on the spending rather than the tax side is addressed by Jack Mintz, who showed that without adjusting its spending track, Alberta is at risk of losing its tax advantage.4
2
Alberta Financial Investment and Planning Advisory Commission. 2008. Preserving Prosperity: Engaging Albertans in a Commitment to saving, Edmonton: Alberta Finance.
3
J.C. Herbert Emery and Ronald D. Kneebone, “Will it be Déjà vu all over again?” (Calgary: School of Public Policy Briefing Paper, April 2009).
4
Jack Mintz, “Will Alberta Lose Its Tax Advantage?” (Calgary: School of Public Policy Briefing Paper, October 2009).
In short, it is reasonable to conclude that if Alberta wanted to return to a sustainable fiscal policy and maintain its tax advantage, it would have to reduce its spending by $5.67 billion dollars.
The paper therefore concludes with a call for a minimum $5-billion reduction in program expenditures. It further calls for Alberta to review the legislative tools utilized in the 1990s and to pass new legislation with a medium-term commitment to reduce its reliance on energy revenues.
The paper is divided into three sections. The first takes a short look back at Alberta’s fiscal approach, paying special attention to legislative rules that have guided fiscal policy in Alberta. The second looks at Alberta’s fiscal approach in comparison with other provinces. Third, we look at what Alberta’s fiscal approach will need to be in the days ahead. A short summary concludes.
ALBERTA’S FISCAL APPROACH: LOOKING BACK
Fiscal policy in Alberta has seen a number of well-documented swings.5
Alberta has legislated fiscal rules and policy for more than 30 years. The Alberta Heritage Savings Trust Fund (AHSTF) was created in 1976, three years after the OPEC oil price shock of 1973 created a significant jump in non-renewable resource revenues. The government committed to putting 30 per cent of future resource revenues into the Heritage Fund. All income earned by the trust fund stayed within the fund.
In the early 1980s, Alberta slowly began to relax these rules. The recession of the early 1980s pushed the government to divert interest income from the trust fund into general revenues and reduce the percentage of resource revenues going into the fund.6 The oil price collapse in 1986 resulted in the province pulling all non-renewable resource revenues directly into general revenues. Despite these changes, the province ran a decade of deficits.
These pressures ultimately culminated in the election of June 1993. That election was fought over whether the reigning Progressive Conservatives led by former free-spending Calgary mayor Ralph Klein were more serious about spending reductions than the Liberals led by Laurence Decore, the much more fiscally conservative mayor of Edmonton.7
5
This section borrows heavily from Ronald D. Kneebone, “From Famine to Feast: The Evolution of Budgeting Rules in Alberta” (Canadian Tax Journal Vol. 54 No. 3 pp. 657-673) and Emery and Kneebone, “Will it be Déjà vu all over again?”
6
Alberta’s fiscal year ends on March 31 of each year. I have adopted the convention of referring to the 1984/85 Budget by the year in which it ended, namely 1985.
7
Kenneth J. Boessenkool, A rumpled rogue from Calgary becomes a fiscal revolutionary. In Paul Bunner, Ed. Alberta in the 20th Century, Volume 12: Alberta Takes the Lead. (Edmonton: History Book Publications Inc. 2003. pp. 258-277).
Ralph Klein won a solid majority, in part on a platform of deficit elimination that pledged strict limits on deficits and a zero deficit policy once the budget was balanced. A key feature of the Deficit Elimination Act was the requirement that the government could only spend the average amount of resource revenue that the province collected over the previous five years. Any amount above that average had to be used to reduce the debt.
The budget was balanced in 1995 and attention turned to eliminating the debt. The province introduced the Balanced Budget and Debt Retirement Act (BBDRA) with a 25-year debt repayment schedule. It also permitted spending the lower of the average amount of resource revenue in the previous five years and 90 per cent of the amount forecast for the current year. The province’s net debt (roughly the accumulated deficit minus the assets in the Heritage Fund) reached zero in 1999.
The elimination of deficits and debt and the continuation of substantial surpluses from booming resource revenues after 2000 resulted in a number of further adjustments to fiscal rules in Alberta. The Fiscal Responsibility Act (FRA) added a requirement for an “economic cushion” of 3.5 per cent of forecast revenues.
Following the elimination of the net debt in 1999, the province proposed a move to a single rate of tax. A 10 per cent single rate tax was implemented in January 2001. Alberta also proposed a series of corporate tax reductions in its 2000 budget.
Continued resource revenue windfalls in subsequent years created new challenges. It was during this period when annual ad hocchanges to the Fiscal Responsibility Act eliminated, for all practical purposes, the usefulness of the legislative fiscal anchor.8
This short summary indicates that the introduction of fiscal rules with clear objectives was followed in short order by the attainment of the stated objective. A sizeable savings account was established within four years of the creation of the Alberta Heritage Savings Trust Fund and a 30 per cent savings rule. The deficit was eliminated within two years of the introduction of the Deficit Elimination Act and the net debt was eliminated four years after the introduction of the Balanced Budget and Debt Retirement Act. In short, it could be argued that clear fiscal rules with a clearly defined objective appear to be an important part of achieving that objective.
The other side of the coin is that the combination of a sustained period of strong resource revenues combined with weak fiscal rules or legislation produced fiscal drift and overspending. Kneebone shows that between 1995 and 2005, the province underestimated annual revenues by an average of just under $2 billion dollars.9 Adrian et al. note that among provinces and the
8
A quick tour: the amendments to the FRA stated the maximum amount of resource revenues that could be brought into general revenues should be capped at $3.5 billion (2003) then $4.0 billion (2004) then $4.75 billion (2005) then $5.3 billion (2006) which remained unchanged for 2007 . In addition, the required size of the economic cushion fell over this period to 1.0 per cent from 3.5 per cent. The amendments of 2003 also created an Alberta Sustainability Fund (ASF) to which resource revenues above the $3.5 billion cap had to go. The size of the ASF was capped at $2.5 billion, and amounts above $2.5 billion could go to capital projects, various endowment funds created in the early 2000s or to the AHSTF, now called the Alberta Heritage Fund. These changes made the Alberta budgets of the later part of that decade nearly impossible to interpret.
9
federal government, Alberta fared the worst between 1997 and 2007 in terms of missing its budgeted expenditure targets.10 Over the 10-year period, Alberta missed its budget expenditure targets by a cumulative $9.1 billion.
The return to deficits in Alberta has raised important questions around Alberta’s fiscal stance. Important among those questions is whether Alberta has a spending problem. The answer to that question will have an important implication for how the province addresses its deficit.
ALBERTA’S FISCAL APPROACH: LOOKING AROUND
Statistics Canada produces comparative spending profiles for Canada’s provinces in its
Financial Management System (FMS) data series. These data are Statistics Canada’s attempt to produce data on a comparative basis across provinces. In their words:11
It is difficult to make year to year intergovernmental comparisons of financial transactions without numerous adjustments to the basic data. The FMS was developed to replace the diverse formats of government financial reports by establishing statistical series that are consistent and allow valid comparisons from the various government’s financial and non-financial reports.
FMS numbers, due to their construction, cannot be compared directly to the provincial budgets released by various governments which are produced on a Public Accounts basis.
In order to make the data more comparable, Table 1 reproduces provincial FMS data on 2009 provincial expenditures by dividing FMS provincial expenditures by population data from each province to produce spending in per capita terms.12
The Numbers
Table 1 shows some fairly wide variations on total expenditures per person between provinces. In 2009, Newfoundland has the highest per capita spending, with total expenditures nearing $13,000 for every man, woman and child. Ontario has the lowest, with total expenditures just shy of $8,000 per person. In other words, Newfoundland is spending almost 50 per cent more than Ontario in per capita terms.
10
Reid S. Adrian, Yvan Guillemette and William B.P. Robson, Missed Targets: Canada’s 2007 Fiscal Accountability Ranking (Toronto: CD Howe Institute, March 2007), pp. 2-3.
11
http://www.statcan.gc.ca/pub/68f0023x/2006001/chap/chap1-eng.htm as at January 23, 2010. 12
FMS provincial spending data is available free at the following sites: http://www40.statcan.gc.ca/l01/cst01/govt08a-eng.htm, http://www40.statcan.gc.ca/l01/cst01/govt08b-eng.htm and http://www40.statcan.gc.ca/l01/cst01/govt08c-eng.htm
A better measure, if you want to look at government spending under the direct annual control of each province, is government expenditure excluding debt servicing costs. Debt servicing is the one expenditure (short of defaulting on their debts) that provinces cannot shirk. Total spending excluding debt servicing cost is commonly referred to as program spending — row 2 of Table 1.
TABLE 1: 2009 FMS Provincial Expenditures per Capita
When it comes to program spending, Canada’s three natural resource heavy provinces are first, second and third in terms of program spending. Newfoundland maintains the overall lead at just under $12,000 per person, while Alberta and Saskatchewan are clumped together at just over $10,000 per person.
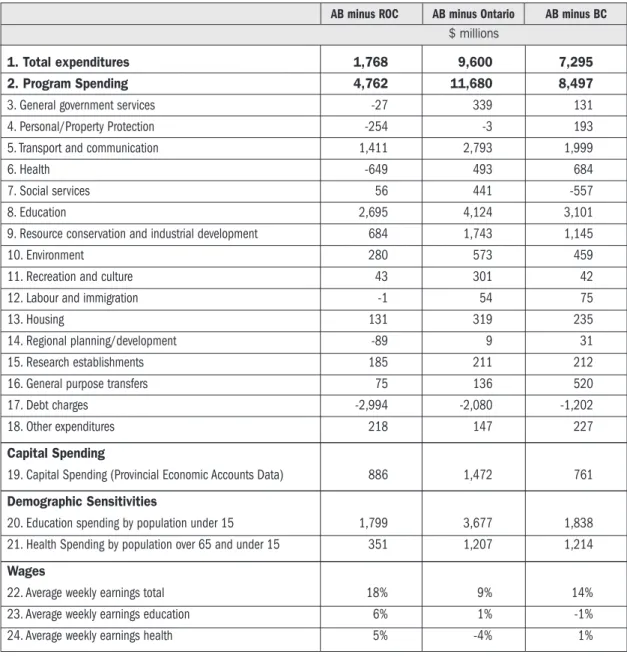
Table 2 compares Alberta’s expenditures to spending in the other nine provinces, as well as spending in Ontario and spending in British Columbia in 2009. Data in Table 2 is calculated to determine how much Alberta’s spending have to change to be the same in per capita terms as what is spent in these other jurisdictions.
To produce the figures in the first column, the difference in per capita spending in Alberta and per capita spending in the other nine provinces is multiplied by the population of Alberta. So this column is the amount by which spending in Alberta is higher (if a positive number) or lower (if a negative number) than what is spent on average in the other nine provinces.
N.L. P.E.I. N.S. N.B. Que. Ont. Man. Sask. Alta. B.C.
$ Per Capita
1. Total expenditures 12,749 10,752 9,448 10,197 10,692 7,980 9,585 10,923 10,583 8,605 2. Program Spending 11,700 9,915 8,398 8,953 9,270 7,264 8,470 10,163 10,431 8,127 3. General government services 438 461 118 195 239 133 137 176 225 189 4. Personal/Property Protection 731 333 405 338 334 345 396 546 344 292 5. Transport and communication 1,079 908 473 789 592 267 480 708 1,025 483 6. Health 4,056 3,461 3,448 3,540 2,976 3,082 3,256 3,676 3,216 3,030 7. Social services 1,564 915 1,132 1,191 2,257 1,301 1,521 1,191 1,420 1,571 8. Education 2,466 2,113 1,954 2,000 1,841 1,566 1,623 2,179 2,685 1,844 9. Resource conservation and
industrial development 533 887 321 362 432 196 427 830 668 358 10. Environment 261 298 67 80 91 41 58 114 196 72 11. Recreation and culture 169 234 92 85 119 59 98 177 141 129 12. Labour and immigration 28 28 15 43 78 17 34 32 31 11 13. Housing 151 78 175 112 77 63 78 211 150 86 14. Regional planning/development 83 35 49 53 46 25 106 45 27 19 15. Research establishments 0 0 1 0 55 2 10 12 59 2 16. General purpose transfers 145 163 149 165 134 146 247 268 182 42 17. Debt charges 1,049 837 1,050 1,245 1,422 716 1,115 760 152 478
TABLE 2: 2009 FMS Provincial Spending in Alberta Compared to…
The first thing to note from Table 2 is that there are sizeable differences between total
expenditures and program spending. The explanation for this lies in line 17, debt servicing costs. With virtually no debt, Alberta pays virtually no debt service charges.
With Tables 1 and 2 in hand, we can get a sense for the relative spending levels of the Alberta government. Table 1 tells us that Alberta spends $10,431 for every man, woman and child in the province. As noted, that's more than any provincial government except Newfoundland and Labrador. The average in the other nine provinces is just over $9,100, so Alberta spends about $1,300 more per capita than the average of the rest of the provinces. Multiply that by Alberta's population and you have $4.762 million — almost $5 billion — as shown in the second line of the first column of Table 2.
AB minus ROC AB minus Ontario AB minus BC
$ millions
1. Total expenditures 1,768 9,600 7,295 2. Program Spending 4,762 11,680 8,497
3. General government services -27 339 131
4. Personal/Property Protection -254 -3 193
5. Transport and communication 1,411 2,793 1,999
6. Health -649 493 684
7. Social services 56 441 -557
8. Education 2,695 4,124 3,101
9. Resource conservation and industrial development 684 1,743 1,145
10. Environment 280 573 459
11. Recreation and culture 43 301 42
12. Labour and immigration -1 54 75
13. Housing 131 319 235
14. Regional planning/development -89 9 31
15. Research establishments 185 211 212
16. General purpose transfers 75 136 520
17. Debt charges -2,994 -2,080 -1,202
18. Other expenditures 218 147 227
Capital Spending
19. Capital Spending (Provincial Economic Accounts Data) 886 1,472 761
Demographic Sensitivities
20. Education spending by population under 15 1,799 3,677 1,838 21. Health Spending by population over 65 and under 15 351 1,207 1,214
Wages
22. Average weekly earnings total 18% 9% 14%
23. Average weekly earnings education 6% 1% -1%
Let's state that another way. If Alberta were to spend the average of all other provinces, it would be spending $5 billion less. Or put still another way, if Alberta cut $5 billion from its budget today, it would be spending exactly the average of what all other provinces are spending.
Columns two and three compare Alberta to the two other larger and traditionally wealthier provinces of Ontario and British Columbia. The gap in program spending between Alberta and those provinces is also substantially wider. From Table 1, you can see that Alberta spends roughly $3,000 per person more than Ontario. Multiply that by Alberta’s population and you get $11.680 billion in Table 2. And Alberta spends $2,000 more per capita than B.C., multiply that by Alberta’s population and you get $8.497 billion.
In short, if Alberta wanted to get program spending in line with per capita spending in Ontario, it would have to cut almost $12 billion from its budget. Alberta would have to cut more than $8 billion to spend on par with British Columbia.
Table 2 also lets us dig a little deeper by showing where Alberta is spending relatively more than others.
According to Table 2, the biggest gap between Alberta and other provinces is in education. In order to spend what the rest of the country does on education, Alberta would have to reduce expenditures by $2.7 billion. And in relative terms, Alberta spends $4.1 billion more on education than Ontario.
The next big culprit is transportation and communications. Relative to per capita levels in the rest of the country, Alberta is spending $1.4 billion more. If Alberta wanted to spend what Ontario was spending in this category, it would have to cut $2.8 billion.
Another target is resource conservation and industrial development. Clearly, Alberta has to spend money on its resource sector. British Columbia also has a large, vibrant yet often struggling resource sector. Yet if Alberta wanted to spend what B.C. spends on resource conservation and industrial development, spending must be cut by $1.1 billion.
According to the Financial Management System (FMS), Alberta spends less than the average of the other nine provinces on health. Yet we would still have to cut roughly half a billion dollars to reach the spending levels of B.C. or Ontario. And if we wanted to bring our spending in line with Quebec, where private health care has made its biggest gains, we'd have to cut almost $1 billion.
Other areas where Alberta spends more per capita than Ontario or B.C. include environment (we'd have to cut about $500 million to spend what they do), housing (cut $250 million), recreation and culture ($300 million to get to Ontario levels), research establishments (cut $200 million), and general government services (cut more than $300 million to get to Ontario levels, over $100 million to get to B.C. levels).
The simple fact that Alberta is spending much more per capita than other provinces is not enough, on its own, to make the case that Alberta has a spending problem. There are potential reasons why one province might spend more per capita than another. It is to these potential explanations that we now turn.
Possible Explanation 1: Provincial-Local Government Spending Patterns
The discussion above avoided mentioning social service spending. The reason is that the way in which Alberta and Ontario spend money on social services is different in an important respect. In Alberta, social service spending is delivered primarily through the provincial government, while Ontario pushes a significant portion of its social service spending to local governments.
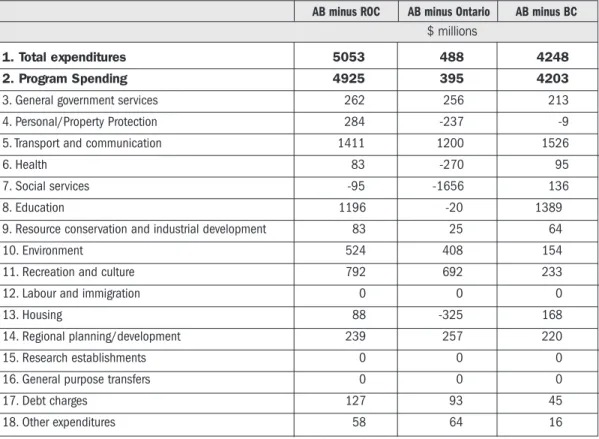
This raises the question of how, or even if, the conclusions above might be altered if we take into account spending by local governments. Table 3 presents the same numbers as Table 2 for the local government sector, with the additional caveat that the latest local government numbers are one year older.13
Row 7 of Table 2 illustrates the point made above: spending on social services is relatively much higher at the provincial level in Alberta ($441 million), but much lower at the local government level ($1.656 million from row 7 in Table 3) than in Ontario. And overall, Ontario spends much more than Alberta on social services; it is the only category aside from debt charges and personal and property protection where Ontario spends more.
TABLE 3: 2008 FMS Local Government Spending in Alberta Compared to…
13
The data behind these tables are available free at the following websites:
http://www40.statcan.gc.ca/l01/cst01/govt53a-eng.htm; http://www40.statcan.gc.ca/l01/cst01/govt53b-eng.htm; and http://www40.statcan.gc.ca/l01/cst01/govt53c-eng.htm. I would further note that the CPI for Alberta fell from 2008 to 2009 by 0.1%, meaning any adjustment for inflation would be trivial. See
http://www40.statcan.gc.ca/l01/cst01/econ09j-eng.htm.
AB minus ROC AB minus Ontario AB minus BC
$ millions
1. Total expenditures 5053 488 4248
2. Program Spending 4925 395 4203
3. General government services 262 256 213 4. Personal/Property Protection 284 -237 -9 5. Transport and communication 1411 1200 1526
6. Health 83 -270 95
7. Social services -95 -1656 136
8. Education 1196 -20 1389
9. Resource conservation and industrial development 83 25 64
10. Environment 524 408 154
11. Recreation and culture 792 692 233
12. Labour and immigration 0 0 0
13. Housing 88 -325 168
14. Regional planning/development 239 257 220
15. Research establishments 0 0 0
16. General purpose transfers 0 0 0
17. Debt charges 127 93 45
What is particularly noteworthy when looking at Table 2 alongside Table 3 is that when the two tables are roughly added together (acknowledging that they cover different years), Alberta’s local and provincial governments together are spending about $10 billion more than the average in other provinces, and more than $12 billion more than Ontario and British Columbia.
Together these tables do not repudiate any of the conclusions about where the largest gaps are between spending in Alberta and spending in the rest of the country; if anything, they make the conclusions stronger.
In short, including the municipal sector only makes Alberta’s governments look even larger.
Possible Explanation 2: Capital Expenditures
It is well known that Alberta is a net destination for international and interprovincial
immigrants. From 1972 to 2007, Alberta has seen an annual average increase in population of 2.1 per cent compared to around one per cent for the other provinces.14 The annual average increase in interprovincial migrants to Alberta over that period was 0.5 per cent, meaning that Alberta was a net recipient of people from the rest of Canada.
These new arrivals do not bring their schools and hospitals with them when they come to Alberta. Since other provinces are losing individuals, they do not face the same pressures to build public infrastructure as Alberta. This would suggest that the Alberta government should have relatively higher capital spending than other provinces and the extent of this higher spending on capital projects should be deducted from differences in overall program spending to determine whether Alberta should be spending more or less than it is, at least in relative terms.
The Fiscal Management System (FMS) data does not break out capital spending as a separate category. However, the Provincial Economic Accounts (PEA) do. Line 19 in Table 2 presents the relative differences in capital spending between Alberta and the other nine provinces, Alberta and Ontario, and Alberta and British Columbia for 2007, the latest year for which PEA data is available.15
Alberta does spend more than its counterparts on capital spending, as one would expect given its net in-migration. However, the data is not unambiguous on this point. Like Alberta, British Columbia has seen a net increase in population of 1.9 per cent between 1972 and 2007, yet Alberta would have to reduce its capital spending by $750 million to reach the per capita capital spending levels seen in British Columbia.
14
Population and migration data in this section come from Brett Gartner, “State of the West, 2008” (Calgary: Canada West Foundation: 2008), pp. 5-22.
15
I thank Andre Plourde for making this point as well as providing the PEA data used here. Simple correlations between long term average annual net rates of provincial migration noted in the text and average per capita capital spending from 1989 to 2007 was 0.195, suggesting that there may be a weak link in Canadian provinces between capital spending and interprovincial migration patterns.
A related argument would note that jurisdictions that tend to see high private sector capital spending also tend to have higher public sector capital spending. Again, this provides some justification for the higher capital spending levels in Alberta, which also has relatively higher private sector capital spending.16
In short, there is evidence that part of the explanation for higher spending in Alberta is tied to the need for higher capital spending to accommodate the influx of population, although the data for B.C. does somewhat temper that conclusion.
Possible Explanation 3: Demographics
Certain categories of government spending are sensitive to the makeup of the underlying population. For example, one would expect that provinces with a relatively larger population under age 15 would spend more on education, while provinces with a relatively larger population over age 65 and under age 14 would spend more on health care.
Lines 20 and 21 of Table 2 recalibrate health and education spending data to take these demographic factors into account.
Line 20 compares the level of spending on education per child under 15 in Alberta to our three comparators. It then calculates how much more or less Alberta would have to spend to have the same amount of spending per person under 15 as in the other nine provinces, Ontario and British Columbia.
Comparing Line 20 with Line 8 suggests that the raw per capita numbers may be overstating the levels of education “overspending” in Alberta. But the recalibrated data does not refute the conclusion. When you compare spending on education relative to the population under age 15, Alberta is still spending significantly more than in the other nine provinces ($1.8 billion more compared to $2.7 billion when using total population), than Ontario ($3.7 billion more compared to $4.1 billion) and British Columbia ($1.8 billion more compared to $3.1 billion).
Alberta has among the best education systems in Canada. At very modest cost, Alberta promotes choice and competition in education and that has resulted in higher test results. Our government funds some great universities and colleges that do first-class research and teaching. Still, do we really need to spend billions more than others to accomplish these objectives?
What about taking account of the fact that a significant portion of the health budget is spent on the young and the old? Line 21 compares spending on health care by the population of those over age 65 and those under 14.17
16
I thank Jack Mintz for raising this important point. 17
Comparing the size of the population under age 15 and over 65 to the population between 15 and 65 produces what is commonly referred to as a “dependency ratio.”
Adjusting health spending for the elderly and the young strengthens the conclusion that health spending in Alberta is significantly higher than other provinces. When you compare spending on health care relative to the population over 65 and under 15, Alberta is spending more than the other nine provinces ($351 million more compared to $650 million lessusing the raw per capita comparisons above), than Ontario ($1.2 billion more compared to $500 million more) and British Columbia ($1.2 billion more compared to $700 million more).18
In very rough terms, the amount by which the per capita comparisons overstateAlberta’s relative education overspending is similar to the amount by which the per capita comparisons understateAlberta’s relative overspending in health care.
In short, the differences in program spending between Alberta and our comparison groups are, on balance, not impacted by adjusting health and education spending for demographic realities.
Possible Explanation 4: Higher Costs
Alberta may be spending more than its provincial counterparts because costs are higher in Alberta. For example, the Consumer Price Index — the most widely used and understood measure of prices — has risen one per cent faster per year in Alberta in the past seven years than in the other nine provinces.19 On this basis, Alberta expenditures should be higher than other jurisdictions to account for these higher prices.20
The shotgun approach of a broad price index may capture too broad a basket of prices for comparing input costs for government services. A rifle-shot approach using, say relative wages, may produce more relevant comparisons.
Key provincial programs are labour intensive services, and wages form a significant portion of the total expenditures. This is true for education (teachers and administrators), health care (doctors and nurses), and even capital expenditures (construction workers).
Lines 22 through 24 provide some wage comparisons.21 It shows that Alberta clearly has higher wage costs across all industries — between 10 and 20 per cent higher than our reference provinces. This lends some credence to the argument that Alberta’s spending may be higher because costs such as wages require us to spend more for the same services.
18
If you merely use the population over 65, then relative health spending in Alberta is $3 billion more than in all three comparators.
19
Alberta’s CPI price index in 2009 was 122 (2002=100) compared to an average of 115 in the other nine provinces. See http://www40.statcan.gc.ca/l01/cst01/econ09j-eng.htm and related tables as at January 27, 2010.
20
Saskatchewan and PEI have the next highest provincial price indexes at 117. There is a simple correlation of 0.510 between these seven year cumulative index numbers and provincial program spending.
21
This data can be found at http://www40.statcan.gc.ca/l01/cst01/labr79-eng.htm,
http://www40.statcan.gc.ca/l01/cst01/health23-eng.htm, and http://www40.statcan.gc.ca/l01/cst01/educ05-eng.htm and was referenced on January 29, 2010.
Yet lines 23 and 24 inject some caution into that conclusion. For jobs like administrative assistants, construction workers and managers, the government would be competing for these types of workers in the broader economy and would therefore have to bear the brunt of higher costs in Alberta. However, the competition for specialized jobs would be across the sector and across regions, not merely within Alberta. How much we pay teachers and nurses in Alberta is likely to be more dependent on how much other provinces pay their teachers and nurses than on how much Alberta companies pay construction workers or managers. This is borne out by looking at the average weekly earnings in health (line 21) and education (line 20); differences between Alberta and other provinces all but vanish.
As a final note on costs, there is an argument that larger provinces may benefit from economies of scale. In this scenario, one would expect that Ontario would spend less than Alberta in per capita terms on account of these economies. This would temper some of the large differences we see in the raw data. However, using Table 1 to compare size of provincial governments to the size of their population suggests a tenuous link at best. British Columbia may be a more apt comparator on this issue than Ontario or Newfoundland or even Prince Edward Island, to take the most extreme example.
In short, while cost factors are a legitimate reason for Alberta to have higher per capita expenditures, direct data for key costs — wages in health and education sectors — weaken the broader point.
Summary
Raw data from the Fiscal Management System suggest that Alberta is spending considerably more than other provinces on its programs. Based on this information alone, if Alberta wanted to spend the same amount per capita on programs as the other nine provinces, it would have to cut $5 billion. To be in line with Ontario, Alberta would have to cut $12 billion from programs and if the province wanted to spend the same as British Columbia, it would have to cut $8 billion.
Yet this data should be tempered by the following arguments:
• Some provincial governments do push a portion of spending down to the local level where Alberta does not (i.e., social services in Ontario). This means that using the provincial numbers alone may overstate the “overspending” levels in Alberta. However, when you combine Alberta’s program spending at the local and the provincial level, Alberta is
spending more than $10 billion above Ontario, British Columbia or the average spent in the other nine provinces.
• Alberta has seen a steady inflow of population, unlike most other provinces. These new arrivals do not bring their schools and hospitals, therefore Alberta would be justified in spending more on capital projects than other provinces. While that is indeed seen in comparisons across the country, this conclusion is somewhat counterbalanced by the fact that British Columbia, which has experienced a steady inflow of people similar to Alberta, has lower capital spending per capita.
• Another plausible explanation is that Alberta’s younger population would explain our relatively higher spending levels. The younger population explains about half of the gap in education spending between Alberta and other provinces. But this cuts two ways. When health care spending is adjusted for our demographic mix, we find that this about cancels out the reduction in overspending in education and makes health care one of the key areas where Alberta is spending significantly more than other provinces.
• Higher inflation and wages in Alberta might also reasonably explain why Alberta’s spending is higher than in other provinces; the provincial government is paying higher costs. Yet many government jobs do not compete against the private sector. There are essentially no differences in average weekly earnings in education and health sectors between Alberta and other provinces. And while economies of scale can be invoked to explain spending
differences between Alberta and Ontario, economies of scale are far from clear if you look across all provinces.
In short, two of these arguments help justify Alberta’s higher spending, one is neutral and the other suggests that the per capita FMS data understate the level of provincial overspending. So while examining these various potential explanations tempers the conclusion from the raw FMS data that Alberta has a spending problem, they do not invalidate it. While this comparative data does not provide a normative basis for spending levels, it does raise an important political and public question of whether Albertans want to be spending this much more than their fellow Canadians and/or whether they are getting value or more services.
ALBERTA’S FISCAL APPROACH: LOOKING AHEAD
It is possible to make a normative argument that spending in Alberta is too high. One of the clearest such cases is made in the Alberta Financial Investment and Planning Advisory Commission’s Technical Appendix on Sustainable Fiscal Policy.
Without laying out the entire appendix, the approach can be summarized rather simply: the value of a government’s current and future revenue must equal the value of its current and future program expenditures. The difference between what Alberta spends and the taxes it raises, the fiscal gap, must be covered from three sources: (a) resource revenues; (b) revenue from financial assets (like the Heritage Fund); and (c) transfer payments from Ottawa. To be sustainable, revenues from these three sources must be large enough to cover any future difference between taxes and expenditures.
Emery and Kneebone show that Alberta’s budget gap — the difference between what Alberta spent on programs and the revenue collected from all sources except resource revenues and money from investment funds — started growing in 1999 and reached mid-1980s levels of around $12 billion by 2009.22
22
Emery and Kneebone, “Will it be Déjà vu all over again?” p. 7. Emery and Kneebone’s budget gap is different than FIPAC’s fiscal gap in that their budget gap excludes (c) transfer payments form Ottawa.
This increased reliance on resource revenues is problematic.
First, resource revenues are not like other tax revenues. An analogy perhaps explains it best. A baker receives cash from selling bread, pastries and cakes. This is analogous to personal, corporate and sales taxes as well as to fees from services and other regular tax revenues. The baker can also get cash by selling his oven. This is analogous to the revenues received from non-renewable resources. Royalties in particular are not so much revenue as they are the result of converting an asset from one form to another: from a physical asset of oil or gas in the ground (like the baker’s oven) to a financial asset of royalty payments (like the proceeds from the sale of an oven). Another way to look at this is to consider other tax revenues as income statement transactions while money from non-renewable resource royalties could be considered a balance sheet transaction. Or as the 2008 FIPAC study put it, “When Alberta sells its
resources, it has given up wealth that can either be spent today or saved for the future.23
In this context, the commission’s study demonstrated that between 1994 and 2007 Alberta had an average annual savings rate — the amount of its resource revenue saved or used to pay down debt — of just over 30 per cent.24 On the other hand, Emery and Kneebone have demonstrated the troubling prospect that Alberta has become as reliant on resource revenues as it was during the mid 1980s. In summation, while non-renewable resource revenues unarguably assisted in the paying down of provincial debt, the fact remains that resource revenues are being treated no differently than other tax revenues. At best, this is problematic.
Second, as the FIPAC study concludes, there are good reasons to think that resource revenues are likely to decline in the coming decade and beyond. Conventional oil and gas extraction, which produces high returns to the province, is on the decline and being replaced by
unconventional oil and gas extraction, which produce lower returns due to their higher relative costs.25
If Alberta is to reduce its reliance on resource revenues, one way to keep on a sustainable fiscal path is to increase the amount the province saves. Revenue from these savings will offset future projected declines in resource revenues. The FIPAC appendix concludes that “if we increased the savings rate by 15 per cent of total revenues, the province would be close to a sustainable fiscal policy. However, this would require a … fiscal adjustment of $5.67 billion in 2007-08.”26
23
Alberta Financial Investment and Planning Advisory Commission, p. 3. 24
Alberta Financial Investment and Planning Advisory Commission, pp. 26-27. Gibbins and Vander Ploeg calculate that only 8.6 per cent of non-renewable resources in Alberta from 1977 to 2005 went into the Heritage fund while over 90 per cent went into general revenues. Roger Gibbins and Casey Vander Ploeg, Investing Wisely: An Investment Strategy for Creative Leadership (Calgary: Canada West Foundation, August 2005).
25
FIPAC pp. 8-9. 26
The obvious question is whether such a fiscal adjustment should be accomplished by reducing spending or by raising taxes. From a competitiveness point of view, the answer is clear — the adjustment should come via reductions in spending. As Mintz concludes, “The bad news is that Alberta could lose its tax advantage altogether within a decade if its balanced-budget spending growth requires increased taxation.”27
This line of argument suggests that Alberta’s 2009 commitment to “$2 billion in fiscal
corrective actions to be taken in 2010 if (the) situation does not improve beyond forecast”28 is a rather modest objective. A much larger reduction would be needed to maintain a sustainable fiscal policy, as well as Alberta’s tax advantage. What this analysis suggests is that a fiscal adjustment of at least $5 billion is necessary to maintain our present advantages. Larger adjustments may be necessary to improve on them.
The Financial Management System data suggests that there is room — at least from a
comparative perspective — to make a fiscal adjustment of this magnitude on the spending side. At the very least, it presents a readily understandable political argument that can underscore the normative need to reduce Alberta’s expenditures.
So what is the best way to accomplish this kind of fiscal adjustment? The analysis here suggests that any commitment would benefit greatly by a return to Alberta’s practice for much of the 1990s, when fiscal policy was guided by legislation with clear objectives.
In the current environment, government should tie its legislation to two overriding objectives. First, balanced budgets; Alberta needs to get back to budget balance. Second, reduce reliance on resource revenues; Alberta needs to have a sustainable fiscal policy.
Details of a legislative package to accomplish these objectives is beyond the scope of this paper.29 In order to meet the two broad objectives noted above, any such legislative package should include the following elements:
• A commitment to reduce spending in the upcoming budget by a minimum of $5 billion.
• A long-term spending track to keep the budget gap at a sustainable level given a reasonable long-term outlook for resource revenues.
• A commitment to balanced budgets that references a sustainable amount of resource revenues.
• A commitment to divert unanticipated budget surpluses to one-time capital spending or into the Heritage Fund.
• A commitment to maintain or improve Alberta’s tax advantage by ensuring that our tax-to-GDP ratio does not rise.
27 Mintz. 2009. p. 1. 28 http://alberta.ca/home/NewsFrame.cfm?ReleaseID=/acn/200904/2566682130AB8-0A89-15BD-C8BD5275D7430706.html as of January 20, 2010. 29
A full discussion of these points can be found in FIPAC as well as Ken Boessenkool, “Time for new Budget Rules: A Surplus and Savings Management Act for Alberta” (Calgary: Canada West Foundation, January 2008), pp. 5-7.
About the Author
Ken Boessenkoolis an Executive Fellow at the School of Public Policy at the University of Calgary. Ken was senior policy advisor and strategist to Conservative Party of Canada Leader Stephen Harper. Ken has been an Adjunct Research Fellow as well as a Policy Analyst with the Toronto-based C.D. Howe Institute. He has taught Canadian Public Finance in the Economics Department at the University of Calgary and has published over thirty-five academic articles. His numerous opinion editorials have appeared in Time Magazine, The Globe and Mail, National Post,Calgary Herald, Ottawa Citizenand other newspapers. Ken is a Research Fellow at the Canada West Foundation, and he serves as a volunteer board member of the Canada Israel Committee and Imagine Canada’s Government Relations Advisory Board.
CONCLUSION
The recent return to deficits in Alberta has raised the question of whether the province has a spending problem. The answer to this question has important implications for how the province addresses its deficit. If Alberta has a spending problem, it makes sense to focus on expenditure reductions to reduce the deficit. If not, then relying on economic growth or tax increases might be the appropriate response.
This paper has made a comparative and normative case that Alberta needs to make a sizeable expenditure reduction — a minimum of $5 billion — in the upcoming budget. This will bring Alberta’s program spending more in line with other provinces, put the province on a
sustainable fiscal track and make it more likely that Alberta will maintain its tax advantage — a policy and political hat trick.