The 2007 USDA Farm Bill Proposal: Implications for the U.S. Cotton
Industry
Suwen Pan, Mark Welch, Mohamadou Fadiga, and Samarendu Mohanty
Cotton Economics and Research Institute Texas Tech University
CERI-BP-07-01
Cotton Inc. Project 05-686
The 2007 USDA Farm Bill Proposal: Implications for the U.S. Cotton
Industry
Summary
The proposed 2007 farm bill contains fundamental shifts in policy option mainly dictated by a desire to render the U.S. agriculture “more market oriented’ and the programs less costly to the U.S. treasury. The proposal adopts a revenue-based counter cyclical payment while maintaining the current price-based counter cyclical payment scheme. Under the revenue-based system, payment would be triggered when the actual national revenue per acre falls below the national target revenue per acre. The choice is left to producers who will be allowed a onetime option to select one of these two schemes.
Under the proposal, the target revenue for cotton growers is set to $496.93/acre and the national payment yield to 634 lb./acre. The target price is set to 70¢/lb down 2¢/lb relative to the 2002 farm bill while the loan rate and the direct payment rate are maintained at their 2002 levels with 52¢/lb. and 6.67¢/lb, respectively. Moreover, the cotton Far East price was adopted as the reference price from which the adjusted world price is to be calculated. The program also advocated cash payments to domestic cotton users while maintaining the import quota that existed under the 2002 farm bill. More importantly, under the USDA proposal, any farm with a three-year adjusted gross income AGI over $200 thousand is barred from receiving payments.
The study found that cotton market price (average spot price as reported by USDA Agricultural Market Service) is 5 cents per pound higher in the first year of the USDA proposal (+9%) and averages about 5 percent higher over five years. Counter-cyclical payments average about 10 cents per pound per year under the current farm bill and drop to about 2 cents per pound per year with the USDA proposal. The loan rate falls from a current 52 cents per pound to 42 cents per pound under the proposal but climbs back near the mandated cap and the current rate in year five. Loan deficiency payments average about 3 cents per pound under the current farm bill but are zero for the first four years of the USDA proposal. U.S. cotton harvested area is projected to be down about 2% on average. Government spending declines by more than 40 percent in the first year of the USDA proposal and is down by about 27 percent per year over 5 years. Net farm income is lower under the proposal as well, down by 15 percent in year one and 11 percent per year lower on average.
The 2007 USDA Farm Bill Proposal: Implications for the U.S. Cotton
Industry
Proposed Farm Legislation
On January 31, 2007, Agriculture Secretary Mike Johanns presented the U.S. Department of Agriculture’s proposal for the 2007 farm bill. According to Secretary Johanns, the focus of the Administration’s proposal is on a more “market-oriented approach” than the 2002 legislation it replaces (USDA, 2007b). The USDA proposal covers a wide array of topics from conservation and bioenergy to funding for fruit and vegetables in food assistance programs to increased assistance for beginning and socially disadvantaged farmers.
The focus of this analysis will be on the Title 1 Commodity Programs that relate to cotton. The Proposal recommends reform of U.S. farm policy to “...make it more market-oriented, more predictable, less market distorting and better able to withstand challenge” (USDA, 2007a, p.6). Among the major recommendations most likely to impact the cotton sector are calls to:
• Adjust the loan rate (LR)—loan rates would be established at 85 percent of the 5-year Olympic average market price, not to exceed a maximum rate of 51.92 cents per pound1. The loan rate under the current farm bill is set at 52 cents per pound.
• Increase direct payments (DP)—with no provisions to update bases or yields, the direct payment for cotton would be increased from 6.67 cents per pound in the current farm bill to 11.08 cents per pound in the USDA proposal.
• Replace the current counter-cyclical payment program (CCP) with revenue-based payments—under this provision producers would receive a CCP when national average revenue falls below target revenue established by the farm bill. National average revenue would be calculated as the national average yield times the marketing year average price or the loan rate, whichever is higher. National target revenue would be the 2002-2006 Olympic average yield (approximately 793 pounds per acre) times the 2002 farm bill target price less the 2002 direct payment (72.40¢ TP minus 6.67¢ DP equals 65.73¢).
• Repeal Step 1 and Step 3 payments—Step 2 payments were eliminated as of August 1, 2006 in accordance with World Trade Organization (WTO) rulings. Step 1 gives the Secretary of Agriculture the authority to lower the Adjusted World Price as needed to improve the sales and flow of U.S. cotton. Step 3 is the import quota. Both Step 1 and Step 3 are seldom used (Shurley, 2007).
• Reform farm program payment limits—current legislation prohibits persons with 3-year average Adjusted Gross Incomes of over $2.5 million from receiving commodity
program payments. The USDA proposal would lower this limit to $200,000.
1
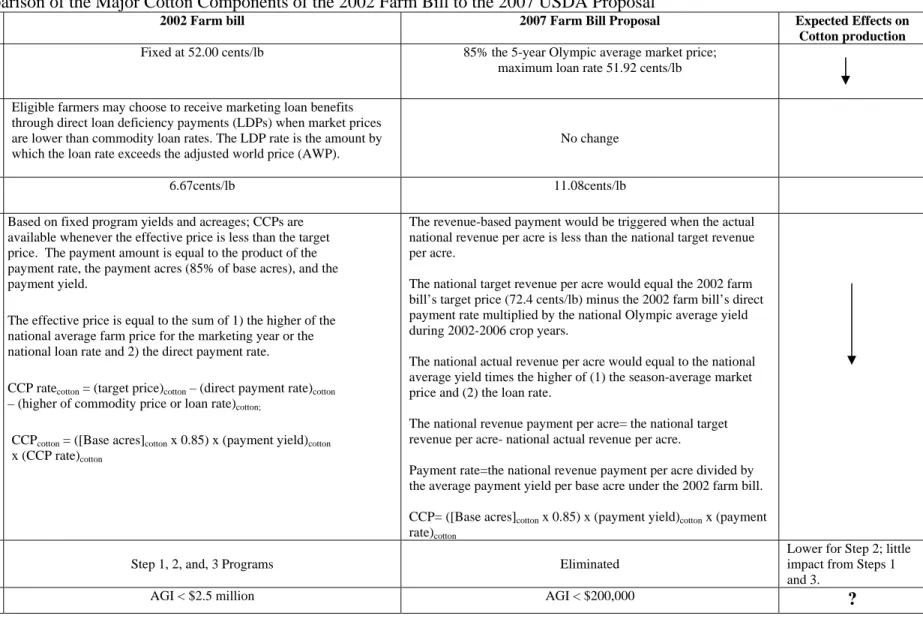
Table 1 summarizes the changes recommended in the USDA proposal and compares them to the current farm program. The expected effects of these policy changes are most likely to be
negative for U.S. cotton. A lower loan rate (which lowers loan deficiency payments) and likely lower counter-cyclical payments would be expected to result in lower net returns from cotton production and thus fewer cotton acres. Higher direct payments for cotton are decoupled from production and theoretically do not influence planting decisions. The elimination of the Step 2 program did away with price incentives for buyers of U.S. cotton, but the Step 1 and Step 3 Programs were rarely used and the loss of these programs is anticipated to be of little effect. Estimates of the impact of new payment limitation rules range from minimal impact (Monke, 2007) to significant concern (Richardson, Outlaw, and Raulston, 2007). Overall, with the exception of higher direct payments, the level of governmental support for U.S. cotton is projected to decline in the USDA proposal.
Baseline projections of the U.S. cotton situation call for fewer cotton acres (due to increased returns for competing crops) and higher market prices (Ethridge, et al., 2007). The baseline assumes the continuation of all current farm and trade policies. Higher prices will result in lower levels of government support even under the current farm bill. If the expected effects discussed above are realized, U.S. cotton plantings may decrease even further and comparatively higher prices would be expected with passage of the USDA proposal. The basic question addressed in this study is whether U.S. cotton producers will be better off under the current farm bill or under the USDA proposal? In other words, this study seeks to sort out whether higher market prices will compensate cotton producers for lost governmental support by comparing expected net farm income under the current farm bill to the USDA proposal.
A Model to Estimate Changes in the Cotton Industry
The World Fiber Model developed by the Cotton Economics Research Institute (CERI) at Texas Tech University is used to estimate the effects of changes in cotton policy on the world’s raw cotton and fiber markets. These estimations provide the basis of CERI’s annual World Cotton Outlook (Ethridge, et al., 2007). The Model is a partial equilibrium econometric model that has also been used to analyze such cases as the Brazilian and West African complaints against U.S. farm policy in the dispute panels of the World Trade Organization (Pan et al., 2006), a
comparison of U.S. farm policy and China’s tariff rate quota system (Pan et al., 2005), the effect of revaluation of China’s currency on world fiber markets (Pan et al., 2005), and the effect of complete trade liberalization in the world cotton market (Pan et al., 2006). Pan et al. (2004) provides complete model explication.
In brief, the World Fiber Model includes 24 major cotton importers and exporters: Asia (Greater China, India, Pakistan, Taiwan, South Korea, Japan, and Other Asia); Africa (West Africa, Egypt, and Other Africa); North America (Mexico, United States, and Canada); Latin America (Brazil, Argentina, and Other Latin America); Oceania (Australia); Middle East (Turkey and Other Middle East); Former Soviet Union (Uzbekistan, Russia, and Other FSU); and Europe (European Union-25 and other Western Europe).
Cotton production is modeled using separate acreage and yield equations. Current production is specified as a function of the previous year’s net returns for cotton and the relative net returns of competing crops. In the U.S. model, cotton production is divided into four regions: Delta, Southeast, West, and Southwest (irrigated and dryland) (see Welch et al., 2005 for a complete schematic of the U.S. and world fiber markets).
Data used in this study was compiled from various sources which include the Food and
Agricultural Policy Research Institute (FAPRI) for the historical and projected macroeconomic variables (real GDP, exchange rate, population, and GDP deflator); Production, Supply & Demand (PS&D) database of the Foreign Agricultural Service (FAS) for cotton acreage, yield, production, mill use, ending stocks, and trade; and the FAO World Fiber Consumption Survey and Fiber Organon for fiber mill consumption and man-made fiber statistics.
World Fiber Model Scenarios
The World Fiber Model was used to create a baseline of projections for cotton production, prices, government support, and net farm income from 2008/09 through the 2013/14 marketing year. Baseline projections are based on normal weather conditions and exogenous macroeconomic estimates. The baseline estimate assumes continuation of all current governmental policies and programs.
After establishing a baseline, the model was run with an alternative set of assumptions allowing for a comparison to be made of the alternate outcomes. In the alternative scenario, specific elements of the USDA proposal were introduced into the model. Due to uncertainty regarding the effect of reform to the payment limitation provisions of the USDA proposal, this element was not included in the analysis.
Simulation Results
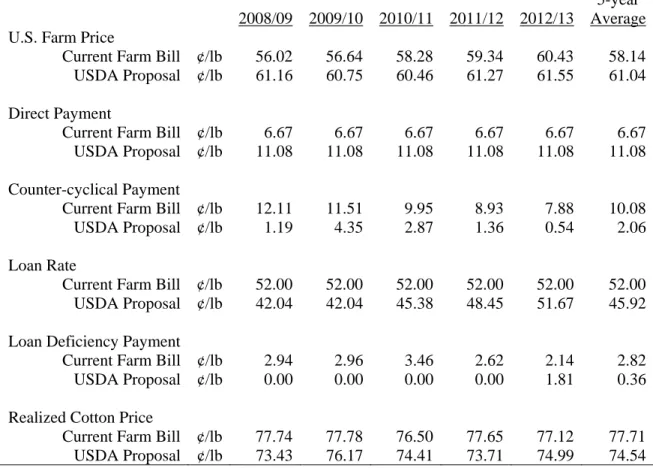
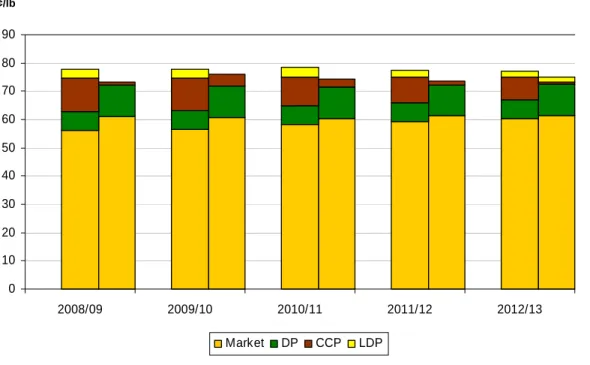
Table 2 compares cotton prices and specific program benefits for historical base acres between the current farm bill and the 2007 USDA proposal. The cotton market price is 5 cents per pound higher in the first year of the USDA proposal (+9%) and averages about 5 percent higher over five years. Counter-cyclical payments average about 10 cents per pound per year under the current farm bill and drop to about 2 cents per pound per year with the USDA proposal. The loan rate falls from a current 52 cents per pound to 42 cents per pound under the Proposal but climbs back near the mandated cap and the current rate in year five. Loan deficiency payments average about 3 cents per pound under the current farm bill but are zero for the first four years of the USDA proposal2. Overall, the realized cotton price (market + DP + CCP + LDP) is 2 to 4 cents lower under the USDA proposal. Figure 1 compares the composition of the realized cotton price in the current farm bill to the USDA proposal (current projections are the segmented bar on
2
These numbers represent projected loan deficiency payments based on marketing year averages for the loan rate and adjusted world price. Given price variability, LDPs may be paid at certain times of the year even though the season average indicates a payment rate of zero. For segmented price estimations, we use the season average. For government expenditure and net income calculations, we use an estimate of actual LDP payment rates based on a calculated marketing loan benefit wedge (see Westhoff, Brown, and Hart, 2005 for further explication of the LDP wedge).
the left of each marketing year, the USDA proposal is segmented on the right). While market prices and direct payments are higher in the Proposal, they do not compensate for lower counter-cyclical payments and lost LDPs.
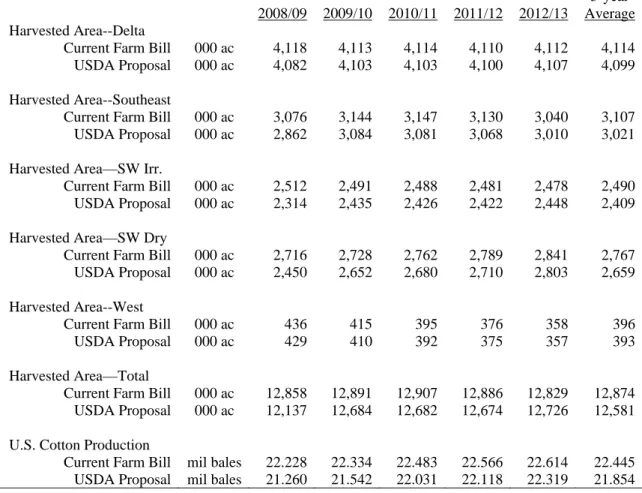
U.S. cotton harvested area is projected to be lower with the USDA proposal relative to the current farm bill (down about 2% on average). The greatest area reductions occur in the first year of the proposed program with harvested area declining 10 percent in the Southwest dryland area, 8 percent in the Southwest irrigated area, and 7 percent in the Southeast. U.S. cotton production is projected lower with lower harvested area. Production averages about 22.4 million bales in the current program but drops about 3 percent to 21.9 million bales under the USDA proposal.
Table 4 and Figures 2 and 3 compare government expenditures and net farm income under the two policies. Government spending declines by more than 40 percent in the first year of the USDA proposal and is down by about 27 percent per year over 5 years. Net farm income is lower under the Proposal as well: down by 15 percent in year one and 11 percent per year lower on average.
Conclusions
This report compared the effects of the 2007 USDA farm bill proposal to the current 2002 legislation in terms of its effects on the U.S. cotton sector. Our analysis shows that, relative to current farm policy, market revenues increase in the USDA proposal while government support decreases. However, net farm income is lower with the USDA proposal as higher market returns do not compensate for lost government price supports.
References
Ethridge, Don, Samarendu Mohanty, Mark Welch, Suwen Pan, and Mohamadou Fadiga. “World Cotton Outlook 2006/07 to 2016/17”, Cotton Economics Research Institute (CERI) Outlook Report CERI-OR07-01, Texas Tech University, March 2007.
Monke, Jim. “Payment Limits for Farm Commodity Programs: Issues and Proposals”, Congressional Research Service (CRS), Order Code RS21493, March 12, 2007.
Pan, Suwen, Samarendu Mohanty, Don Ethridge, and Mohamadou Fadiga. “The Impacts of U.S. Cotton Programs on the World Market: An Analysis of Brazilian and West and Central African WTO Petitions.” Journal of Cotton Science 10 (2006):180-192.
Pan, Suwen, Mohamadou Fadiga, Samarendu Mohanty, and Mark Welch. “Cotton in a Free Trade World”. Economic Inquiry 45 (2007):188-197.
Pan, Suwen, Mark Welch, Samarendu Mohanty, and Mohamadou Fadiga. “Assessing the Impacts of the Chinese TRQ System and U.S. Subsidies on the World Cotton Market”. The
Estey Centre Journal of International Law and Trade Policy 6 (2005): 251-273.
Pan, Suwen, Samarendu Mohanty, Mark Welch, Don Ethridge, and Mohamadou Fadiga. “Effects of Chinese Currency Appreciation on the World Fiber Markets”. Contemporary
Economic Policy 25 (2007):185-205.
Pan, Suwen, Samarendu Mohanty, Mohamadou Fadiga, and Don Ethridge, “Structural Models of the United States and the Rest-of-the-world Natural Fiber Market, ” CER # 04-03, Cotton
Economics Research Institute, Department of Agricultural and Applied Economics, Texas Tech University, 2004.
Richardson, James W., Joe L. Outlaw, and J. Marc Raulston. “Economic Impact of a Proposed AGI Means Test on Representative Crop Farms,” Agricultural and Food Policy Research Center (AFPC) Briefing Paper 07-1, Texas A&M University, February 2007.
Shurley, Don. “USDA Releases Farm Bill Proposal”. Cotton Marketing News, volume 5, February 2, 2007.
U.S. Department of Agriculture (USDA). “U.S. Department of Agriculture’s 2007 Farm Bill Proposals”, USDA, Washington DC, 2007a. Accessed April 19, 2007 and available online at http://www.usda.gov/documents/07finalfbp.pdf.
_____. “Johanns Unveils 2007 Farm Bill Proposals”, USDA Press Release No. 0020.07, January 31, 2007b. Accessed April 19, 2007 and available online at
http://www.usda.gov/wps/portal/!ut/p/_s.7_0_A/7_0_1OB?contentidonly=true&contentid=2007/ 01/0020.xml.
Welch, Mark, Suwen Pan, Mohamadou Fadiga, and Samarendu Mohanty. “The Impacts of Eliminating the Step 2 Program on the U.S. and World Cotton Market”. Briefing Paper CERI-BP05-01, Cotton Economics Research Institute, Texas Tech University, July 2005.
Westhoff, Patrick, Scott Brown, and Chad Hart. “When Point Estimates Miss the Point: Stochastic Modeling of WTO Restrictions”. Food and Agricultural Policy Research Institute (FAPRI) Working Paper #01-05, December 2005.
Table 1. Comparison of the Major Cotton Components of the 2002 Farm Bill to the 2007 USDA Proposal
Program 2002 Farm bill 2007 Farm Bill Proposal Expected Effects on
Cotton production
Loan Rate Fixed at 52.00 cents/lb 85% the 5-year Olympic average market price;
maximum loan rate 51.92 cents/lb Loan Deficiency
Payments (LDPs)
Eligible farmers may choose to receive marketing loan benefits through direct loan deficiency payments (LDPs) when market prices are lower than commodity loan rates. The LDP rate is the amount by which the loan rate exceeds the adjusted world price (AWP).
No change
Direct payments 6.67cents/lb 11.08cents/lb
Counter-Cyclical Payment (CCP)
Based on fixed program yields and acreages; CCPs are available whenever the effective price is less than the target price. The payment amount is equal to the product of the payment rate, the payment acres (85% of base acres), and the payment yield.
The effective price is equal to the sum of 1) the higher of the national average farm price for the marketing year or the national loan rate and 2) the direct payment rate.
CCP ratecotton = (target price)cotton – (direct payment rate)cotton
– (higher of commodity price or loan rate)cotton;
CCPcotton = ([Base acres]cotton x 0.85) x (payment yield)cotton
x (CCP rate)cotton
The revenue-based payment would be triggered when the actual national revenue per acre is less than the national target revenue per acre.
The national target revenue per acre would equal the 2002 farm bill’s target price (72.4 cents/lb) minus the 2002 farm bill’s direct payment rate multiplied by the national Olympic average yield during 2002-2006 crop years.
The national actual revenue per acre would equal to the national average yield times the higher of (1) the season-average market price and (2) the loan rate.
The national revenue payment per acre= the national target revenue per acre- national actual revenue per acre.
Payment rate=the national revenue payment per acre divided by the average payment yield per base acre under the 2002 farm bill. CCP= ([Base acres]cotton x 0.85) x (payment yield)cotton x (payment
rate)cotton
Cotton Competitiveness
Provisions
Step 1, 2, and, 3 Programs Eliminated
Lower for Step 2; little impact from Steps 1 and 3.
Table 2. Comparisons of Farm Price and Government Support Payment Rates under the Current Farm Bill and the USDA Proposal
2008/09 2009/10 2010/11 2011/12 2012/13
5-year Average
U.S. Farm Price
Current Farm Bill ¢/lb 56.02 56.64 58.28 59.34 60.43 58.14
USDA Proposal ¢/lb 61.16 60.75 60.46 61.27 61.55 61.04
Direct Payment
Current Farm Bill ¢/lb 6.67 6.67 6.67 6.67 6.67 6.67
USDA Proposal ¢/lb 11.08 11.08 11.08 11.08 11.08 11.08
Counter-cyclical Payment
Current Farm Bill ¢/lb 12.11 11.51 9.95 8.93 7.88 10.08
USDA Proposal ¢/lb 1.19 4.35 2.87 1.36 0.54 2.06
Loan Rate
Current Farm Bill ¢/lb 52.00 52.00 52.00 52.00 52.00 52.00
USDA Proposal ¢/lb 42.04 42.04 45.38 48.45 51.67 45.92
Loan Deficiency Payment
Current Farm Bill ¢/lb 2.94 2.96 3.46 2.62 2.14 2.82
USDA Proposal ¢/lb 0.00 0.00 0.00 0.00 1.81 0.36
Realized Cotton Price
Current Farm Bill ¢/lb 77.74 77.78 76.50 77.65 77.12 77.71
Table 3. Comparisons of U.S. Cotton Harvested Area and Production under the Current Farm Bill and the USDA Proposal
2008/09 2009/10 2010/11 2011/12 2012/13
5-year Average
Harvested Area--Delta
Current Farm Bill 000 ac 4,118 4,113 4,114 4,110 4,112 4,114 USDA Proposal 000 ac 4,082 4,103 4,103 4,100 4,107 4,099
Harvested Area--Southeast
Current Farm Bill 000 ac 3,076 3,144 3,147 3,130 3,040 3,107 USDA Proposal 000 ac 2,862 3,084 3,081 3,068 3,010 3,021 Harvested Area—SW Irr.
Current Farm Bill 000 ac 2,512 2,491 2,488 2,481 2,478 2,490 USDA Proposal 000 ac 2,314 2,435 2,426 2,422 2,448 2,409 Harvested Area—SW Dry
Current Farm Bill 000 ac 2,716 2,728 2,762 2,789 2,841 2,767 USDA Proposal 000 ac 2,450 2,652 2,680 2,710 2,803 2,659
Harvested Area--West
Current Farm Bill 000 ac 436 415 395 376 358 396
USDA Proposal 000 ac 429 410 392 375 357 393
Harvested Area—Total
Current Farm Bill 000 ac 12,858 12,891 12,907 12,886 12,829 12,874 USDA Proposal 000 ac 12,137 12,684 12,682 12,674 12,726 12,581 U.S. Cotton Production
Current Farm Bill mil bales 22.228 22.334 22.483 22.566 22.614 22.445 USDA Proposal mil bales 21.260 21.542 22.031 22.118 22.319 21.854
Table 4. Comparisons of Government Expenditures and Net Farm Income under the Current Farm Bill and the USDA Proposal
2008/09 2009/10 2010/11 2011/12 2012/13
5-year Average
Government Expenditures
Current Farm Bill $bil 2.687 2.513 2.378 2.204 2.096 2.375
USDA Proposal $bil 1.585 1.877 1.750 1.620 1.779 1.722
Net Farm Income
Current Farm Bill $bil 3.920 3.730 3.697 3.672 3.719 3.748
Figure 1. Comparison of Cotton Prices and Season Average Government Payment Rates under the Current Farm Bill and the USDA Proposal
0 10 20 30 40 50 60 70 80 90 2008/09 2009/10 2010/11 2011/12 2012/13 Market DP CCP LDP ¢/lb
Figure 2. Comparison of Government Expenditures under the Current Farm Bill and the USDA Proposal 0.0 0.5 1.0 1.5 2.0 2.5 3.0 2008/09 2009/2010 2010/11 2011/12 2012/13
Current Farm Bill USDA Proposal
0.0 0.5 1.0 1.5 2.0 2.5 3.0 3.5 4.0 4.5 2008/09 2009/2010 2010/11 2011/12 2012/13
Current Farm Bill USDA Proposal