Urban Public Economics Review
ISSN: 1697-6223
info@uper.org
Universidade de Santiago de Compostela España
Porto, Alberto; Porto, Natalia; Tortarolo, Darío
“Glocalization” and decentralization. The role of local governments in the new international context Urban Public Economics Review, núm. 20, enero-junio, 2014, pp. 62-93
Universidade de Santiago de Compostela Santiago de Compostela, España
Available in: http://www.redalyc.org/articulo.oa?id=50432637004
63 62
“Glocalization” and decentralization. The role of
local governments in the new international
context*
Alberto Porto, Natalia Porto y Darío Tortarolo **
Globalization, technological changes and the information revolution are phenomena that affect the ways in which different levels of government allocate their public resources and expenditures. This paper examines one aspect of the problem: the decentralization of the subnational public sector and its relation to economic integration. The study focuses on Argentina and Brazil with a panel data for each country separately, for the period 1985-2005. The results show no relationship between the vertical structure of the subnational public sector and economic openness. There may be two explanations for this: factors working in opposite directions compensate their effects; or interferences from higher levels of government prevent modifications. The control variables have the signs suggested by the theory of fiscal federalism.
JEL Classification: F15, H77
Keywords: globalization, information revolution, glocalization, local governments.
La globalización, los avances tecnológicos y la revolución informática son fenómenos que afectan la distribución de las funciones y los recursos públicos entre los niveles de gobierno. En este trabajo se investiga un aspecto de esta problemática: la descentralización del sector público subnacional y su relación con la apertura económica. El estudio se realiza para la Argentina y Brasil con un panel de datos, para cada país por separado, para el período 1985-2005. Los resultados muestran ausencia de relación entre la estructura vertical del sector público subnacional y la apertura económica. Es posible encontrar dos explicaciones para este
* Paper presented at the II Jornadas Iberoamericanas de Financiación Local, Universidad Nacional de La Plata, Argentina, July, 2013, and at the 44th Annual Meeting of the Urban Affairs Association, San Antonio, TX, USA,March 2014.
** National University of La Plata (Argentina). Corresponding author: Alberto Porto. Calle 28 Nª 235. La Plata (1900) Argentina. E-mail: porto.alb@gmail.com
U r b a n P u b li c E c o n o m ic s R e v ie w | R e v is ta d e E c o n o m ía P ú b li c a U r b a n a
fenómeno: por un lado, factores que influyen en direcciones opuestas que compensan sus efectos; o interferencias desde los niveles centrales de gobierno que impiden los cambios. Las variables de control tienen signos compatibles con la teoría del federalismo fiscal.
In the new international context that has characterized economies in the last decades, globalization, technological changes and the information revolution are phenomena that are affecting the way in which different levels of government allocate their public resources and expenditures, both within a country and among countries. The expected impacts are summarized in Bell’s quotation (1987): “the nation-state is becoming too small for the big problems of life, and too big for the small problems of
life”. This change was called “glocalization”1 (Courchene, 1993), which
involves an increased role for global governments (and institutions) and local governments, and a secondary role for national and provincial levels of governments. In the new “glocalization” context an important question is how the vertical structure of the public sector has been modified since there have been tendencies against and for decentralization (Garrett and Rodden, 2003; Stegarescu, 2009; Ermini and Santolini, 2010, 2011).
This paper examines one aspect of the problem: the decentralization of the subnational public sector and its relation to economic integration. The study is performed for Argentina and Brazil, the quantitatively most
important countries in MERCOSUR,2 with a panel data for each country
separately, for the period 1985-2005. Our main question is if the (local) municipal participation has increased or decreased within the subna-tional public sector (municipalities plus provinces/states) due to eco-nomic openness. The determinants of decentralization identified in the theories of fiscal federalism are used as control variables.
The paper is organized as follows. In Section II, the main arguments for and against fiscal decentralization within a country, which result from 1According to Sharma (2008), the expression “glocalization” had its origin in studies of
Japanese economists and it is referred to the adaptation of agricultural techniques to local conditions. The sociologist Robertson (1992) used the term to refer to the uni-versalization of the particular and the particularization of the universal; that is, the “conjunction of universality and singularity” (Sebrelli, 2012, pp. 406-407).
2 The Common Market of the Southern Cone (MERCOSUR) was created in 1991 by
65 64
normative and positive theories of fiscal federalism, are presented. Most theoretical and empirical studies are developed for closed economies and for decentralization measured by the relationship between subnational and total expenditures and revenues. The novelty in this work lies in considering the subnational dimension of fiscal decentralization in open economies. In Section III, empirical analysis -data, model, variables and estimates- is addressed. Section IV shows the conclusions.
The results show no relationship between the vertical structure of the subnational public sector and economic openness, which may be only valid for the short term. As phenomena linked to modernity are, as they seem, irreversible, their forces will join to the other variables leading to greater participation of local governments. The challenge is to modernize and strengthen them for this new scenario. Two obstacles appear in the way: on the one hand, the resistance of provincial governments to lose fiscal powers in favor of lower levels of government; on the other hand, the interference of the national government in the life of the local govern-ments. These obstacles are present both in Argentina and Brazil.
Theory and empirical evidence
Theory
The main question of this paper is if the (local) municipal participation has increased or decreased within the subnational public sector (munici-palities plus provinces/states) due to the new integration processes that have been affecting economies during the last years. Trade agreements proliferation and trade easiness, financial integration and the revolution in production technologies, communications and services, among other aspects, are part of a scenario of a globalized world in which it is interesting to investigate how decentralization, both of revenues and expenditures, responds. To carry out this work, there are certain difficulties not only in defining conceptually but also in quantifying a variable that reflects all the aspects that integration involves. As a proxy, we use one dimension of eco-nomic openness: the relationship between level of exports and gross domes-tic product (GDP). The arguments for and against fiscal decentralization, both in a closed and in an open economy, are considered below.
In a closed economy, there are arguments for and against fiscal
decen-tralization that come from the normative and positive theories of fiscal
federalism. In the normative theory, the degree of decentralization results from the trade-off between benefits –the better adaptation of the offer of
U r b a n P u b li c E c o n o m ic s R e v ie w | R e v is ta d e E c o n o m ía P ú b li c a U r b a n a
the local public goods to the demand in each locality (preference match-ing)- and costs –due to the loss of economies of scale and the presence of interjurisdictional externalities. In the positive theory, the trade-off results from the benefits of greater control of politicians and bureaucrats by the citizenry (accountability) and the costs due to perverse incentives for fiscal responsibility that intergovernmental transfers can generate. Most theoretical and empirical studies are developed for closed economies, and the degree of decentralization -measured by the relationship between subnational and total expenditures and revenue- is the variable to be explained. In few of these papers, the degree of decentralization within the subnational sector (municipal in relation to subnational expenditures and revenues) is studied (Wallis and Oates, 1988).
In the new international context there are new factors which can also explain fiscal decentralization. From an initial closed economy scenario, the international context generates movements in both directions, strengthening or weakening decentralization. On the one hand, due to the improvement in transport and communications, free trade enables to obtain goods at lower prices without the need of great extension, which weakens the argument of economies of scale in favor of centralization. Additionally, if there are differences in the preferences of the jurisdictions, the centralized government, in the new context, will have greater avail-ability of information, which may also lead to reduce the heterogeneity of preferences and the advantages of decentralization. Moreover, informa-tion disseminainforma-tion generates higher pressure for decision making at the local level since it increases the power of decision of the citizens against central governments.
On the other hand, the common market (openness) generates
incen-tives for subnational governments to invest their revenues efficiently,
which enables their jurisdictions to improve their competitive position (Quian and Weingast, 1997; Weingast, 1995, 2009). Globalization
gener-ates greater productive specialization of regions, non-coordinated business
cycles among regions, and winner and loser jurisdictions and persons, which will demand national compensatory policies –insurance role (Rodrik, 1998).
Two obstacles arise for local government decentralization: on the one hand, the resistance of provincial governments to lose fiscal powers in favor of lower levels of government; on the other hand, direct interference from the national government on local governments. Some literature (de Figue-iredo and Weingast, 2005; Oates, 2005) considers that within society and
67 66
the public sector there are forces that may weaken the structure and
func-tioning of the federal system:1) the intrusion of upper level of governments,
which reduce the power of decentralized governments and can lead to the
destruction of the federal system; 2) the opportunistic behavior of lower
levels of government which seek to obtain benefits for their jurisdictions from transferring costs to the rest of the country. The stability and govern-ance of the federal system is a delicate balgovern-ance between these two forces.
Specifically for Brazil and Argentina, it is possible to find concrete examples of the facts previously mentioned. In Brazil the Constitution of 1988 recognizes three level of government –the Union, the States and the Municipalities. In contrast with other federal countries, the relationship between the three levels of government is between principals. The Con-stitution considers Municipalities as members of the Federation with broad autonomy. This autonomy is reflected at the state level by a lower vertical imbalance, but when full account of national regulations is intro-duced, it is clear that autonomy in decision making by subnational gov-ernments is considerably reduced. Something similar happens at the municipal level. Gomes (2012) documents that due to national
regula-tions the index of autonomy of the states reduces from 77.1 percent to
48.6 percent, and the one corresponding to subnational governments (states plus municipalities) from 61.7 percent to 33 percent (year 2004). In Argentina, at least in the Constitution, the relationship between the nation and the provinces is between principals, but it looks distorted in practice by the interference of the central government. This intrusion is possible by the important vertical imbalance due to revenue centralization and expenditure decentralization. Provinces have weak and distortionary tax bases and poor access to credit. Moreover, the relationship between the provinces and their municipalities is of principal-agent type, that is, the political power of the provinces is strong in comparison with the one
of the municipalities.3 Provinces regulate the functions and resources of
the municipal governments and dictate the regulations of transfers. In Argentina there is great national interference in subnational finances. Not only the total revenue is highly centralized (almost three quarters at the head of the national government), but also national regulations reduce the total amount and the power of decision making by subnational gov-ernments in relation to the destination of the transfers. The intricate 3 An example is the failure of several of the provinces in fulfilling the mandate of the 1994
U r b a n P u b li c E c o n o m ic s R e v ie w | R e v is ta d e E c o n o m ía P ú b li c a U r b a n a
mechanism for the distribution of the national revenue between the Nation and the Provinces, and among provinces is a clear example (Bertea, 2012). The intrusion of the central government, which has concentrated on provincial governments for a long time, is now extended to municipal governments. One proof is the growing share of direct transferences to
municipalities,4 designed apparently to improve the local decision process
and to strengthen decentralization but actually, it is a mean of political
control of the municipalities.5 The net result of various forces -economic,
political and social- which operate in opposite directions is an empirical issue that is discussed in the next section.
The previous arguments are similar for resources, but there is an addi-tional tension between centralization and decentralization. On one hand, the second generation theories of fiscal federalism recommend to
decentral-ize revenues pari passu with expenditures to maintain fiscal discipline in the
subnational sector. On the other hand, recent progress in communications and transports, which made possible high mobility of financial flows, goods and people, provide a stage for tax competition between countries within an economic union and between regions within a country, resulting in the need of coordination and harmonization. The problems of coordination and har-monization become more complex when the vertical structure of public sector is taken into account. If all the countries/regions have their revenue
tax system centralized, the difficulty of harmonization will be lower.6
Empirical evidence
This section presents a brief review of empirical studies on the issue. The relationship between fiscal decentralization and economic integration has been subject of recent empirical studies with all the research referred 4 Direct transfers from the national government to the municipalities in Argentina have
increased suddenly in the recent times.
5 Another recent example in Argentina is that due to the increase in agricultural prices,
the price of rural land, which is taxed by the province and municipalities, also increa-ses. The national government imposed taxes on the exports and captured the largest fraction of the increase on land rent, limiting the possibility of raising revenues of the municipalities. Provinces had a behavior similar to the nation. Municipalities, with less constitutional and political power, could not take advantage of the increasing value of this tax base.
6 There is vast literature about fiscal coordination and harmonization in a common
69 68
to decentralization measured by the relationship between subnational expenditures (revenues) and total expenditures (revenues).
Garrett and Rodden (2003) estimate a panel data model for a hetero-geneous set of 47 industrialized and developed countries for the period 1978-1997. They find a negative relationship between economic integration -measured by the degree of trade and/or financial openness of countries- and fiscal decentralization. As a measure of fiscal decentralization, they use the relationship between subnational public expenditure and total public expenditure, excluding tax-related measures. Stegarescu (2009)
distinguishes -particularly in the case of the European Union- between
economic integration (trade and financial openness) and political
inte-gration.7 He uses a panel data model of twenty three countries of the
OECD -relatively homogeneous in terms of being industrialized and democratic countries- for the period 1965-2001. The results show a positive
and significant relationship (5 percent) between economic integration
(trade and financial openness) and fiscal decentralization on the
expend-iture side. When they use a measure of decentralization on the tax side,8
both integration measures have positive signs as previously, but only trade openness is significant (10 percent). Political integration measures have no significant effects on fiscal decentralization. Ermini and Santolini (2010) find, for a sample of sixteen OECD countries in the period 1978-1997, a positive and significant relationship between fiscal decentralization (both for expenditures and revenues) and the KOF globalization index proposed by Dreher (2006). Ermini and Santolini (2011) decompose the effects of the index taking into account the different dimensions that it 7 The measures of political integration used are:
a) a dummy variable which represents whether the country belongs or not to the European Union;
b) a variable of interaction between this dummy variable and the participation of the expenditure of the European Union in relation to the total expenditure of the member states, which -unlike the previous one- captures the degree of progress in the political integration; and
c) a variable that measures the different degrees of integration among countries (belon-ging to a free trade area, a custom union, an economic and monetary union, among others).
8 The measure of revenue decentralization takes into account the revenue on which
sub-national governments have significant control (autonomous tax revenue) in relation to the total income of the public sector.
U r b a n P u b li c E c o n o m ic s R e v ie w | R e v is ta d e E c o n o m ía P ú b li c a U r b a n a
reflects: economic, political, and social integration.9 They conclude that
the main determinant of fiscal decentralization (both for expenditures and revenues) is social integration, and that the results found in Ermini and Santolini (2010) on the positive and significant correlation between fiscal decentralization and the global index KOF are mainly due to the increasing social interdependence between countries (that is, an increas-ing flow of social information, personal contacts and cultural proximity between countries). It is interesting to mention that the KOF economic index is not significant in most of the estimates.
Although this paper focuses on the subnational dimension of decentrali-zation, estimates about the aggregate relationship between expenditure and revenue decentralization and trade openness are also carried out (Table A3
from Appendix).10 The results show that the relationship is negative for
expenditure decentralization in Argentina and not statistically significant when own revenues are considered. For Brazil, it is not significant both for revenues and expenditures. Because this is an estimate at an aggregate level, it is possible to approximate the relationship between decentralization and
globalization through the KOF index (Table A4 from Appendix); the
relation-ship is only positive and significant for the decentralization of expenditure and revenues in Brazil. As a novelty, the regional dimension of the aggregate measure has been studied (Porto, Porto and Tortarolo, 2014). In this case, the relationship at the level of each state/province is estimated using a depend-ent variable related to decdepend-entralization, which is called contribution of each 9 The KOF index summarizes twenty three variables that relate different dimensions of
economic, political and social integration. The index of economic integration is built with information about flows of trade and investment; and economic constraints such as barriers to imports, taxes on international trade and the capital account of the balan-ce of payments. The index associated with the political dimension includes the presen-ce of embassies in a country, participation in international treaties and international organizations, among other variables. The social index is built with information of international tourism, information flows (using the internet, telephone) and cultural proximity. The KOF index can be found on http://globalization.kof.ethz.ch/.
10 The aggregate measures of decentralization at the national level are the expenditures of subnational governments (states and municipalities) in relation to total
expendi-tures: , where Em is the municipal expenditure by
state, Es is the subnational expenditure and Er is the national expenditure. Similarly, the indicator for own resources is built. The economic openness indicator is measured by the ratio (X+M) /GDP.
71 70
state/province to the expenditure (revenue) decentralization. Contribution is negative and significant both for expenditures and revenues in Brazil, and negative or not significant in Argentina. The negative sign means that states which are more opened (measured by the relationship between exports and
GDP), have a lower level of decentralization.11
Another branch of the literature refers to the relationship between the size of the public sector and trade openness. Among others, Alesina, Baqir and Easterly (2000) and Rodrik (1998) find a positive and significant relationship between the size of the government and the degree of exposure to international trade. This could be explained considering that public
spending has an insurance role against adverse external shocks. Although
they do not work with the division of expenditures among levels of gov-ernment, most of the expenditures that have an insurance role are in the field of national governments. In all of the above mentioned cases, esti-mates include fiscal and non-fiscal aggregate variables, at country level.
Empirical analysis for Argentina and Brazil
Data
This section presents an overview of the fiscal and foreign trade variables, of interest to this paper, at an aggregate level, for Argentina and Brazil, for the year 2005 (Table 1).
Population, area, density, income inequality (Gini coefficient) and pov-erty are higher in Brazil. Argentina shows a greater degree of urbanization and trade openness. The GDP per capita depends on the unit of measure: on the basis of purchasing power parity (PPP), the GDP per capita is greater in Argentina; however, in current US dollars in each country, they are similar. In Brazil, public expenditures, in terms of GDP, amount to 34.3 percent ver-sus 27.3 percent in Argentina. In Brazil, expenditures are more centralized
11 Expenditure decentralization in state i, in year t, is .
If the national public good is Samuelsonian, that is, if all jurisdictions benefit with the same amount of the good (Eri=Er), when comparing two jurisdictions, if , fiscal decentralization is higher in i compared with j. Contribution to decentralization is used as a dependent variable assuming a unifor m distr ibution of national expenditure in all jur isdictions . Contribution is higher as decentralization is higher. This definition, which is a transformation of Decit, is used because the sum of contributions is equal to total decentralization.
U r b a n P u b li c E c o n o m ic s R e v ie w | R e v is ta d e E c o n o m ía P ú b li c a U r b a n a
(56.7 percent) than in Argentina (51.3 percent).12 The reverse is true for
public revenues: 76.4 percent in the national government in Argentina, and 69.6 percent in Brazil. Both countries show a public sector with vertical imbal-ance: the subnational government (state or provinces and municipalities)
finances 77 percent of its expenditures with own revenues in Brazil, and 46.2
percent in Argentina. At the municipal level, the percentages are 43 percent and 52 percent, respectively. From the point of view of the insertion in inter-national trade, trade openness -measured by exports plus imports in terms of GDP- is 27 percent in Brazil and 44 percent in Argentina. Using the KOF index, both countries present similar values for the aggregate (60 percent) with differences on the economic and social KOF, not on the political one.
Table 1. Descriptive Statistics - Brazil and Argentina - Year 2005
Variables Brazil Argentina
Population (in mill.) (1) 190.7 40.1
Area (in mill. km2) (1) 8.5 3.7
Population Density (hab/km2) (1) 22.4 10.7
Degree of Urbanization (%) (1) 81.2 89.4 Gini Index (2) 0.569 0.488 Incidence of Poverty (%) (3) 22.9 15.4 Trade Openness (X + M)/GDP (%) (4) 26.6 44.2 Openness (X / GDP) (%) (4) 15.1 25.1 Openness (M / GDP) (%) (4) 11.5 19.2 KOF Index (%) (5) 60.3 61.6 Economic KOF 57.0 51.5 Social KOF 41.8 50.0 Political KOF 92.1 93.0 GDP pc, PPP (constant 2005 U$S) (6) 8509 10833 GDP pc (current U$S) (6) 4743 4736 Public Expenditures (% of GDP) 34.3 27.3 Nation (Union) 19.5 14.0 Provinces (States) 10.1 10.6 Municipalities 4.6 2.7
12 The intermediate or subnational levels consist of provinces and municipalities. States and provinces will be used indistinctly.
73 72 Public Revenues (% of GDP) 37.2 29.7 Nation (Union) 25.9 22.7 Provinces (States) 9.3 5.5 Municipalities 2.0 1.4
Public Expenditures pc (U$S) 1781.4 1377.1
Nation (Union) 1012.5 706.1
Provinces (States) 527.1 533.4
Municipalities 241.8 137.6
Public Revenues pc (U$S) 1936.3 1498.4
Nation (Union) 1344.5 1149.1 Provinces (States) 485.5 279.2 Municipalities 106.3 70.2 Fiscal Correspondence % (Revenues/Expenditures) 108.7 108.8 Nation (Union) 132.8 162.7 Provinces (States) 92.1 52.3 Municipalities 44.0 51.0 Fiscal Decentralization %
Subnational / Total – Expenditures 43.2 48.7
Subnational / Total – Revenues 30.6 23.3
Municipal / Subnational - Expenditures 31.4 20.5
Municipal / Subnational - Revenues 18.0 33.6
Source: (1) Brazil: IBGE, Population Census 2010. Argentina: INDEC (National Institute of Statistics
and Census), National Census of Population and Housing 2010. National Geographic Institute (IGN). (2) Brazil: Institute of Applied Economic Research (IPEA); Argentina: SEDLAC (CEDLAS and the World Bank). (3) SEDLAC. Poverty Line USD-2.50-a-day. (4) World Development Indicators (WDI), World Bank national accounts data. (5) Dreher (2006). (6) WDI, World Bank national accounts data. Source Revenues and Expenditure: Brazil: Nation: IBGE and Ministry of Finance-Natio-nal Treasury Secretariat - IPEA and Finbra database The disaggregated data of expenditures and revenues from the FINBRA corpus do not match the consolidated data available from the Treasury. The tax correspondence coefficient is bigger when FINBRA data are used. As in this study data are disaggregated at the level of municipalities, the indicator –at a national level- is the sum of the contributions that each state makes to decentralization (Table 2). Argentina: Ministry of Economy and Production, Secretariat of Finance, National Budget Office (ONP) (1961-2004 period). Own estimates based on ONP (2005-2008 period).
U r b a n P u b li c E c o n o m ic s R e v ie w | R e v is ta d e E c o n o m ía P ú b li c a U r b a n a T a b le 2 . D e s c r ip t iv e S t a t is t ic s S t a t e s o f B r a z il Y e a r 2 0 0 5 S t a t e s Po pu la tio n (in m ill .) Ar ea (m ill k m2 ) Po pu la tio n D en -sit y (h ab /k m2 ) De gre e o f U rb a-niz at io n (in % ) Tr ad e Op en ne ss ( in %) Gin i I nd ex In cid en ce o f Po ve rt y Re la tiv e G DP p c F is c a l D e c e n tr a li z a ti o n ( in % ) F is c a l C o r re s p o n d e n -c e ( in % ) ( s u b n a t / to ta l) ( m u n ic ip a l / s u b n a t) ( R e v e n u e s / E x p e n d it u r e ) E x p e n d R e v e -n u e E x p e n d R e v e -n u e S ta te s M u n i-c ip S u b n a t ( 1 ) ( 1 ) ( 1 ) ( 1 ) ( 2 ) ( 3 ) ( 3 ) ( 4 ) Ac r e 0 .7 0 .1 6 4 .5 6 6 .4 0 .7 0 .5 8 3 4 7 .4 6 5 0 .2 5 0 .0 6 1 6 .0 6 .5 2 7 .9 1 0 .3 2 5 .1 A la g o a s 3 .1 0 .0 3 1 1 2 .3 6 8 .0 1 0 .1 0 .5 6 6 6 0 .5 4 1 0 .5 5 0 .1 7 3 0 .9 1 0 .5 4 2 .5 1 1 .2 3 2 .8 A m a p á 0 .5 0 .1 4 3 .3 8 9 .0 4 .3 0 .5 2 5 3 7 .9 7 4 0 .2 0 0 .0 3 1 3 .7 9 .9 1 8 .2 1 2 .6 1 7 .5 A m a z o n a s 2 .8 1 .5 6 1 .8 7 4 .9 1 5 .7 0 .5 1 1 4 0 .0 9 6 0 .8 0 0 .4 9 2 7 .7 8 .7 8 5 .2 2 1 .2 6 7 .5 B a h ía 1 4 .0 0 .5 6 2 4 .8 6 7 .1 1 6 .0 0 .5 5 4 5 1 .4 5 6 2 .3 8 1 .3 2 3 0 .6 8 .7 7 9 .3 1 7 .1 6 0 .2 C e a r á 8 .4 0 .1 5 5 6 .7 7 1 .5 5 .6 0 .5 7 8 5 2 .2 4 5 1 .3 2 0 .6 9 3 1 .6 1 4 .5 7 0 .8 2 6 .1 5 6 .7 E s p ír it o S a n to 3 .5 0 .0 5 7 6 .2 7 9 .5 2 8 .8 0 .5 5 8 1 9 .5 1 2 4 1 .0 1 0 .8 9 2 6 .5 9 .0 1 1 7 .8 3 2 .2 9 5 .1 G o iá s 6 .0 0 .3 4 1 7 .7 8 7 .9 8 .8 0 .5 5 7 2 0 .5 8 2 1 .2 7 0 .7 9 3 0 .3 1 4 .2 8 4 .0 3 2 .0 6 8 .3 M a r a n h a o 6 .6 0 .3 3 1 9 .8 5 9 .5 1 4 .4 0 .5 2 1 6 0 .0 3 6 0 .7 3 0 .2 2 3 9 .6 1 0 .4 4 9 .4 8 .8 3 3 .3 M a to G r o s s o 3 .0 0 .9 0 3 .4 7 9 .4 2 7 .0 0 .5 2 3 2 1 .0 1 2 1 0 .8 4 0 .5 3 2 9 .3 8 .9 8 8 .2 2 0 .7 6 8 .5 M a to G r o s s o d o S u l 2 .4 0 .3 6 6 .9 8 4 .1 1 2 .9 0 .5 3 3 2 0 .6 8 5 0 .6 7 0 .4 3 3 1 .2 1 4 .1 8 6 .6 3 1 .2 6 9 .3 M in a s G e r a is 1 9 .6 0 .5 9 3 3 .4 8 2 .0 1 7 .1 0 .5 2 7 1 9 .8 8 7 4 .2 0 2 .9 8 3 4 .5 1 4 .7 1 0 0 .5 3 2 .7 7 7 .1 P a r á 6 .2 1 .2 5 5 .0 6 6 .5 2 9 .9 0 .5 1 4 4 4 .7 5 1 1 .0 1 0 .4 3 3 5 .6 1 2 .0 6 3 .6 1 5 .7 4 6 .6
75 74 P a r a íb a 3 .8 0 .0 6 6 6 .9 7 1 .1 3 .3 0 .5 8 1 5 1 .1 4 0 0 .6 6 0 .2 4 3 2 .8 6 .2 5 5 .5 7 .5 3 9 .8 P a r a n á 1 0 .4 0 .2 0 5 2 .4 8 1 .4 1 9 .3 0 .5 3 9 2 1 .6 1 0 7 2 .2 4 1 .6 6 3 4 .3 2 0 .8 9 7 .0 4 8 .7 8 0 .4 P e r n a m b u c o 8 .8 0 .1 0 8 9 .6 7 6 .5 3 .8 0 .5 8 7 5 5 .4 5 1 1 .5 6 0 .8 6 2 9 .6 1 3 .0 7 3 .8 2 6 .4 5 9 .8 P ia u í 3 .1 0 .2 5 1 2 .4 6 2 .9 1 .3 0 .5 9 1 5 7 .1 3 2 0 .4 8 0 .1 4 3 2 .5 1 2 .3 4 0 .6 1 1 .8 3 1 .2 R io d e J a n e ir o 1 6 .0 0 .0 4 3 6 5 .3 9 6 .0 8 .1 0 .5 5 7 2 1 .5 1 3 9 4 .8 2 3 .7 6 3 1 .9 2 1 .9 9 7 .3 5 8 .3 8 4 .8 R io G r a n d e d o N o r te 3 .2 0 .0 5 6 0 .0 7 3 .3 5 .6 0 .5 9 8 4 7 .6 5 2 0 .6 6 0 .2 8 3 1 .8 1 1 .8 5 8 .9 1 6 .9 4 5 .6 R io G r a n d e d o S u l 1 0 .7 0 .2 7 3 9 .8 8 1 .6 1 7 .7 0 .5 2 0 2 0 .6 1 1 5 2 .7 4 2 .0 4 3 0 .3 1 8 .2 9 4 .8 4 8 .3 8 0 .7 Ro n d o n ia 1 .6 0 .2 4 6 .6 6 4 .1 3 .8 0 .5 6 8 3 7 .6 7 6 0 .3 9 0 .1 8 2 5 .6 5 .2 6 5 .2 1 0 .3 5 1 .2 Ro r a im a 0 .3 0 .2 2 1 .4 7 6 .1 0 .7 0 .5 4 5 4 8 .5 8 0 0 .1 7 0 .0 2 1 9 .1 9 .4 1 7 .9 7 .9 1 6 .0 S a n ta C a ta r i-n a 6 .2 0 .1 0 6 5 .3 7 8 .7 1 6 .0 0 .4 6 1 1 0 .5 1 2 9 1 .5 1 1 .1 0 3 6 .4 1 9 .2 1 0 1 .2 4 1 .9 7 9 .6 S a o P a u lo 4 1 .3 0 .2 5 1 6 6 .2 9 3 .4 1 2 .8 0 .5 3 2 1 7 .8 1 5 9 1 1 .8 3 1 0 .9 7 3 1 .0 2 2 .2 1 1 3 .6 7 2 .1 1 0 0 .7 S e r g ip e 2 .1 0 .0 2 9 4 .4 7 1 .4 1 .2 0 .5 5 4 4 6 .9 6 1 0 .4 9 0 .1 9 2 8 .0 9 .8 5 4 .0 1 5 .0 4 3 .1 T o c a n ti n s 1 .2 0 .2 8 4 .2 7 4 .3 4 .3 0 .5 3 5 4 3 .1 6 4 0 .4 0 0 .1 0 2 3 .7 5 .3 3 4 .2 6 .2 2 7 .6 T o t a l B r a z il * 1 9 0 .7 8 .5 0 2 2 .4 8 1 .2 1 3 .4 0 .5 6 9 3 0 .8 1 0 0 4 3 .2 3 0 .6 3 1 .4 1 8 .0 9 2 .1 4 4 .0 7 7 .0 S o u r c e : ( 1 ) I B G E , P o p u la ti o n C e n s u s 2 0 1 0 . ( 2 ) F o r e ig n T r a d e S e c r e ta r ia t ( S E C E X ) , D e p a r tm e n t o f D e v e lo p m e n t a n d P la n n in g o f F o r e ig n T r a d e ( D E P L A ) . ( 3 ) I P E A a n d B a s e Fi n b r a . ( 4 ) c a lc u la te d b y t h e r e la ti o n s h ip b e tw e e n t h e v a lu e o f e a c h s ta te a g a in s t t h e n a ti o n a l a v e r a g e , m u lt ip li e d b y 1 0 0 . S o u r c e r e v e n u e s a n d e x p e n d it u -r e s : M in is tr y o f Fi n a n c e , N a ti o n a l T r e a s u r y S e c r e ta r ia t. B a s e F IN B R A a n d I P E A . * T o ta ls i n c lu d e F e d e r a l D is tr ic t. S u b n a ti o n a l c o r r e s p o n d s t o p r o v in c e s a n d m u n i-c ip a li ti e s . M o r e d e s c r ip ti v e s ta ti s ti c s o n d e c e n tr a li z a ti o n w it h in t h e s u b n a ti o n a l le v e l a n d t r a d e o p e n n e s s b e tw e e n 1 9 8 5 a n d 2 0 0 5 c a n b e f o u n d i n T a b le A 1 o f t h e A p p e n d ix .
U r b a n P u b li c E c o n o m ic s R e v ie w | R e v is ta d e E c o n o m ía P ú b li c a U r b a n a T a b le 3 . D e s c r ip t iv e S t a t is t ic s P r o v in c e s o f A r g e n t in a Y e a r 2 0 0 5 P r o v in c e s Po pu la tio n (in m ill .) Ar ea (m ill k m2 ) Po pu la tio n D en -sit y (h ab /k m2 ) De gre e o f U rb a-niz at io n (in % ) Tr ad e O pe nn es s (in %) Gin i I nd ex Po ve rt y N BI Re la tiv e G DP p c F is c a l D e c e n tr a li z a ti o n ( in % ) F is c a l C o r re s p o n d e n -c e ( in % ) ( s u b n a ti o n a l / to ta l) ( m u n ic ip a l / s u b n a ti o n a l) ( R e v e n u e s / E x p e n d it u r e ) E x p e n d R e v e -n u e E x p e n d R e v e -n u e P r o v in M u n i-c ip S u b n a t ( 1 ) ( 1 ) ( 1 ) ( 1 ) ( 2 ) ( 3 ) ( 3 ) ( 4 ) B u e n o s A ir e s 1 5 .6 0 .3 1 5 0 .8 9 6 .4 2 6 .9 0 .4 3 4 1 3 .0 1 0 5 1 5 .4 2 8 .3 3 2 6 .8 2 3 .9 5 9 .4 5 1 .0 5 7 .2 C a ta m a r c a 0 .4 0 .1 0 3 .6 7 4 .1 4 5 .1 0 .4 6 2 1 8 .4 1 7 1 0 .8 2 0 .2 0 1 6 .3 6 .3 2 8 .3 9 .8 2 5 .3 C h a c o 1 .1 0 .1 0 1 0 .6 7 9 .7 7 .5 0 .4 5 1 2 7 .6 5 2 1 .5 7 0 .3 4 1 5 .2 1 1 .5 2 4 .1 1 7 .5 2 3 .1 C h u b u t 0 .5 0 .2 2 2 .3 8 9 .5 5 9 .2 0 .4 2 1 1 3 .4 2 0 4 1 .4 7 0 .9 2 1 8 .7 1 9 .0 6 6 .4 6 8 .1 6 6 .7 C ó r d o b a 3 .3 0 .1 7 2 0 .0 8 8 .7 3 2 .1 0 .4 3 3 1 1 .1 1 1 3 4 .3 9 1 .7 3 2 7 .1 3 0 .7 3 9 .5 4 7 .2 4 1 .6 C o r r ie n te s 1 .0 0 .0 9 1 1 .3 7 9 .4 5 .0 0 .4 6 5 2 4 .0 5 4 1 .2 3 0 .2 6 1 1 .8 1 4 .6 2 1 .5 2 7 .4 2 2 .2 E n tr e R io s 1 .2 0 .0 8 1 5 .7 8 2 .5 2 3 .5 0 .4 3 2 1 4 .7 7 5 1 .8 3 0 .6 2 1 9 .3 2 4 .3 3 3 .7 4 5 .2 3 5 .9 F o r m o s a 0 .5 0 .0 7 7 .4 7 7 .7 3 .8 0 .4 5 9 2 8 .0 4 5 1 .0 0 0 .1 4 8 .1 7 .1 1 5 .0 1 3 .0 1 4 .8 Ju ju y 0 .7 0 .0 5 1 2 .7 8 5 .0 1 4 .6 0 .4 3 6 2 6 .1 5 7 0 .9 6 0 .2 0 1 5 .6 1 3 .3 2 2 .9 1 9 .1 2 2 .3 L a P a m p a 0 .3 0 .1 4 2 .2 8 1 .3 1 5 .4 0 .4 2 1 9 .2 1 2 9 0 .8 3 0 .4 0 2 1 .1 1 3 .6 5 6 .4 3 3 .1 5 1 .5 L a R io ja 0 .3 0 .0 9 3 .7 8 3 .2 2 2 .6 0 .4 1 8 1 7 .4 6 4 0 .8 3 0 .1 2 1 8 .5 7 .4 1 7 .8 6 .3 1 5 .7 M e n d o z a 1 .7 0 .1 5 1 1 .7 7 9 .3 1 4 .5 0 .4 3 3 1 3 .1 1 1 4 2 .0 6 1 .0 7 1 7 .3 9 .7 6 0 .0 3 0 .9 5 5 .0
77 76 M is io n e s 1 .1 0 .0 3 3 7 .0 7 0 .4 1 8 .2 0 .4 1 8 2 3 .5 5 4 1 .2 6 0 .3 5 1 1 .9 1 3 .7 2 8 .5 3 3 .6 2 9 .1 N e u qu e n 0 .6 0 .0 9 5 .9 8 8 .6 1 9 .0 0 .4 5 4 1 5 .5 2 4 0 2 .0 2 1 .4 8 1 7 .5 1 0 .3 8 3 .9 4 5 .6 7 7 .2 R ío N e g r o 0 .6 0 .2 0 3 .1 8 4 .4 1 8 .0 0 .4 5 1 1 6 .1 1 0 4 1 .1 4 0 .4 9 1 3 .8 1 3 .6 4 5 .7 4 4 .8 4 5 .5 S a lt a 1 .2 0 .1 6 7 .8 8 3 .4 2 9 .8 0 .5 0 5 2 7 .5 6 2 1 .3 5 0 .4 0 1 5 .2 2 0 .9 2 9 .3 4 3 .1 3 1 .4 S a n J u a n 0 .7 0 .0 9 7 .6 8 6 .0 1 9 .4 0 .4 3 8 1 4 .3 5 8 0 .9 2 0 .2 5 1 2 .5 1 0 .1 2 9 .6 2 3 .3 2 8 .8 S a n L u is 0 .4 0 .0 8 5 .6 8 7 .1 2 0 .8 0 .3 9 1 1 3 .0 1 1 6 0 .8 0 0 .2 1 9 .8 1 1 .5 2 7 .3 3 2 .5 2 7 .8 S a n ta C r u z 0 .3 0 .2 4 1 .1 9 6 .1 3 0 .1 0 .4 0 3 1 0 .1 3 5 2 1 .3 7 0 .7 8 1 5 .9 8 .2 6 5 .7 3 1 .0 6 0 .2 S a n ta F e 3 .2 0 .1 3 2 4 .0 8 9 .2 5 5 .3 0 .4 1 3 1 1 .9 1 1 6 3 .9 8 1 .8 2 2 7 .3 2 7 .6 4 8 .1 4 8 .7 4 8 .2 S a n ti a g o d e l E s te r o 0 .9 0 .1 4 6 .4 6 6 .1 6 .7 0 .4 8 4 2 6 .2 4 8 1 .1 2 0 .2 2 1 3 .2 1 0 .0 2 1 .4 1 5 .6 2 0 .6 T ie r r a d e l F u e g o 0 .1 0 .9 9 0 .1 9 7 .1 3 5 .1 0 .4 2 1 1 5 .5 2 7 0 0 .6 0 0 .3 0 2 1 .7 7 .4 6 2 .9 1 8 .1 5 3 .2 T u c u m á n 1 .4 0 .0 2 6 4 .3 7 9 .5 1 8 .7 0 .4 4 6 2 0 .5 5 6 1 .8 5 0 .6 7 1 9 .8 1 1 .6 4 2 .4 2 2 .5 3 8 .5 T o t a l A r g e n ti n a * 4 0 .1 3 .7 5 1 0 .7 8 9 .4 2 1 .3 0 .4 8 8 1 4 .3 1 0 0 4 8 .8 3 2 1 .3 1 2 1 .3 1 9 .8 4 7 .0 4 3 .1 4 6 .2 S o u r c e : ( 1 ) I N D E C ( N a ti o n a l In s ti tu te o f S ta ti s ti c s a n d C e n s u s ) , N a ti o n a l C e n s u s o f P o p u la ti o n a n d H o u s in g 2 0 1 0 . N a ti o n a l G e o g r a p h ic I n s ti tu te ( IG N ) . ( 2 ) N a ti o n a l C e n s u s o f P o p u la ti o n a n d H o u s in g 2 0 0 1 ( IN D E C ) . ( 3 ) E x p o r ts b y p r o v in c ia l o r ig in , IN D E C . ( 4 ) C o n t, P e lu f fo a n d P o r to ( 2 0 0 9 ) , c o r r e s p o n d s t o y e a r 2 0 0 4 . ( 5 ) c a lc u la te d b y t h e r e la ti o n s h ip b e tw e e n t h e v a lu e o f e a c h p r o v in c e a g a in s t t h e n a ti o n a l a v e r a g e , m u lt ip li e d b y 1 0 0 . S o u r c e r e v e n u e s a n d e x p e n d it u r e s : M in is tr y o f E c o n o m y a n d P r o d u c ti o n , S e c r e ta r ia t o f Fi n a n c e , N a ti o n a l B u d g e t O f f ic e ( O N P ) ( 1 9 6 1 -2 0 0 4 s e r ie ) . O w n e s ti m a te s b a s e d o n O N P ( 2 0 0 5 -2 0 0 8 p e r io d ) . * T o ta l p o p u -la ti o n a n d t o ta l tr a d e o p e n n e s s i n c lu d e s C it y o f B u e n o s A ir e s ( 2 .9 m il li o n p e o p le a n d 0 .7 p e r c e n t, r e s p e c ti v e ly ) . S u b n a ti o n a l c o r r e s p o n d s t o p r o v in c e s a n d m u n ic i-p a li ti e s . M o r e d e s c r ip ti v e s ta ti s ti c s o n d e c e n tr a li z a ti o n w it h in t h e s u b n a ti o n a l le v e l a n d t r a d e o p e n n e s s b e tw e e n 1 9 8 5 a n d 2 0 0 5 c a n b e f o u n d i n T a b le A 2 o f t h e A p p e n d ix .
U r b a n P u b li c E c o n o m ic s R e v ie w | R e v is ta d e E c o n o m ía P ú b li c a U r b a n a
Both countries show remarkable regional disparities (Tables 2 and 3). As an example and for the most important variables considered in this paper, in Brazil, subnational fiscal decentralization –measured by munic-ipal expenditures in relation to the total expenditures of the provincial
plus municipal levels of government in each state- varies between 39.6
percent and 13.7 percent for the year 2005; in Argentina, between 27.3
percent and 8.1 percent. For revenues, decentralization varies from 5.2
percent to 22.2 percent for Brazil, and from 6.3 percent to 30.7 percent for Argentina. Openness in 2005 –measured by the state exports in terms of its GDP- varies between 30 percent and around 1 percent in Brazil and between 60 percent and 4 percent in Argentina. This variability, which is also found in other fiscal and non-fiscal variables, leads to the main ques-tion of this paper: if, at the level of each state (Brazil) or province (Argen-tina), economic integration is accompanied by higher or lower subna-tional fiscal decentralization. Identifying this relation, at the level of subnational units, is one of the most novel aspects of this paper.
Methodological approach
This section introduces the methodological approach for estimating the relationship between fiscal decentralization within the subnational level and economic openness. The main question of the paper is if the (local) munic-ipal participation has increased or decreased within the subnational public sector (municipalities plus provinces/states) due to economic openness. In other words, if the vertical structure of the subnational public sector has been modified and, in that case, in which direction, due to economic openness.
The dependent variable is the municipal share of expenditures and
revenues on the total subnational public sector in the state i, in the year
t, that is,
where Em is municipal expenditure by state; Es is the state expenditure;
Rm are municipal own revenues and Rs are own state revenues.
To estimate the relationship between decentralization and economic openness, a linear panel data model with fixed effects for states (provinces) is considered –in order to capture the effects of invariant factors over time but variable among jurisdictions that cannot be observed or quantified. Year fixed effects are also included to get the effects of invariant factors by jurisdictions which vary over time. The equation to estimate is,
79 78
i = states or provinces; t = 1985, ..., 2005
where ci is the non-observed effect which is constant over time, ht is the
temporary intercept for each time period, and uit are the idiosyncratic
errors. States (provinces) and year effects can contribute to reduce
sig-nificant biases.
The interest of this paper is based on the variable referred to as econom-ic integration, measured by an indeconom-icator of trade openness (OPEN). At an aggregate level, openness is measured by the relationship between
exports (X) and imports (M) and the GDP, that is, (X+M)t/GDPt. At the
state or provincial level, there is only information on exports, so that it
is used Xit/GDPit.13
Control variables are those that the theory of fiscal federalism identi-fies as determinants of decentralization: population (POP), income (GDP), urbanization (URB), income inequality (GINI) and fiscal cor-respondence at the state/provincial level (FCORR = provincial own resourc-es/provincial public expenditures). When studying decentralization at the subnational level, the variable FCORR is important since it is expect-ed that if fiscal correspondence at the provincial level is high, it will also be high the degree of decentralization since the province would transfer expenditures and the corresponding funds to municipalities to finance them. If fiscal correspondence is low, the incentive to transfer expenditures –which generates political benefits- will be low because there are no political costs for the financing.
Estimates
Based on the methodology proposed, in this section the relationship between fiscal decentralization (of expenditures and revenues) of the subnational level and economic openness is estimated, taking into account a panel data for Brazilian states and Argentinian provinces for the period 1985-2005.
13 The openness is measured by the relationship between exports and the GDP of each state or province. There is no reliable data on imports at the subnational level. The available data on imports at the state or provincial level refers to imports according to the importer's fiscal residence or entry port.
U r b a n P u b li c E c o n o m ic s R e v ie w | R e v is ta d e E c o n o m ía P ú b li c a U r b a n a
The basic estimate is made using a fixed effect model per state (province) and per year. An alternative specification considers year fixed effects and
regional dummies,14 and it shows more satisfactory results in terms of
indi-vidual significance of the variables. The F test of joint significance on the regional and temporary dummies indicates the need to include them. The presence of heteroscedasticity and autocorrelation of first order in
idiosyn-cratic errors,15 reported by the modified Wald test for heteroscedasticity (Greene,
2000) and Wooldridge test for autocorrelation (Wooldridge, 2002) reveal the
need to use the method of Panel Corrected Standard Errors (PCSE).16
A sequence of estimates was performed with OPEN -the variable which
represents economic openness in each subnational unit- as the only inde-pendent variable. The result is that relations are positive and statistically significant for Brazil and they are only positive and significant for
expen-ditures in Argentina.17 Then population, GDP per capita, urbanization,
fiscal correspondence and the Gini coefficient were added as controls. This last variable has a large amount of missing data in the panel
corre-14 For Brazil, the regions are West-Central (Mato Grosso do Sul, Mato Grosso and Goiás), Northeast (Maranhao, Piauí, Ceará, Rio Grande do Norte, Paraiba, Pernambuco, Alagoas, Sergipe and Bahía), North (Rondonia, Acre, Amazonas, Roraima, Pará, Ama-pá and Tocantins), Southeast (Minas Gerais, Espírito Santo, Río de Janeiro and Sao Paulo) and South (Paraná, Santa Catarina and Río Grande do Sul). In Argentina, regions correspond to Greater Buenos Aires (Buenos Aires), Northwest (Catamarca, Jujuy, La Rioja, Salta, Santiago del Estero and Tucumán), Northeast (Corrientes, Formosa, Misiones and Chaco), Cuyo (Mendoza, San Juan and San Luis), Pampa (Córdoba, La Pampa, Santa Fe and Entre Ríos) and Patagonia (Chubut, Neuquén, Río Negro, Santa Cruz and Tierra del Fuego).
15 In this paper, idiosyncratic errors are not considered to be independent from time. For example, the level of expenditures or revenues in (t) is probably associated with the level in (t – 1).
16 With this method, the parameters of the ordinary least squares model allowing consistent standard errors can be estimated when the idiosyncratic errors of each observation are not independent. Specifically, the aim is standard errors to be robust to the fact that each state or province has different variances in the error, and to the fact that each subnational observation is correlated with the observations of other states or provinces at different points in time. Beck and Katz (1995) show that the standard errors of this method are more accurate than those of the least squares generalized feasible model. 17 These estimates are not included in the paper but they are available upon request to
81 80
sponding to Argentina, mainly in the early years, which substantially affects the results. For this reason, estimates are presented either includ-ing or excludinclud-ing the Gini coefficient (Tables 4 and 5).
In the model with year fixed effects and regional dummies (model 2, shaded columns in tables), which is the preferred specification, the OPEN variable is positive and significant in Brazil for revenues but not for expen-ditures. For Argentina, the coefficients are not significantly different from zero for expenditures and revenues, which means that decentralization of fiscal variables is not modified when more open provinces are consid-ered. One possible explanation for this lack of relationship is that the factors which work in opposite directions compensate their effects. Anoth-er explanation is that intAnoth-erfAnoth-erences from highAnoth-er levels of govAnoth-ernment prevent modifications in the structure of the subnational public sector. The difference in the sign of the coefficients for revenue between the two countries may be explained by the broader tax bases of the intermediate level of government in Brazil. In fact Brazil finances more of its expendi-tures with its own revenues than Argentina.
The signs of the control variables vary between the two countries.18
Population is the only variable with the same sign, which is positive and significant, both for revenues and expenditures in the two countries.
The sign is compatible with the theory of fiscal federalism: a large size of
the states/provinces –population– implies decentralized expenditure to avoid congestion costs.
GDP per capita has a positive and significant sign both for revenues and expenditures in Argentina, but it is only positive and significant for
expenditures in Brazil. The positive sign is expected from the theory of
fiscal federalism because a higher GDP per capita permits to deal with higher administrative and decision-making costs of decentralized govern-ments. It also permits to deal with the costs of tax administration and management of public expenditure.19
Urbanization, in general, is not a significant variable.20 The result
could be explained if the effects that act in different directions compensate
18 In the model with year and state fixed effects (model 1) several variables modify the sign and the significance, thus requiring precaution in the interpretation of the results.
19 For revenue decentralization for Brazil, GDPpc is significant but with a negative sign. 20 It has a positive effect for revenues in Brazil and for expenditures in Argentina (only
U r b a n P u b li c E c o n o m ic s R e v ie w | R e v is ta d e E c o n o m ía P ú b li c a U r b a n a T a b le 4 . E s t im a t e o f r e v e n u e d e c e n t r a li z a t io n B r a z il a n d A r g e n t in a 1 9 8 5 -2 0 0 5 B r a z il A r g e n ti n a ( 1 ) ( 2 ) ( 1 ) ( 2 ) O P E N 0 .2 9 9 0 * * * 0 .3 1 8 5 * * * 0 .0 8 8 7 * * * 0 .0 9 4 9 * * * -0 .0 1 9 8 -0 .1 3 9 1 * * 0 .0 4 0 1 -0 .0 2 5 2 ( e x p o r ts / G D P ) [ 0 .0 0 0 ] [ 0 .0 0 0 ] [ 0 .0 0 2 ] [ 0 .0 0 2 ] [ 0 .5 9 5 ] [ 0 .0 3 2 ] [ 0 .1 8 9 ] [ 0 .6 1 4 ] P O P ( in l o g s ) -0 .1 4 1 8 * * * -0 .1 6 0 8 * * * 0 .0 1 8 1 * * * 0 .0 1 7 5 * * * -0 .0 2 6 6 -0 .0 1 7 5 0 .0 7 2 7 * * * 0 .0 8 0 8 * * * ( p o p u la ti o n ) [ 0 .0 0 0 ] [ 0 .0 0 0 ] [ 0 .0 0 0 ] [ 0 .0 0 0 ] [ 0 .5 2 0 ] [ 0 .7 9 1 ] [ 0 .0 0 0 ] [ 0 .0 0 0 ] U R B -0 .3 2 1 0 * * * -0 .3 0 9 0 * * * 0 .0 9 8 4 * * * 0 .1 2 1 5 * * * -0 .3 7 0 4 * * * -0 .2 9 1 8 * 0 .0 1 3 5 0 .0 0 5 9 ( u r b a n iz a ti o n ) [ 0 .0 0 0 ] [ 0 .0 0 0 ] [ 0 .0 1 0 ] [ 0 .0 0 3 ] [ 0 .0 0 0 ] [ 0 .0 6 9 ] [ 0 .7 6 5 ] [ 0 .9 1 7 ] F CO R R -0 .1 1 7 1 * * * -0 .1 1 6 2 * * * -0 .1 3 5 2 * * * -0 .1 3 1 6 * * * -0 .4 3 7 3 * * * -0 .3 4 0 7 * * * -0 .4 2 8 9 * * * -0 .4 2 9 3 * * * ( fi s c a l c o r r e s p .) [ 0 .0 0 0 ] [ 0 .0 0 0 ] [ 0 .0 0 0 ] [ 0 .0 0 0 ] [ 0 .0 0 0 ] [ 0 .0 0 0 ] [ 0 .0 0 0 ] [ 0 .0 0 0 ] G D P p c ( in l o g s ) -0 .0 2 3 7 * * -0 .0 2 3 6 * * 0 .0 3 0 2 * * * 0 .0 2 1 4 * * -0 .0 0 4 7 0 .0 1 7 7 * 0 .0 7 6 9 * * * 0 .0 6 6 9 * * * ( p e r c a p it a g d p ) [ 0 .0 3 0 ] [ 0 .0 3 8 ] [ 0 .0 0 1 ] [ 0 .0 2 0 ] [ 0 .7 7 5 ] [ 0 .0 7 8 ] [ 0 .0 0 0 ] [ 0 .0 0 0 ] G IN I -0 .0 0 3 8 -0 .2 2 1 7 * * * 0 .1 4 8 6 0 .1 6 0 5 * ( g in i in d e x ) [ 0 .9 5 3 ] [ 0 .0 0 0 ] [ 0 .3 0 9 ] [ 0 .0 6 9 ] C o n s t a n t 2 .2 4 1 5 * * * 2 .4 8 6 7 * * * -0 .3 6 3 6 * * * -0 .1 8 8 2 * * 1 .3 1 3 3 * * 0 .8 6 9 2 -1 .3 0 2 3 * * * -1 .3 8 8 2 * * * [ 0 .0 0 0 ] [ 0 .0 0 0 ] [ 0 .0 0 0 ] [ 0 .0 1 2 ] [ 0 .0 4 1 ] [ 0 .4 1 7 ] [ 0 .0 0 0 ] [ 0 .0 0 0 ] O b s . ( s t a t e s ) 5 3 3 ( 2 6 ) 4 5 7 ( 2 6 ) 5 3 3 ( 2 6 ) 4 5 7 ( 2 6 ) 4 8 3 ( 2 3 ) 2 7 4 ( 2 3 ) 4 8 3 ( 2 3 ) 2 7 4 ( 2 3 ) p -v a l H e t. 0 .0 0 0 0 0 .0 0 0 0 0 .0 0 0 0 0 .0 0 0 0 0 .0 0 0 0 0 .0 0 0 0 0 .0 0 0 0 0 .0 0 0 0 p -v a l A C 0 .0 1 5 3 0 .0 1 0 8 0 .0 1 5 3 0 .0 1 0 8 0 .0 0 0 0 0 .0 0 0 0 0 .0 0 0 0 0 .0 0 0 0 F t e s t s ta te s 0 .0 0 0 3 0 .0 0 1 9 0 .0 0 0 3 0 .0 0 1 9 0 .0 0 0 0 0 .0 0 0 0 0 .0 0 0 0 0 .0 0 0 0 F t e s t y e a r s 0 .0 0 0 0 0 .0 0 0 0 0 .0 0 0 0 0 .0 0 0 0 0 .0 0 0 0 0 .0 0 0 0 0 .0 0 0 0 0 .0 0 0 0 N o te s : O L S e s ti m a te w it h P a n e l C o r r e c te d S ta n d a r d E r r o r s ( x tp c s e i n S ta ta 1 1 .1 ) . ( 1 ) S ta te a n d ye a r f ix e d e f fe c ts ; ( 2 ) ye a r f ix e d e f fe c ts a n d r e g io n a l d u m m ie s . p -v a lu e i n b r a c k e ts * s ig n if ic a n t a t 1 0 p e r c e n t; * * s ig n if ic a n t a t 5 p e r c e n t; * * * s ig n if ic a n t a t 1 p e r c e n t.
83 82 T a b le 5 . E s t im a t e o f e x p e n d it u r e d e c e n t r a li z a t io n . B r a z il a n d A r g e n t in a , 19 8 5 -2 0 0 5 B r a z il A r g e n ti n a ( 1 ) ( 2 ) ( 1 ) ( 2 ) O P E N 0 .0 0 2 3 0 .0 1 2 8 0 .0 3 6 9 0 .0 3 9 -0 .0 5 4 5 * -0 .0 2 8 5 * 0 .0 3 1 5 -0 .0 2 4 2 ( e x p o r ts / G D P ) [ 0 .9 6 3 ] [ 0 .8 0 6 ] [ 0 .2 1 8 ] [ 0 .2 4 4 ] [ 0 .0 5 5 ] [ 0 .0 8 1 ] [ 0 .2 8 2 ] [ 0 .4 6 2 ] P O P ( in l o g s ) -0 .0 1 1 7 -0 .0 2 6 7 0 .0 2 0 9 * * * 0 .0 1 9 0 * * * 0 .0 1 0 7 -0 .0 4 6 2 0 .0 1 9 4 * * * 0 .0 2 8 5 * * * ( p o p u la ti o n ) [ 0 .7 2 5 ] [ 0 .4 4 2 ] [ 0 .0 0 0 ] [ 0 .0 0 0 ] [ 0 .6 8 7 ] [ 0 .1 2 8 ] [ 0 .0 0 0 ] [ 0 .0 0 0 ] U R B 0 .0 2 4 6 0 .0 6 7 4 -0 .0 7 3 4 * -0 .0 5 8 5 -0 .3 0 5 6 * * * 0 .0 5 5 7 0 .0 6 0 1 0 .1 4 8 9 * * * ( u r b a n iz a ti o n ) [ 0 .7 7 3 ] [ 0 .4 6 5 ] [ 0 .0 5 7 ] [ 0 .1 4 3 ] [ 0 .0 0 0 ] [ 0 .3 5 4 ] [ 0 .1 4 7 ] [ 0 .0 0 0 ] F CO R R 0 .0 7 2 8 * * * 0 .0 6 8 9 * * * 0 .1 0 0 6 * * * 0 .0 9 8 0 * * * 0 .0 3 0 2 * * 0 .0 3 1 7 * * -0 .0 2 8 -0 .0 3 9 7 ( fi s c a l c o r r e s p .) [ 0 .0 0 0 ] [ 0 .0 0 1 ] [ 0 .0 0 0 ] [ 0 .0 0 0 ] [ 0 .0 4 0 ] [ 0 .0 1 5 ] [ 0 .1 1 8 ] [ 0 .1 7 9 ] G D P p c ( in l o g s ) -0 .0 2 6 3 * -0 .0 2 8 1 * -0 .0 4 0 7 * * * -0 .0 3 7 5 * * * -0 .0 4 6 5 * * * -0 .0 0 9 6 0 .0 2 9 8 * * 0 .0 4 9 8 * * * ( p e r c a p it a g d p ) [ 0 .0 5 7 ] [ 0 .0 5 7 ] [ 0 .0 0 0 ] [ 0 .0 0 3 ] [ 0 .0 0 2 ] [ 0 .3 4 7 ] [ 0 .0 1 9 ] [ 0 .0 0 2 ] G IN I 0 .0 2 3 4 0 .0 4 7 2 -0 .0 6 4 7 -0 .0 5 6 1 ( g in i in d e x ) [ 0 .7 7 0 ] [ 0 .5 4 2 ] [ 0 .3 1 0 ] [ 0 .3 9 3 ] C o n s t a n t 0 .3 8 7 2 0 .5 6 6 5 0 .1 1 9 1 0 .0 9 5 1 0 .7 0 2 3 1 .0 7 6 4 * -0 .3 5 2 1 * * -0 .6 7 1 5 * * * [ 0 .4 0 2 ] [ 0 .2 3 5 ] [ 0 .1 5 0 ] [ 0 .3 6 8 ] [ 0 .1 9 6 ] [ 0 .0 8 0 ] [ 0 .0 1 0 ] [ 0 .0 0 0 ] O b s . ( s t a t e s ) 5 3 1 ( 2 6 ) 4 5 5 ( 2 6 ) 5 3 1 ( 2 6 ) 4 5 5 ( 2 6 ) 4 8 3 ( 2 3 ) 2 7 4 ( 2 3 ) 4 8 3 ( 2 3 ) 2 7 4 ( 2 3 ) p -v a l H e t 0 .0 0 0 0 0 .0 0 0 0 0 .0 0 0 0 0 .0 0 0 0 0 .0 0 0 0 0 .0 0 0 0 0 .0 0 0 0 0 .0 0 0 0 p -v a l A C 0 .0 0 0 0 0 .0 0 0 6 0 .0 0 0 0 0 .0 0 0 6 0 .0 0 0 0 0 .0 0 0 1 0 .0 0 0 0 0 .0 0 0 1 F t e s t s ta te s 0 .0 0 0 0 0 .0 0 0 0 0 .0 0 0 0 0 .0 0 0 0 0 .0 0 0 0 0 .0 0 0 0 0 .0 0 0 0 0 .0 0 0 0 F t e s t y e a r s 0 .0 0 0 0 0 .0 0 0 0 0 .0 0 0 0 0 .0 0 0 0 0 .0 4 5 9 0 .1 3 6 6 0 .0 4 5 9 0 .1 3 6 6 N o te s : O L S e s ti m a te w it h P a n e l C o r r e c te d S ta n d a r d E r r o r s ( x tp c s e i n S ta ta 1 1 .1 ) . ( 1 ) S ta te a n d ye a r f ix e d e f fe c ts ; ( 2 ) ye a r f ix e d e f fe c ts a n d r e g io n a l d u m m ie s . p -v a lu e i n b r a c k e ts * s ig n if ic a n t a t 1 0 p e r c e n t; * * s ig n if ic a n t a t 5 p e r c e n t; * * * s ig n if ic a n t a t 1 p e r c e n t.
U r b a n P u b li c E c o n o m ic s R e v ie w | R e v is ta d e E c o n o m ía P ú b li c a U r b a n a
each other. According to the theory of fiscal federalism, many functions –that with a scattered population provides the central government (nation-al, provincial)- could pass into the hands of subnational governments (provincial, municipal) when population concentrate in urban areas (zoo, policeman, and so on). In the same way, certain services of urban areas could arise (such us, transit police, traffic lights, urban control, etc.). In contrast, increased urbanization can generate strong interjurisdictional externalities that favor centralization.
Income inequality (GINI) becomes only statistically significant in the case of revenues, being negative in Brazil and positive in Argentina but only at 10 percent. The expected sign of the Gini coefficient is negative: greater inequality means more centralization to avoid migration and incompatible policies between different levels of government.
Fiscal correspondence (FCORR) measures the relationship between own revenues and expenditures at the state/provincial level. In Brazil, states with higher fiscal correspondence have higher expenditure decen-tralization. The government transfers expenditures to the municipalities. This reduces the political benefit of the expenditures but also diminishes the political cost because it allows tax reductions. For Argentina, the coef-ficient for expenditures is not significant. In both countries the sign of fiscal correspondence is negative and significant for revenues. In Brazil there is an asymmetry response of revenues and expenditures, which is a signal of potential conflicts between jurisdictions and a issue of concern for local governments. To increase their fiscal correspondence, the state governments implement policies that increase the relative share of the municipalities in expenditures and reduce it in revenues. The ways of adjustment at the municipal level will be higher transfers or deterioration in the quality of the services and/or debt. For Argentina, the coefficient of fiscal correspondence is negative for revenues. In this case, if provincial governments are in a fiscal stress situation and, as a consequence, increase the fiscal correspondence, this will have a negative impact over the share of municipalities in subnational revenues –maintaining the expenditure
share relatively constant.21
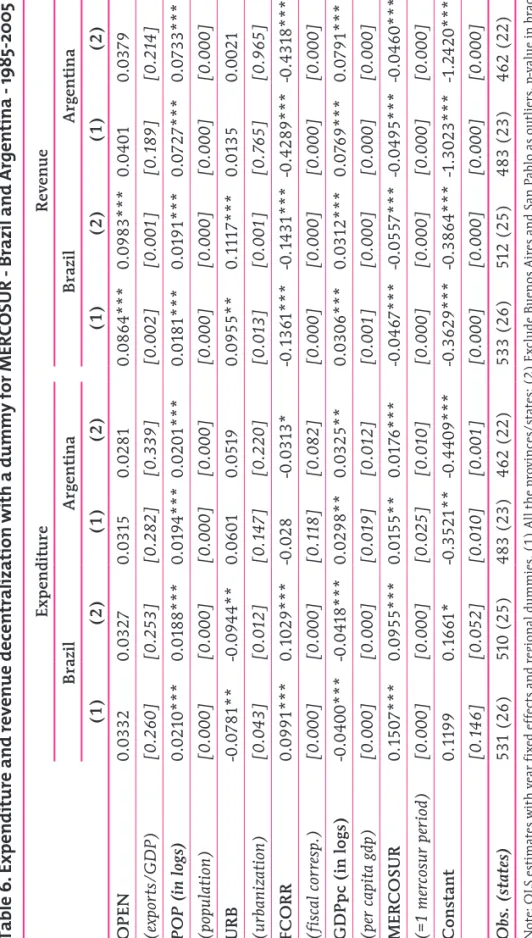
To check the robustness of the results, the model is estimated with year fixed effects and regional dummies (model 2), including a dummy for
21 For comparative purposes, the same sequence of estimates as in tables 4 and 5 was carried for the pooled model with and without fixed effects for years. The results are similar to previous ones; they are available from the authors.

![Table 5. Estimate of expenditure decentralization. Brazil and Argentina, 1985-2005 BrazilArgentina (1)(2)(1)(2) OPEN0.00230.01280.03690.039-0.0545*-0.0285*0.0315-0.0242 (exports/GDP)[0.963][0.806][0.218][0.244][0.055][0.081][0.282][0.462] POP (in logs)-0.0](https://thumb-us.123doks.com/thumbv2/123dok_us/68112.2507848/22.739.63.623.80.1024/table-estimate-expenditure-decentralization-brazil-argentina-brazilargentina-exports.webp)