Welcome Remarks
International conferences provide an excellent opportunity to bring together academics from different countries and background for the purpose of presenting their research result, critically discussing methodology and finding and improving the quality of research and the impact of the research on society and science. Furthermore, conferences enable the scientific community to create new networks, to foster relationships and extend their visibility.
Airlangga International Conference on Economics and Business (AICEB) 2018 is an annual conference Hosted by Faculty of Economics and Business, Universitas Airlangga, in Collaboration with Association for Faculties of Economics and Business – Indonesia (AFEBI). The theme of AICEB 2018 is Disruption Era : How Should Business and Government Response?
I expect this conference raises an important things in the discussion room and proceeding. The theories use in this conference should be problem driven-that is addressing a problem of direct, indirect, or long-linked relevance to practice, rather than narrowly addressing the (theoretical) issues. Hence, the research and discussion in this conference could provide a useful insight for practitioners, while at the same time contribute to the development of the field of economics and business.
I’m looking forward to seeing you in AICEB in the near future With warmest regards
Dr. Rudi Purwono
Foreword
Assalamualaikum Warahmatullahi WabarokatuhPraise be to God for the Almighty who for His grace, the preparation for organizing the 1st AICEB can run well. It is a big work for us at the Faculty of Economics and Business Airlangga University to held this International conference.
Welcome to all conference participants at the Faculty of Economics and Business, Airlangga University. In accordance with the theme of the 1st AICEB: " Disruption Era : How Should Business and Government Response? ", it is expected that this conference can produce many contribution to the development of research in the area of economics and business, especially in topic that is related to the disruption issues.
My highest appreciation to all committee who have worked hard to prepare this agenda well. Hopefully the 1st AICEB can run smoothly and can be a means to be able to answer the future challenges faced by the Field of Economics and Business.
Surabaya, October 2018 Dean of FEB UNAIR,
Prof. Dr. Hj. Dian Agustia, SE., M.Si.,Ak
Table of Content
Welcome Remarks ... i Foreword... ii Table of Content ...iii ECONOMICS
Factors Determining Energy Consumption In Malaysia: An Aggregate And Disaggregate Analysis ... 1
Impact Of Exchange Rate Volatility To Stocks Return In Indonesia: The Augmented Markov-Switching Egarch Approach ... 2
Trade Liberalization And Comparative Advantage, Evidence From Indonesia And Trade Partners ... 3
Evidence Of Reindustrialization Or Deindustrialization On The National Manufacturing Corridor In Indonesia ... 4
The Impact of Per Capita Income, Contraceptive Prevalence Rate, And Women’s Education Rate Toward Fertility Rate In Indonesia ... 5
Institutional Capital and the Performance of Corn Marketing Channel at Smallholder Dryland Farming ... 6
Economic Distance and Spatial Pattern in Productivity Spillover on Manufacturing Industry : Case in Indonesia ... 7
Fiscal Degree Performance In Samarinda City (Budget Year Of 2013-2017) 8
Effectiveness and Efficiency of Poverty Eradication in Indonesia ... 9
The Influance Money Supply, Inflation And Transaction Volume On Consumer Goods Index Priode Januari 2014 – Juli 2018 ... 10 Measurement of Exchange Rate Risk with VaR to Minimize Forex Trading Losses in Bank Sumsel Babel Period 2016/2017 ... 11
Human Capital And Productivity: A Case Study Of East Java Province, Indonesia... 12 Carbon Dioxide (Co2) Emissions, Energy Consumption, And Output In Indonesia... 13 Macroprudential And Monetary Policy, Trade Off or Complementary Policies... 14 Efficiency Of Banking Profits In Indonesia ... 15 Health Benefit Of Reducing Air Pollution In Indonesia: Tunneling Through The Environmental Kuznets Curve ... 16 Composite Leading Index of Residential Property Price Cycle in
Indonesia... 17 Intra-Industry Trade Of Automotive Industries: Case For Indonesia And Its Trading Partners ... 18 The Impact of Global Economic Volatility on Indonesia’s Financial Market and Economy ... 19 The Impact Analysis of Asean Movement Of Natural Person in Asean-5 Countries Skilled Workers Mobility to Indonesia ... 20 Impacts Of Exchange Rate Volatility, India’s Gdp, Bilateral Real Exchange Rate, And Financial Crises On The Export Crude Palm Oil (Cpo) Indonesia To India ... 21 Efficiency of Micro Entreprises in Using Banking Capital for Poverty Alleviation ... 22 Analysis of Economic Growth and Poverty Level With Simultaneous Dynamic Panel Data Method : Empirical Findings in North Sulawesi Province ... 23 Globalization In Automotive Industry: Can Indonesia Catch-Up With Thailand? ... 24 Java-Bali Electricity Distribution Effeciency Year 2005-2014 ... 25
The Effect of Subsidy Reformation of Fuel Oil to the Economic Sector in Indonesia... 26 Analysis of Tourism Economic in East Java 2010 : Input - Output Model .27 Analysis of Relationship Between Residential Property Price and Bank Credit In 14 Provinces in Indonesia Using Panel VAR Approach ... 28 Does Financial Conglomeration Increase Bank Stabilization? Evidence for Indonesian Banking ... 29 Asymetric Effect Of Exchange Rate Volatility On Export: Evidence From Indonesia-United States And Indonesia-South Korea Trade At The Industry Level ... 30 Analysis Of Provincial Welfare Comparation: Case Studies in West Java, Central Java and East Java use the Income Per Capita and Inflation Variation Approach ... 31 Analysis Of Determinants On Bank’s Productivity And Efficiency In Indonesia Within 2012-2016 (Empirical Study Of Conventional Bank Books 3&4) ... 32 Do Economic Factors Determine Corruption Exist ? (Case Study Cities In Indonesia) ... 33 Export Performance Of Indonesia Creative Industry Towards 10 Countries Of Largest Creative Industry Export Destination ... 34 Sheltered Workshop Model on Social Protection and Empowerment of Persons with Disabilities to Prepare Competitive Human Resources in the Era of the ASEAN Economic Community ... 35 The Strategy Of Social Engineering Of Entrepreneurial Behavior Of Indonesian Migrant Workers During The Placement Period (A Case Study In Hong Kong) ... 36 The Effect Of Return Migration on Household Education Expenditure: The Case of Indonesia ... 37
Do Wealthier Countries Life Longer? Evidence from Asia ... 38 The Impact Of Fossil And Renewable Energy For The Economy Growth In Indonesia... 39 Analysis Of Leading Sector With Dynamic Location Quotient Method In Lubuklinggau City, South Sumatera, Indonesia ... 40 BUSINESS MANAGEMENT
The Influence Of Dividend Changes On Future Earnings Changes... 41 Capital Budgeting for Plant Relocation of PT. X ... 42 The Influence of of Board Structure and Ownership Structure Toward Underpricing of IPO Firms in Indonesia ... 43 Board Diversity and Dividend Payout Ratio : Evidence from Family Firms in Indonesia ... 44 Cost and Benefit Analysis of Banking Financial Supply Chain Management (FSCM) Digital Platform Development ... 45 Ownership Concentration and Earning Quality : Moderating Role of Board Diversity ... 46 Reaction Of Cigarette Stock Market Companies The Announcement Of Changes In Retail Sell Prices And Excise Of Tobacco Products ... 47 Capital Strategic Architecture to Optimize BPD’s Role (Case Study of Bank Sumsel Babel) ... 48 Family Ownership in Indonesia, Good or Bad? ... 49 Profitability Mediation On The Relationship Of Activity Ratio And Firm Value: A Empirical Study On Consumer Goods Sub-Sector Firms Listed On Indonesia Stock Exchange In 2013-2017 ... 50 Analysis Of CR4 And Herfindahl-Hirschman Index In Indonesian Banking Industry ... 51
Benefit-Risk Framework Toward Lender Intention to Continue Invest on
Peer to Peer Lending Platform in Indonesia... 52
Comparative Analysis of Islamic Stocks Performance in Indonesia, Malaysia, Bahrain and The United Arab Emirates ... 53
Reducing Adverse Selection Problem of Financing through Convertible Ijarah Contract ... 54
Analysis Of Backward Integration Strategy In The Construction Company Case Study at PT Waskita Karya (Persero) Tbk. ... 55
Are Women Better? Board Gender Diversity and Dividend Policy... 56
Stock Split Influence on Investor Attention in Indonesia ... 57
Female Board Directorship and Firm Performance ... 58
The PROPER Award, CSR Performance, and Market Performance In The Indonesia Stock Market: Does Environmental Award Create Value? ... 59
Corporate Social Responsibility and Firm Value: Moderating Role of Profitability: Evidence from Indonesia ... 60
The Effect Of Gender, Working Capital, Employee, Fixed Asset, And Obstacle To Access Finance On Small Business Performance (Study On The Food Industry Sector Recorded In The Office Of Industry, Trade, Cooperatives And Umkm Of Kendari City In 2017) ... 61
The efficiency of Sharia Rural Banks and Sharia Commercial Banks: A Comparison using Data Envelopment Analysis. ... 62
Mediation Role Of Perceived Internal Employability And Perceived External Employability, Self Efficacy And Empowerment Moderation Towards Employee Development Relationship To Turnover Intention ... 63
Toward Sustainable Development Through CSR Program of PT. Holcim Indonesia Tbk at Tuban Plant ... 64
The Impact of Work Related Dimensions toward Career Commitment: Job Stress as Mediation Variable in Teller and Customer Service ... 65
The Relationship of Vision Mission Statement with Organizational Performance and Corporate Image on Indonesia's Most Admired Company- Bank Category ... 66 The Effect of Authentic Leadership as Boundary Spanner on Role Conflict, Role Ambiguity and Task Performance in Branch Manager Bank ... 67 A Multidimentional Approach to Perceived Insider Status and the
Relationship with Organizational Citizenship Behavior ... 68 Analysis Of Employee Participation, Industrial Relations Climate, And Organizational Commitment... 69 Performance Appraisal Design On Mail, Package, e-commerce, and Logistics Departement Case Study at Pos Indonesia – East Java Region ... 70 Making Sense of Urban Tribe: The Motivational Factors of Motorcycle Club Membership ... 71 Self Control, Perceived Opportunity, Knowledge and Attitude as Predictors of Plagiarism by University Students ... 72 The Important Role Of Workplace Fun On Employee Voice Behavior In Industrial Sector ... 73 Key Indicators Influencing Team Effectiveness in Project Based Team .... 74 Intention to Integrate Environmental Ethics in Academic Activities in Higher Education Institutions in Indonesia ... 75 Influence of Individual Characteristic and Positive Work Environment on Employee Performance Mediated by Work Engagement of Employees of PT. Patria Job Site in Tanjung City ... 76 Change Leadership and Javanese Culture of Indonesia ... 77 Psychological Empowerment as the mediator between Individual Readiness for Change and Organizational Readiness for Change ... 78 Organizational Culture Types and Knowledge Sharing : Conceptual Approach ... 79
Performance Appraisal Analysis Of Employees In Tanggetada District Office, Kolaka Regency Southeast Sulawesi Province... 80 The Effect of Emotional Intelligent and Work Discipline on Performance In Regional Hospital Muna District ... 81 Leadership In Organizational Resilience: A Literature Review ... 82 Comparison Of Consumption Attitude Across Different Social Classes Of Indonesian Consumers ... 83 Ethical Behavior and Customer Satisfaction toward Home Improvement Service Providers ... 84 Business Strategy Formulation to Increase Profit and Market Share in Non- Tourism Hotel Industry (Case Study: Permata Land)... 85 Utilization of Social Media to Improve Palm Sugar SME Performance in Indonesia... 86 Antecedents Repurchase Intention on Sport Fashion Product ... 87 Perceived Quality, Customer Satisfaction, Switching Barrier and Customer Loyalty in Business to Business Context ... 88 The Service Quality Perception Of Patient Effect To Loyalty Through Patient Satisfaction As Intervening Variables In Pucang Sewu Community Health Center Surabaya ... 89 Antecedents Purchase Intention Towards Halal Cosmetic Products ... 90 Perceptual Analysis Of Toyota Yaris City Car At Airlangga University Students: A Case Study Of City Car Vehicle Competition In Surabaya. ... 91 French Attitude Towards Travel Bloggers’ Instagram Posts: A Study on Image Types and Their Engagement Among French Audience ... 92 Necromancy Marketing: Reviving Local Wisdom as The Cornerstone of Indonesian Tourism ... 93 Comparative Advertising The Effect of Comparative Advertising towards the Brand Attitude and Brand Image of Luxury Cars ... 94
Commercialization of Tourism Base Small and Medium Enterprises (SMEs) Case study in Indonesia ... 95 Millenial Muslim Preference: Status or Culture? ... 96 Analysis of Customer Behavior Intention Towards Airbnb and Low Budget Hotel ... 97 The Influence of Sales Promotion on Online Impulse Buying among Indonesian Online Shoppers: The Moderating Role of Mindfulness ... 98 Influence Of Technology Acceptance Model On Student’s Attitudes Toward Online Shopping ... 99 Analyzing The Performance Gap Issue of Franchise System of PT Zahara Namora Wisata ... 101 Proposed Operational System for Efficiencies and Optimizing by Conduct A New Standard Operating Procedure (SOP). Case Study: PT. Amiga Jaya Makmur ... 102 Determinant Factors of Competitive Strategy and Their Impact to Company Performance of Cable Industry in Indonesia ... 103 The Analysis of Efficiency of Fish Auction Places in Banten Province ... 104 Lean Thinking for Transportation Performance Improvement in
Pharmaceutical Industry... 105 Application of Inventory Control to Increase Sales Volume in ProQ Workshop as SMEs in Indonesia ... 106 Evaluation on Domestic LNG Business for New Oil and Gas State-Owned Holding Company ... 107 Using Digital Technology To Optimize Capacity Utilization Rate For Cost Efficiency Of Ships Operational Of Tugboats In Digital Era... 108 Sustainable Development For Achieving A World Class University ... 109 Integrated Farming System for Eco-Tourism In Banyuwangi ... 110
Value Enhancement Process on Indonesian SME through Product Formula Development, Product Durability Enhancement, and Product Label Design 111
Reassessment of the Entrepreneurship Orientation and Marketing Performance: The Emerging of Market Sensing Capability in Disruption Era ... 112 Collaboratory in Tourism Sector: Increasing Tourism by Maximize The Role of Stakeholders in Tourism to Develop Sharing Economy... 113 Action Plan of Micro Business Development in Siak Regency ... 114 Analysis of Balanced Scorecard Implementation at State University as a Tool to achieve Institutional Goals, Vision, and Mission... 115 E-Commerce Adoption In Improving Quality And Business Innovation Model With Market-Place... 116 Personality and Entrepreneurial Motives of Islamic College Students: Environmental Support as Mediator ... 117 ACCOUNTING
Huma Betang Cultural Influence In Budgetary Participation ... 118 The Effect of Family Ownership and Political Connection on Audit Fee and Audit Risk ... 119 The Effect of Temporary Book-Tax Differences on Future Earnings Changes: The Moderating Role of Earnings Management... 120 Analysis of Determinant of Sustainability Practice Based on Sustainable Development Goals’ Target ... 121 The Effect of Political Connections and Agency Costs on Investment Efficiency Empirical Evidence from Indonesia ... 122 The Influence Of Firms Business Strategy On Tax Avoidance With Tax Risk As Moderating Variable ... 123
Implementation of Customer Profitability Analysis in Providing
Conventional Loan Facilities of Bank Sumsel Babel ... 124 Voluntary Ethics Disclosure and The Role Of Audit Committee
Characteristics ... 125 Intellectual Capital Determinants Disclosure In Service Sectors In Indonesia 126
Analysis On Examination Of Intangible Property And Intragroup Services In Tax Audit (Case Study At Foreign Invesment Tax Office Two) ... 127 The Effect of Corporate Social Responsibility and Corporate Financial Performance Disclosure on Firm Value with Family Ownership as
Moderation Variables ... 128 Menu Profitability Analysis Using Time - Driven Activity Based Costing Method: A Case Study on Excelso Panglima Sudirman Surabaya ... 129 The Influence Of Knowledge Competence, The Adequacy of Information And The Application Of Government Accounting Standards To The Utilization of Financial Statements In Decision Making A Study on The Work Unit Blu (Public Service Agency) Office Area of East Java Province Treasury ... 130 The Effect of Diversity on Board of Directors on Earnings Management with Audit Committee as the Moderating Variable ... 131 The Effect of Directors’ Diversity on Corporate Internal Control
Effectiveness ... 132 The Effect of Effectiveness of Board of Commissioner and Audit
Committee on Likelihood of Fraud ... 133 Analysis of Presentation and Disclosure of Fixed Assets Revaluation Based on Tax Regulation in the Financial Statements... 134 The Effect of Tax Avoidance on Risk by Moderating Family Ownership and Board Diversity ... 135
Analysis of Bankruptcy Prediction Using Altman Z-Score, Springate, Zmijewski and Grover Models (Study on Property And Real Estate Companies Listed On The Indonesia Stock Exchange In 2014-2017) ... 136 The Impact of Fixed Assets Revaluation Model Implementation in Publicly Listed Companies: A Study on Property, Real Estate, and Construction and Banking Industries ... 137 The Analysis of Siskeudes (Sistem Keuangan Desa – Village Financial Information System) Implementation Using DeLone and McLean
Information System Success Model in Majalengka Regency ... 138 Value Relevance on Revaluation Methods of Fixed Assets: The Strength of Incremental Explanation of Earnings and Book Value Equity on the Period After Stage One of IFRS Convergency in Indonesia ... 139 Probability of Financial Statement Fraud Using M-Score Based On Corporate Governance Components ... 140 The Worldwide System and Transfer Pricing Practices in Asian Developing Countries... 141 Determination of Sharia Stock Returns ... 142 Quadrant Analysis For Efficiency and Productivity of Islamic Bank in Indonesia... 143 Electronic Village Financial System Implementation in Banyuwangi: Ready or Not? ... 144 The Influence of Organizational Culture, Professional Commitment and Level of Religiosity to Ethical Judgement of the Auditor: Indonesia Evidence ... 145 Government Ownership, the Extent of Human Resources Disclosure, and Financial Performance of Banking Companies in Indonesia ... 146 Mitigate Perception Gap between Internal Auditors and Preparers:
Experimental Evidence from Indonesia ... 147
The Importance of Workplace Spirituality for Auditors ... 148 E-Government and Corruption Experience from Developing Countries .. 149 Local Government Characteristics and Audit Opinion ... 150 Business Strategy on Implementation of Creative Accounting ... 151 IFRS and the Quality of Environmental Disclosure in Mining Industries Listed on the Indonesia Stock Exchange Period 2011-2017 ... 152 Firm Performance And Readability Of The Annual Report ... 153 The Relationship of CSR Disclosure to Tax Avoidance with Creative
Accounting Practice as Mediating Variable: Evidence from Indonesia ... 154 Are Financial Distress and Firm Characteristics Restrict the Operating Segment Disclosure in Marine Industry? ... 155 Factors That Influence Premature Sign-Off Of Audit Procedures (Study In KAP (Public Accounting Firm) in Malang) ... 156 Local Green Accounting Approach: A Survey of Government Policies and Perspectives ... 157 The Effect Of Ownership Structure And Quality Of Corporate Governance To Earnings Management In Emerging Market... 158 ISLAMIC ECONOMICS
Profit Distribution Management of Islamic Commercial Bank in Indonesia Period 2011-2016 ... 159 Exchange Rate Risk Mitigation for Hajj Fund Management in Indonesia by Using Gold and Sharia Interbank Call Money (PUAS) ... 160 Profit and Loss Sharing System and Profitability of Islamic Rural Bank in East Jawa Indonesia ... 161 Effect of Risk of Return and Profit Opportunity on Risk Averse Behavior of Islamic Banking in Indonesia ... 162
Can Country Risks Predict The Indonesia Islamic Stock Index? Evidence from Jakarta Islamic Index ... 163 Utilization of Waqf Funds for Financing Endowments Social Security Agency (BPJS Indonesia) ... 164 A Conceptual Paper : The Effect of Prospect Theory Saving Decision Investment Behavior on Islamic Investors ... 165 Determinants Of Customers Choose Various Size Of Bumiputera Syariah Life Branch Yogyakarta ... 166 Adherence Corporate Governance Guidelines: Evidence from Jordanian Islamic Banks ... 167 Risk Management of Islamic Crowdfunding in Implementing Financial Technology (Case Study PT Ternaknesia Farm Innovation) ... 168 The Influence of Capital Adequacy Ratio, Financing to Deposit Ratio, Non Performing Finance, Operational Efficiency and Inflation on Profitability at The Sharia General Bank (Bus) in Indonesia ... 169 Strategy Selection for Islamic Cooperatives in East Java: A Case Study 170 The Application of Islamic Business Model for Small and Medium Enterprises in The Management of Conventional Cooperatives: A Case Study of Farming Cooperative in Yogyakarta ... 171 Comparison of Risk And Return Between Islamic Banks And Conventional Banks In Indonesia ... 172 Interpersonal Relationships of Salesperson to Customer Trust On Islamic Insurance in Surabaya ... 173 Subjective Norm and Its Influence on Acceptance of Islamic Banking Product in Indonesia ... 174 The Effect of Profitability, Size of Companies, Leverage, and Size of Syariah Supervisory Boards on Islamic Social Report Disclosure (Empirical Study on Syariah Commercial Banks in Indonesia in 2013-2016) ... 175
Analysis of The Impact of Merger And Acquisition Announcements In
Stock Listed In Indonesia Sharia Stock Index 2015-2017 ... 176
A Mapping of Islamization of Accounting ... 177
Differentiated CSR (DCSR) And Consumer Response ... 178
What Are The Determinants Of Padang Restaurant’s Brand Image? ... 179
Managing Re-Visit Intention With Selfie Tourism And Electronic Word Of Mouth ... 180
Commercialization of Tourism Based on Small and Medium Enterprises (SMEs) Case study in Indonesia ... 181
FP-39
The Influence Of Dividend Changes On Future
Earnings Changes
Muhammad Madyan
1
, M. As’ad Trisandi2
and Himmatul Kholidah3
Universitas Airlangga, Jalan Airlangga, Surabaya, Indonesia [email protected]; [email protected];
ABSTRACT
Information is an essential element for investors and businesses. The Market will immediately analyse and interpret all information issued by the company as a signal, whether it is a good signal (good news) or bad signal (bad news). Asymmetry information between management and investors make signalling theory is very important to note. Earnings and dividend are a few things being concerned by investors as a signal of the company. This study aims to examine the influence of dividend changes, earnings per share, and earnings per share changes on future earnings changes. This study used manufacturing companies that pay dividends during 2006-2010 as the sample, and used multiple regression as the research method. Based on the results obtained in this study, dividend changes and CFO1 have a positive and significant effect on future earnings changes, while variable earnings per share, earnings per share changes, and PBV have no
Keywords: dividend; future earnings changes; multiple regression.
FP-215
The PROPER Award, CSR Performance, and Market Performance In The Indonesia Stock Market: Does Environmental
Award Create Value?
Muhammad Madyana, Harlina Meidiaswatib, I Made Sudanaa, Nugroho Sasikironoa1
Universitas Airlangga, Jalan Airlangga, Surabaya, Indonesia a, Univesitas Kartini, Indonesiab
[email protected] ABSTRACT
This study aims to examine the effect of environmental performance measured by rating of the PROPER award (the Corporate Performance Rating Assessment Program in Environmental Management of the Ministry of Environment and Forestry of the Republic of Indonesia) and the performance of the implementation of Corporate Social Responsibility (CSR) on the market performance of company in the Indonesia Stock Exchange. Market performance is measured using the Tobin’s Q ratio, and information about CSR performance is obtained from the issuer's Annual Report. CSR disclosure criteria developed by Hackston and Milne (1996) are used as CSR performance assessment criteria. The sample used was 184 companies listed on the Indonesia Stock Exchange (IDX) for the period 2011-2014 and revealed the implementation of CSR in its annual report.. Test results using ordinary least square indicates that the PROPER award which is a measure of environmental performance is related to market performance. Companies that receive prestigious PROPER awards (blue, green or gold) exhibit higher market performance. CSR performance has a positive effect on market performance. Furthermore, CSR performance is fully mediating the influence of the PROPER award on market performance. However, the assignment of control variables makes partial mediation by CSR occur. Robustness checks using quantile regression show that CSR is fully mediating the influence of the PROPER award on companies with small and medium market performance (Q25 and Q50). While for companies with large market performance (Q75 and Q90) CSR is only partially mediating these influences.
Keywords: the PROPER award; corporate social responsibility performance; market performance.
41
THE INFLUENCE OF DIVIDEND CHANGES ON
FUTURE EARNINGS CHANGES
Muhammad Madyan
1, M. As’ad Trisandi
2and Himmatul Kholidah
31Department of Management, Faculty of Economics and Business, Airlangga University, Surabaya, Indonesia 2 Department of Management, Faculty of Economics and Business, Airlangga University, Surabaya, Indonesia
3Departement of Business, Faculty of Vocational Studies, Airlangga University, Surabaya, Indonesia
[email protected]; [email protected]; [email protected]
Keywords: Dividend, future earnings changes, multiple regression.
Abstract: Information is an essential element for investors and businesses. The Market will immediately analyse and interpret all information issued by the company as a signal, whether it is a good signal (good news) or bad signal (bad news). Asymmetry information between management and investors make signalling theory is very important to note. Earnings and dividend are a few things being concerned by investors as a signal of the company. This study aims to examine the influence of dividend changes, earnings per share, and earnings per share changes on future earnings changes. This study used manufacturing companies that pay dividends during 2006-2010 as the sample, and used multiple regression as the research method. Based on the results obtained in this study, dividend changes and CFO1 have a positive and significant effect on future earnings changes, while variable earnings per share, earnings per share changes, and PBV have no
1 INTRODUCTION
Companies are established with the aim to improve the welfare of its shareholders, and the increase of its shareholder's welfare will be followed with the increase of company’s value. One way to increase the company’s value is by achieving the targeted sales and profits, making it able to pay off its debts, to distribute dividends to its shareholders, and to promote business growth.
Financial information is often used by investors as a tool to predict the current abilities and performances of companies to generate profits. However, as uncertainty in the current business world increases, investors will also need some tools to predict future earnings changes.
Investors often use fundamental and technical analysis to help analyze stocks’ returns and risks. Return of stock consists of dividend and capital gain. Since dividend comes from corporate earnings, investors need to analyze information about companies’ dividend distributions and financial statements as the basis for decision making whether they want to sell or buy certain shares. This existing link between earnings and dividends may be used as
an analytical tool for investors to predict company's future earnings.
The signaling concept within the scope of financial management allows shareholders to gain additional information about the future prospects of companies, including dividends. According to the signaling hypothesis for dividends, when the amount of company dividend is higher than the market expectation, it is a sign that the company's future financial prospects are better than expected. This reason makes all information about earnings and dividends of a company greatly affect the investment decisions of many of its investors and potential investors.
Many previous researches studying the influences of earnings and dividends on company values, characteristics, and prospects have been conducted. Some of those researchers argue that the decision for dividend policy of a company is very important as it will affect the company’s future performances. Previous study done by Olson and McCann (1994) also found that company earnings can be used as a tool to predict future dividends, and vice versa. These findings are consistent with the content of dividend signaling theory.
43 However, based from a research conducted by
Vieira and Raposo (2007), they only found weak evidences about the dividend information hypothesis. They argue that market reaction does not always match with the announcement of dividend changes because market does not understand the signals given by the company through the announcement of dividend changes. Similar results are also found by Grullon, Michaely, Bernartzi, and Thaler (2003), in which dividend changes did not correlate with future earnings changes
In Indonesia, Astuty and Siregar (2007) have already tested the signal from dividend changes and they found that the amount of dividends could significantly signify the company performance during the next one-year period, which is proxied by Return on Equity and Net Profit Margin. Seeing the various results in these studies, authors are interested to re-examine the Influence of Dividend Changes on Future Earnings Changes on Manufacturing Companies Listed on the Indonesia Stock Exchange during the period of 2006 to 2012.
2 THEORETICAL FRAMEWORK
2.1 Earning Per share (EPS)
EPS can be used to measure the share of income earned by the shareholders. According to Skousen et.al (2004: 937), "EPS is profit for a period reported on a per share basis and is used to assess the profitability of a company." Belkaoui (1998) also stated that EPS (earnings per share) represents the earnings received from every outstanding common shares and common shares equivalents or other shares to be converted into the periodic cash.
2.2 Dividen
Dividend policy is determined by the shareholders through the GMS (General Meeting of Shareholders). Dividends are the share of profits that the company provides to its shareholders as a compensation for the use of funds and the risks borne by the shareholders. According to Simamora (2000: 243) dividend is the division of company assets to its shareholders that can be paid in cash, shares of company, or any other current assets. According to Weston and Coopeland (1996: 125), dividend policy is the decision to determine the amount of earnings that will be distributed to the shareholders and the shares of earnings to be held at the company.
2.2.1. Signaling Theory
Signaling Theory emphasizes the importance of information content released by companies. This theory is based on the assumption that the information received by each party is not the same because of information asymmetry exists between corporate management and information users. Thus, managers need to provide the information required by the information users through the issuance of financial statements and annual reports publicly and transparently to attract investors.
After that, the market participants can immediately analyze and interpret all of the information as a signal, whether it is a good signal or bad signal, which will be a hint for the investor about the company’s future prospects.
According to Sharpe et al., (1999) the announcement of dividend distribution information is included as a form of signaling device. Company’s action to distribute cash dividend will make the company circulate a large amount of cash coming from its earnings, which will only be generated by good performing companies, thus this step cannot be followed by poor performing companies.
However, Brigham and Houston (1999) have found it difficult to determine whether changes in stock prices at the time of the announcement of dividend changes reflect the signaling effects or the investors' preference for dividends. However, signaling models are often used to explain the value of dividend changes information content.
2.2.2 Dividen Per Share (DPS)
DPS is a ratio showing how much dividend per share earned by shareholders. The higher the after-tax earnings, the dividend per share that will be accepted by common shareholders will also be higher.
2.3 The Influence of Divdend Changes
on Future Earnings Changes
Companies’ prospects are often reflected based on the presence or absence of dividend changes compared to last year. A research that used dividend signaling models yields the conclusion that firms tend to increase its dividends if the management believes that future earnings changes will increase Sharpe et al. (1999). However, according a research done by Subekti and Kususma (2000), the low value dividend payout policy tends to be conducted by growing companies. Conversely, companies with lower
44 growth rates will seek to withdraw funds from outside
parties to fund its investments at the expense of distributing most of its gained profit in the form of dividend or interest payments.
2.4 The Influence of Earning per Share
and Earning per Share Changes on
Future Earnings Changes
EPS ratio shows the ability of companies to generate profits on a per share basis. However, the value of company’s EPS often affects the amount of dividends the company pays during a certain period. In theory, the amount of dividends paid will be higher if the company can produce a higher earnings per share (EPS). The large dollar amount of dividends will then attract investors because of the perceived company’s ability and performance, thus encouraging the investors to invest in the company, which is expected to also affect company’s future earnings changes. This is supported by a research conducted by Finger (1994), which states that earnings is a significant predictor for companies’ future profits for the next one to eight years.
Meanwhile, high values of earnings per share changes indicate that the company is able to generate high amount of profits from year to year (with the assumption that the number of outstanding shares is fixed). This information often affects in the increase in value and the amount of investment in the company's shares, which will then drive the increase in company’s stock market price. In contrast, information about lower earning indicates that the company has failed to meet shareholder expectations and will ultimately affect future earnings changes of the company.
2.5 The Influence of
Cash Flow
Predictability Estimation (CFO1)
on Future Earnings Changes
The value of earning that has been earned by a company may provide information that is contrary to the amount or value of its cash flows, which is caused by the use of accrual accounting basis.
According to Hendriksen (1989), reporting with an accrual basis still contains some biases because of its historical nature, which raises biases in the
reporting of complex economic activities. Therefore, report on cash flow is now widely considered by financial analysts and investors to provide some additional information about company's abilities to generate profits in the future, to conduct its main operational activities and to fulfill its obligations.
2.6 The Influence of Price-to-Book
Value (PBV) on Future Earnings
Changes
PBV shows how companies are able to create value relative to the amount of capital invested. For well-run companies, this ratio usually reaches above 1, indicating that its stock market value is higher than its book value. The higher the PBV ratio, the more successful that particular company creates value for its shareholders. Indirectly, the increase of this ratio will also affect the funds available for investment and the future earnings of the company.
2.7 The Influence of Return on Equity
(ROE) on Future Earnings Changes
ROE, or Return on Equity, is the return on shareholders’ equity, measured by calculating the ratio of profit earned on book value. Increase in company’s profits will also increase the company’s ROE. This high ROE ratio will become a signal to the investors that the company has been successfully used their own capital effectively and efficiently, and it will provide additional assurances to the investors to obtain the expected income or profit.3 HYPOTHESIS
H1: Increasing dividend changes are positively influencing company's future earnings changes H2: Decreasing dividend changes are positively
influencing company's future earnings changes H3: Earning per share is positively influencing
company's future earnings changes
H4: Earning per share changes are positively influencing future earnings changes.
H5: CFO1 is positively influencing company's future earnings changes
H6: PBV is positively influencing company's future earnings changes.
45 H7: ROE is positively influencing company's future
earnings changes.
4 ANALYSIS MODEL
Multiple linear regression is performed to see the significant level of variables against the dependent variable in this study.
The analysis model of this study is: FECi,t = α0 + α1PDPCxDCi,t + α2NDNCxDCi,t
+ α3SEi,t + α4SECi,t + α5CFO1i,t+1 + α6PBVi,t + α7ROEi,t + ε0 FEC = Future Earnings Changes DC = Dividend Changes
DPC = Dummy Positive Coefficient; valued at 1 for increasing dividend changes and 0 for decreasing dividend changes
DNC = Dummy Negative Coefficient; valued at 0 for increasing dividend changes and 1 for decreasing dividend changes
SE = Earnings per Share
SEC = Earnings per Share Changes CFO1 = Cash Flow Predictability Estimation PBV = Price to Book Value
ROE = Return on Equity
4 RESEARCH METHODOLOGY
4.1
Research Variables
This research uses a quantitative research approach, and the research object is to test the relationship between hypothesized variables. The dependent variable in this study is future earnings changes, and the independent variables are dividend changes, earning per share and earning per share changes.
Meanwhile, the control variables in this study consist of cash flow predictability estimation, price to book value and return on equity
.
4.2
Dependent Variable
The dependent variable of future earnings changes is explained through this equation:
FEC
i,t=
𝐸𝐴𝑉𝐺{𝑖𝑡+1,𝑖𝑡+2}−𝐸𝑖,𝑡 𝑇𝐸𝑖,−1
FECi,t = Future Earnings Changes of company i in year t
EAVG{it+1,it+2} = Average Earning After Tax of
company i in year t+1 and t+2
Ei,t = Earning After Tax of company i in year
TEi,t-1 = Total Equity of company i in year t-1
4.3
Independent Variable and Control
Variable
Independent variables and control variables in this study include:
1. DPC = Dummy positive coefficient, which is valued at 1 for increasing dividend changes and 0 for decreasing dividend changes
2. DNC = Dummy negative coefficient, which is valued at 0 for increasing dividend changes and 1 for decreasing dividend changes
3. Dividend Changes are calculated by dividing the amount of dividend changes of company i in year t-1by its book value of equity
4. Earning per share (SE) is calculated by using standardized variable, which is by dividing company’s EPS in year t-1 by its book value of equity
5. Earning per share changes (SEC) is calculated by using standardized variable, which is by dividing the amount of company’s EPS changes in year t-1 by its book value of equity.
6. Cash Flows Predictability Estimation (CFO1) This research used the model made by Barth et.al (2001):
CFO1i,t+1= α0+ α1CFOi,t+ α2∆ARi,t+ α3∆INVi,t+ α4∆APi,t+ α5Deprei,t+ α6Amorti,t+ α7Otheri,t+ ε0
CFO1i,t+1 = Cash flows predictability estimation
CFOi,t = Operating cash flow of company i in
year t
∆ARi,t = The difference between account
payable of company i in year t and t-1 ∆INVi,t = The difference between inventory of
company i in year t and t-1
∆APi,t = The difference between account payable
and interest of company i in year t and t-1
Deprei,t = Depreciation of company i in year t
Amorti,t = Amortization of company i in year t
7. Price to Book Value (PBV)
Equations used to calculate PBV are: PBVi,t=
𝐶𝑃𝑖,𝑡
𝐵𝑖,𝑡 Bi,t= 𝑇𝐸𝑖,𝑡 𝐶𝑆𝑖,𝑡
CPi,t = Closing price of company i in year t Bi,t = Book Value of equity of company i in year t
46 TEi,t = Total Equity of company i in year t
CSi,t = Total Outstanding Share of company i in
year t
8. ROE
Equation used to calculate ROE is: ROEi,t=
𝐸𝑖,𝑡 𝑇𝐸𝑖,𝑡
Ei,t = Earning after tax of company i in year t
TEi,t = Total Equity of company i in year t
5 DATA TYPE AND SOURCE
The type of research data utilized in study is secondary data obtained from Indonesia Stock Exchange through its website www.idx.co.id. The data used are audited financial statement data that can be obtained from Indonesia Capital Market Directory (ICMD), as well as other publication report data, such as data on dividends, which are required for measurement of variables, which are obtained from previous researches and some other economic and business sites5.1
Population and Sample
The population in this research is manufacturing companies listed on Indonesia Stock Exchange and located in Indonesia during period of year 2006-2012. Purposive sampling method is used with these criteria:
1. Manufacturing companies already listed on Indonesia Stock Exchange during the period of 2006-2012.
2. Manufacturing companies that pay cash dividends on a regular basis for two consecutive years during the period of 2006-2010.
3. Manufacturing companies that obtain positive net income during the period of 2006-2010. 4. Manufacturing companies that have complete
financial reporting data during the period of 2006-2012 and do not conduct any corporate actions.
5.2
Analysis Technique
This study uses statistical methods by calculating the magnitude of each variable to be analyzed. These variables are analyzed using
multiple linear regression analysis with the help of SPSS for windows program. The techniques conducted in this study are as follows:
1. Calculate the value of each variable to be analyzed in this study.
2. Conduct descriptive statistic analysis to understand the overview or description of the magnitude of each variable studied.
3. Test the classical assumptions. This test aims to ensure that the regression model is BLUE (Best Linear Unbiased), which is conducted by performing the normality test, the multicollinierity test, the heteroscedasticity test, and the autocorrelation test.
4. Conduct hypothesis testing, which is to test the influence of independent variables and control variables on the dependent variable using multiple regression analysis. Hypothesis testing is done through F - test and t - test to determine the significant influence of the independent variables and the control variables to the dependent variable, and calculate the coefficient of determination (R2) to be able to know the extent by which the dependent variable can be explained by the independent variables.
6 RESULT AND DISCUSSION
6.1
Result
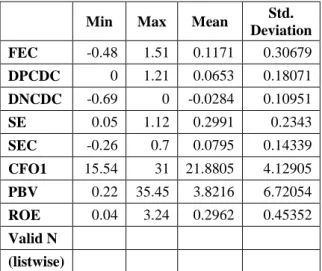
Table 1 below presents the results of descriptive statistics on every variable examined in this research.
Min Max Mean Std.
Deviation FEC -0.48 1.51 0.1171 0.30679 DPCDC 0 1.21 0.0653 0.18071 DNCDC -0.69 0 -0.0284 0.10951 SE 0.05 1.12 0.2991 0.2343 SEC -0.26 0.7 0.0795 0.14339 CFO1 15.54 31 21.8805 4.12905 PBV 0.22 35.45 3.8216 6.72054 ROE 0.04 3.24 0.2962 0.45352 Valid N (listwise)
47 Based on the above table, it can be seen that the
lowest value for FEC variable is owned by PT BATA of -0.48, while the highest value of 1.51 for FEC variable is owned by PT GDYR, because during 2007, the economic condition of Indonesia is at its best condition. With an average value of 0.11 and a standard deviation of 0.30, it indicates that the firms’ future earnings changes are relatively good because of its positive value. The variable of increasing dividend changes is known to have the highest value of 1.21, which is owned by MLBI Company during 2008, and the lowest value of -0.69, which is also owned by MLBI Company during 2009. The earning per share variable has the highest value of 1.12, which is owned by MLBI Company during 2008, and the lowest value of EPS variable is 0.05, which is owned by BRAM during 2007. The variable of earning per share changes has the highest value of 0.70, which is owned by MLBI Company during 2008, and the lowest value of earning per share changes variable is -0.26, which is owned by BATA during 2009. The highest value for CFO1 variable is owned by SMAR with the amount of 31.00 during 2008, and the lowest value of CF01 is owned by SCCO with the amount of 15.54 during 2007. The highest value for PBV variable is owned by MLBI with the amount of 35.45 during 2009, and the lowest value of PBV variable is 0,22, which is owned by MRAT during 2008. Last, the highest value of ROE variable is owned by MLBI Company with the amount of 3.24 during 2009, and the lowest value of ROE variable is 0.04, which is owned by BRAM company during 2007.
The analysis of the influence of independent variables on dependent variable is done by using multiple linear regression analysis with SPSS 21 for windows program.
Table
Multiple Linear Regression Test Results
Variable Coef. Std
Error t-stat Sig. Constanta -0,324 0,223 -1,451 0,077 DPCDC 0,959 0,324 2,958 0,002 DNCDC -0,300 0,509 -0.59 0,279 SE -0,621 0,489 -1,269 0,105 SEC 0,026 0,543 0,049 0.48 CFO1 0,022 0,011 2,047 0,023 PBV 0,017 0,012 1,406 0,083 R Square 0,291 Std Error 0,27579
Source: Processed Data
Based table, the following multiple linear regression equation is obtained:
FEC = -0,324 + 0,959DPCDC – 0,300DNCDC - 0,621SE + 0,026SEC + 0,017CFO1 + 0,022PBV + e
The explanation of the previous equation is as follows:
a. The value of constant (β0) of -0.324 indicates that if the value of independent variables and the control variables are 0 (zero), then the value of future earnings changes (FEC) will decrease by -0.324.
b. The regression coefficient (β1) for DPCDC of 0.959 indicates that if there is an increase in the value of increasing dividend changes by one unit, then the value of future earnings changes (FEC) will increase by 0.959.
c. The regression coefficient (β2) for DNCDC of -0.300 indicates that if there is an increase in the value of decreasing dividend changes by one unit, then the value of future earnings changes (FEC) will decrease by -0.300.
d. The regression coefficient (β3) for earnings per share (SE) of -0.621 indicates that if there is an increase in the value of earnings per share by one unit, then the value of future earnings changes (FEC) will decrease by 0.621.
e. The regression coefficient (β4) for earnings per share changes (SEC) of 0.026 indicates that if there is an increase in the value of earnings per share changes by one unit, then the value of future earnings changes (FEC) will increase by 0.026.
f. The regression coefficient (β5) for CFO1 of 0.022 indicates that if there is an increase in the value of cash flow predictability estimation (CFO1) by one unit, then the value of future earnings changes (FEC) will increase by 0.022. g. The regression coefficient (β6) for Price to Book Value (PBV) of 0.017 indicates that if there is an increase in the value of Price to Book Value (PBV) by one unit, then the value of future earnings changes (FEC) will increase by 0.017. h. Coefficient of determination derived from the value of R – Square is equal to 29.1%, meaning 29.1% of the future earnings changes (FEC) can already be explained by DPCDC, DNCDC, SE, SEC, CFO1 and PBV variables, while the remainder of 70.9% is explained by other variables. Based on Table 4.6, it can be seen the t - test results for 2 independent variables in this study have significance level < 0.05. Those independent variables are the increasing dividend changes (DPCDC), which shows the
48 value of 0.002 and the cash flow predictability
estimation (CFO1), which shows the value of 0.023. These variables have positive significant influences on the future earnings changes (FEC) dependent variable. Meanwhile, the other four independent variables have no significant influences on the future earning changes (FEC) variable because their significance value is above 0.05.
6.1
Discussion
Based on the future earnings changes model, the variable of increasing dividend changes and cash flow predictability estimation (CFO1) have positive significant influences on the future earning changes (FEC), leading to hypotheses 1 and 5 are not rejected. These results are in accordance with the results of previous researches conducted by Zare et.al (2012) and Nissim et.al (2001).
6.1.1 The Influence of Increasing Dividend Changes on Future Earning Changes
The results of this study indicate that increasing dividend changes influence future earnings changes significantly. Part of the reason is because increasing dividend changes is one of the signal that management has forecasted a rise in future corporate earnings. The increasing dividend changes also indicate company’s future prospects based on the evidence that the company has a commitment and ability to increase its long-term earnings and profitability, which is observed as a positive signal by investors, and ultimately lead to increasing stock price. In conclusion, the results of this study do not conflict with the signalling theory. This study is also in accordance with previous researches done by Miller et. al (1985) and Astuty and Siregar (2007) who found that dividend announcements contain current and future earnings information.
6.1.2 The Influence of Decreasing Dividend Changes on Future Earning Changes
The announcement of decreasing dividend payment by Sharpe et al., (1999) is seen as a signal from management that they have lowered their estimates about the company’s future earnings. Some firms are reluctant to lower the amount of dividends it distributes to investors because the market will see this action as an indication that the company is going through a bad financial condition. As a result of this information, investors will often lower their expectations about company's future earnings, which will eventually lead to falling in the company’s stock prices. Based on the results of this study, decreasing
dividend changes variable has insignificant value, meaning a decrease in the amount of dividend payment is not to be responded by investors directly because there are many investors who see this information as a result that the company wants to reinvest, where it will take time to get the result.
6.1.3 The Influence of Earnings per Share on Future Earnings Changes
The results of this study are in line with the results of previous research conducted by Zare et.al (2012), which states that earnings per share has no effect on future earnings changes. Generally information about earnings is often influenced by the earnings management practices or the permanent earnings policy determined by the company. However, according to Miller and Rock's research in Elly Rahmad (2009), they stated that company that distributes dividends tends to conduct earnings management activities, while one of the most common earnings management practices is income smoothing.
In addition, the value of net profit which is stated in company’s income statement is prepared on the basis of accrual basis. This accrual basis allows the reporting of revenues and expenses even though no cash has been received or distributed. In addition, the insignificant influence of earnings per share on future earnings changes can also be caused by the effects of the crisis around the year of 2008 that affect investors' confidence in Indonesia market, thus making the information about firms’ earnings to be less considered by the investors.
6.1.4 The Influence of Earnings per Share Changes on Future Earnings Changes
Based on the result of this study, earnings per share changes has no significant effect on future earnings changes. This result can be explained by the possibility that future earnings are influenced by previous earnings associated with the permanent earnings policy already determined by the company. The preparation of an income statement on an accrual basis also allows for the reporting of income and expenses even though no cash has been received or distributed by the company. This result is in line with the results of previous researches conducted by Zare et. al (2012) and Nissim et.al (2001), stating that the value of company’s earnings per share changes do not influencing the future earnings changes.
49
6.1.5 The Influence of Cash Flow Predictability Estimation (CFO1) dan Price per Book Value (PBV) on Future Earnings Changes
The results in this study shows that cash flow predictability estimation (CFOI) is influencing future earning changes. Cash flow is very important for company’s operations because cash is used to pay debts, to pay dividends, and to finance the operations of the company. This shows that the value of cash flow predictability estimation can convey information about the future prospect of the company. Meanwhile, the insignificant influence of Price to Book Value (PBV) to reflect future earnings changes is due to the Indonesia stock market that is strongly influenced by the investor sentiment. These conditions make any changes in CFO1 and PBV to have no effect on the future earnings changes of the company.
7 CONCLUSIONS
The results of this research can be concluded as follows:
1. Increasing dividend changes are positively influencing company's future earning changes 2. Decreasing dividend changes are not positively influencing company's future earning changes
3. Earning per share (EPS) is not positively influencing company's future earnings changes 4. Earning per share changes are not positively
influencing future earnings changes
5. CFO1 is positively influencing company's future earnings changes
6. PBV is not positively influencing company's future earnings changes
REFERENCES
Anand, M. 2004. Factors Influencing Dividend Policy Decisions of Corporate India. (Working paper)
Astuty, Ni made Ria K. dan Siregar, S. V. N. P. 2008. Hubungan antara sinyal dividen tunai dengan kinerja operasional dan kinerja pasar. Jurnal Akuntansi dan Keuangan Indonesia vol. 5 No. 1.
Bhattachary, S. 1979. Imperfect Information, Dividend Policy and the Bird in the Hand Fallacy Bell. Journal of Economics. 10: 259-270.
Barth, M., Cram, D., and Nelson, K. (2001). Accruals and the prediction of futurecash flows. The Accounting Review, 76, pp: 27-58.
Bernartzi, S.R. Michaely and R. Thaler. 1997. Do changes in the dividend signalthe future or the past?. Journal of Finance, vol 52: p. 1007-1034.
Belkaoui, A.R. 2007. Teori Akuntansi Edisi Keempat. Terjemahan. Jakarta: Erlangga.
Brigham, Eugene F. And Joel F. Houston. 2001. Manajemen Keuangan. Jilid II. Terjemahan. Jakarta : Erlangga
---. 1999. Manajemen Keuangan, Terjemahan, Jakarta : Erlangga
Chang, C.-C., Kumar, P., and Sivaramakrishnan, K. (2006). Dividend changes, cash flow Predictability, and Signaling of Future Cash Flows. Universityof Houston.
Darmadji, Tjipto dan H.M. Fakhruddin. 2001. Pasar Modal di Indonesia. Jakarta: Salemba Empat. DeAngelo, H., DeAngelo L. and Skinner, D. J. 1992.
Dividends and Losses. Journal of Finance. Vol. 47 No. 5, pp. 1837-1863.
Ely, K. Dan G. Waymire. 1999. Accounting Standard-Setting Organizations andEarnings Relevance: Longitudinal Evidence from NYSE. Common Stock, 1927-93. Journal of Accounting Research 37: 293-317. www.ssrn.com(online) 24 Maret 2011. Fama, Eugene F. 1978. The Effects of a Firm’s
Investment and Financing Decisions on the Welfare of Its Security Holders. The American EconomicReview. 272-284.
Finger, Catherine. 1994. The Ability of Earning to Predict Future Earning and Cash Flow. Journal of Accounting Research Vol. 32.2 (Autum), P.210-223.
Gordon, M. J. 1963. Capital Investment and Financing Policy. Journal of Finance, May. Grullon, G., Michaely, R. and Swaminathan, B. 2002.
Are Dividends Changes a Sign of Firm Maturity?. The Journal of Business. 75 (3), 387-424.
Grullon G., Michaely, R., Bernartzi, S., Thaler, R.H. 2005. Dividend Changes do not Signal Changes in Future Profitability. Journal of Business vol.78,no.5.
Ghozali, Imam. 2001. Aplikasi Analisis Multivariate bagi Program SPSS. Semarang: Badan Penerbit UNDIP.
Hendriksen. 1989. Teknik Analisa Keuangan. Jakarta: Erlangga.
50 Iswati et al.,. 2000. Price Book Value Ratio Sebagai
Strategi Investasi Di Bursa Efek Surabaya. Majalah Ekonomi. Tahun X No. 2 Agustus. UniversitasAirlangga.
Jones, Charles P. 2004. Investment Analysis and Management. Ninth Edition: New York: John Wiley & Sons.
Kurniawan, B., Syahrir Ali, dan Rahmat Febrianto. 2005. Post -Dividend Announcement Performance of Listed Companies in Indonesia: A Test of Dividend Signaling Hypothesis. Dalam SNA VIII, Solo.
Lee, F.Cheng and Finerty, E. Joseph. 1990. Corporate Finance, Theory, Method, and Application. Harcourt Brace Jonavich Publisher. New Jersey.
Lintner, John, 1956. Distribution of Incomes of Corporations among Dividends, Retained Earnings and Taxes. The American Economic Review 46 (2),97-113.
Miller, Merton H. and Rock, Kevin. 1985. Dividend Policy Under Asymmetric Information. The Journal of Finance 40 (4), 1031-1051.
Miller, M. H., and Modgiliani F. 1961. Dividend Policy, Growth, and the Valuation of Shares. Journal of Business, 34:411-433. Nissim, D., and Ziv, A. (2001). Dividend changes
and future profitability. Journal of Finance. vol 56:p. 2111-2133.
Olson, G. T. and McCann, P. D. 1994. The Linkages between Dividends andEarnings. Financial Review. 29: 1–22.
Penman, S.H. 1983. The predictive content of earnings forecasts and dividends. Journal of Finance.
Robert Ang. 1997. Buku Pintar: Pasar Modal Indonesia. Mediasoft. Indonesia.
Sharpe,W.F, Gordon,J.A & Jeffery,V.B. 1999. Investments 6thEdition. Prentice Hall. Skousen, K. Fred, Earl K. Stice, Stice, James D.
2000. Intermediate Accounting, 14th ed. South Western College Publishing. Sudana, I Made. 2011. Manajemen Keuangan
Perusahaan Teori & Praktik. Jakarta: Penerbit Erlangga.
Simamora, Henry. 2000. Akuntansi Basis Pengambilan Keputusan Bisnis. Jakarta: Salemba Empat.
Subekti, Imam. 2010. Integrated Earning Management, Value Relevance ofEarning and Book Value of Equity. Jurnal
Akuntansi dan Auditing Indonesia Vol. 14., No. 2.
Van Horne, James C. and John M. Wachowicz, Jr., 1998. Fundamental Of Financial Management, Tenth edition. New Jersey: Prentice HallInternational. Inc.
Vieira, E. and Raposo, C. C. 2007. Signalling with Dividends? The SignallingEffects of Dividend Change Announcements: New Evidence from Europe. working paper. (online) www.ssrn.com
Weston, Freed and Thomas E. Coopeland. 1996:125. Manajemen Keuangan.Jakarta: Erlangga. Zare, iman, and Amiri, M. Taghi (2012). Relation
between Future Earnings Changes with Changes of Dividend. European Journal of ScientificResearch”. 66 pp. 643-651.