Software Tool Development
ByHanna Farah
Thesis
Presented to the Faculty of Graduate and Postdoctoral Studies in partial fulfillment of the requirements for the degree
Master of Applied Science
Ottawa-Carleton Institute for Electrical and Computer Engineering
This research is supported by IBM, NSERC, and the Consortium for Software Engineering Research.
I would like to express my gratefulness to the following:
• Dr. Timothy C. Lethbridge, my supervisor
• Marcellus Mindel, Director of the IBM Ottawa Center for Advanced Studies
(CAS)
• CAS Ottawa members • IBM staff and coop students • Family and friends
for their support, advice, feedback, and encouragement throughout my research.
API: Application Program Interface BTA: Borland Together Architect CAS: Center for Advanced Studies
CORBA: Common Object Request Broker Architecture CVS: Concurrent Versioning System
EMF: Eclipse Modeling Framework GEF: Graphical Editing Framework
GMF: Graphical Modeling Framework (incorporates EMF and GEF) TME: Temporal Model Explorer
TMEP: Temporal Model Explorer Prototype RSA: Rational Software Architect
RSD: Rational Systems Developer RSM: Rational Software Modeler RSx: either RSA, RSD or RSM
This research was motivated by the development of a set of cognitive patterns [3], and the hypothesis that those patterns could lead to innovative and useful features in software development environments. Cognitive patterns are descriptions of ways people think and act when exploring or explaining software. In this research we focused on the Temporal Details cognitive patterns, which describe the dynamics of the changes in someone’s mental model.
The main objective of this research, therefore, is to determine to what extent software engineering tool features could be derived from the cognitive patterns, specifically belonging to the Temporal Details hierarchy.
As the first step in our research, we analysed current tool support for cognitive patterns. The second step was to create and evaluate a list of potential new features based on the cognitive patterns. Thirdly, we developed a prototype for our most promising feature entitled Temporal Model Explorer (TME). This prototype helps people understand and manipulate the history of a software model. Users can use a slider to browse the history of the construction of a UML diagram from its point of creation to its current state. Navigation can be performed at different levels of granularity. Design rationale can be included at any point in the history. The final step was to evaluate the TME prototype with twelve participants from different backgrounds. The participants found the tool useful, and agreed that they would use it if it was available in their work environment.
Acknowledgements...i
Abbreviations ...ii
Abstract ...iii
Table of contents ...iv
List of tables ...vii
List of figures...viii
Chapter 1: Introduction... 1
1.1 Main contribution... 1
1.2 Background ... 2
1.3 About cognitive patterns... 3
1.4 Problem and main hypothesis ... 5
1.5 Motivation... 6
1.6 Overview of the Temporal Model Explorer feature in the context of Cognitive Patterns ... 6
1.7 Key results ... 7
1.8 Outline of the remainder of the thesis ... 7
Chapter 2: Review of current software development tools... 8
2.1 Software development tools history ... 8
2.2 Current solutions and limitations ... 9
2.2.1 Physical division... 10
2.2.2 Temporal division... 12
2.2.3 Annotations, temporal annotations and design rationale documenting ... 16
2.2.4 Fine-grained change tracking ... 18
2.2.5 Persistent undo stacks ... 18
3.1.2. Elements filter ... 28
3.1.3. Diagram slider ... 29
3.1.4. Diagram version slider... 29
3.1.5. Package outline... 29
3.1.6. Easy access to versions of a diagram... 29
3.1.7. Search for feature... 30
3.1.8. Explanation diagrams... 30
3.1.9. Features list ... 30
3.1.10. Alternative diagrams display... 31
3.1.11. Part swapping ... 31
3.1.12. Annotations ... 31
3.1.13. Version player ... 32
3.1.14. Diagram compare... 32
3.1.15. Save compare... 32
3.2 Evaluating and grouping the features ... 32
3.2.1 Participants feedback ... 33
3.2.2 Feature scores ... 36
3.3 Descriptions and analysis of the three main features ... 39
3.3.1 Diagram equalizer... 40
3.3.2 Diagram player ... 41
3.3.3 Diagram guide ... 42
3.3.4 Chosen feature... 43
Chapter 4: Building the TME prototype... 44
4.1 Prototype description... 44
4.2 Prototyping with informal tools ... 45
4.3 Initial prototype... 45
4.4 Functional prototype... 49
4.4.1 For which tool, why? ... 49
4.4.5 Architecture and tool integration... 60
Chapter 5: Prototype evaluation ... 65
5.1 Summary of the procedure... 65
5.2 Details of the experiment setup and procedure for Steps 2 and 3... 67
5.2.1 Participants... 67
5.2.2 Independent Variable... 67
5.2.3 Variables controlled, and blocking... 67
5.2.4 Setup of the equipment ... 70
5.2.5 Conduct of the experimental sessions... 71
5.3 Results of performance improvements tests ... 72
5.3.1 Time and accuracy answering questions... 72
5.3.2 Initial understanding time for participants ... 75
5.4 Participant preference ... 77
5.5 Additional participant feedback ... 80
5.5.1 Change management... 81 5.5.2 Visualization... 82 5.5.3 Operation... 83 5.5.4 Navigation ... 83 Chapter 6: Conclusion ... 85 6.1 Problem statement ... 85
6.2 Proposed solutions and their effectiveness ... 85
6.3 Threats to validity... 86
6.4 Future work... 87
References... 89
Appendix 5 – Preference questionnaire... 106
Appendix 6 – Raw and normalized data from user study ... 108
A6.1 Preference questions ... 108
A6.2 Timings ... 109
Appendix 7 – Experiment data forms ... 111
A7.1 Participant steps for Treatment pattern 1 t23 and 1 t32... 111
A7.2 Participant steps for Treatment pattern 23 t1 and 32 t1... 113
List of tables
Table 1 - Prototype features' weights... 37Table 2 - Prototype features' categorization ... 38
Table 3 - Prototype features' grouping to create three new main features ... 39
Table 4 - Main prototype features evaluation... 39
Table 5 - Prototype iterations ... 55
Table 6 - Allocation of participants to models ... 69
Table 7 - Blocking of participants ... 70
Table 8 - All participants, answering speed ... 72
Table 9 - All participants, answering accuracy ... 73
Table 10 - Non-expert particpants’ answering speed... 73
Table 11 - Non-expert participants’ answering correctness ... 73
Table 12 - Expert participants’ answering speed... 74
Table 13 - Expert participants’ answering accuracy... 74
Table 14 - Hypotheses evaluation by participant groups ... 75
Table 15 – All participants’ understanding times... 75
Table 16 - Above-average participants’ understanding times (all values in seconds)... 76
Table 17 - Below average participants’ understanding times ... 76
Table 18 – Participants’ over or under estimation of self-ability ... 77
Table 21 - Usability study, participant suggested improvements (columns indicate
participants)... 81
Table 22 - Answers to preference questions... 108
Table 23 - Performance results, timing 1 ... 109
Table 24 - Performance results, timing 2 ... 110
List of figures
Figure 1 - EASEL change sets [11] ... 11Figure 2 - Eclipse history revisions view ... 12
Figure 3 - Eclipse CVS annotations view ... 13
Figure 4 - RSA model compare tree view... 14
Figure 5 - RSA model compare visualization 1... 14
Figure 6 - RSA model compare visualization 2... 15
Figure 7 - RSA model compare visualization 3... 15
Figure 8 – RSA UML note attached to a class ... 17
Figure 9 - StarTeam change request form, synopsis tab ... 17
Figure 10 - StarTeam change request form, solution tab ... 18
Figure 11 - RSA diagram elements popup menu... 20
Figure 12 - RSA palette for class diagrams... 20
Figure 13 - RSA popup menu for class diagrams... 20
Figure 14 - RSA model explorer view ... 21
Figure 15 - RSA find and replace view... 21
Figure 16 - Eclipse popup menu, team options ... 22
Figure 24 - StarTeam Audit view ... 26
Figure 25 - Details equalizer sketch... 28
Figure 26 - Diagram equalizer sketch ... 40
Figure 27 - Diagram player sketch... 41
Figure 28 - Diagram guide sketch... 42
Figure 29 - Initial prototype, model screenshot with annotation... 47
Figure 30 - Initial prototype, model screenshot with highlighting ... 48
Figure 31 - Initial prototype, model screenshot with annotations ... 48
Figure 32 – Diagram Player view (before using the term TME)... 53
Figure 33 - Final prototype screenshot... 55
Figure 34 – TME prototype design, control package... 61
Figure 35 – TME prototype design, integration package... 62
Figure 36 – TME prototype design, UI functionality ... 63
Figure 37 – TME prototype design, information usage ... 64
Figure 38 - Elections system, design 1... 93
Figure 39 - Elections system, design 2... 94
Figure 40 - Investment system, design 1... 96
Figure 41 - Investment system, design 2... 97
Chapter 1: Introduction
The purpose of this research is to evaluate the benefits of designing application features based on Murray’s cognitive patterns [3]. Therefore, our plan is to develop a functional software prototype and evaluate its benefits to software developers. The idea behind the prototype is to add a new feature to modeling tools for better support of cognition, thus enhancing the user’s experience and performance. The research has been performed in collaboration with the IBM Centers for advanced studies, benefiting both the academic and industrial communities.
1.1 Main contribution
In this research, we have developed and evaluated a software prototype entitled ‘Temporal Model Explorer’ (TME) to help people explore, understand and manipulate the history of a software model.
The motivation for the research was the development of a set of cognitive patterns
– descriptions of the ways people think and act when exploring or explaining software – developed by other researchers in the Knowledge-Based Reverse Engineering group at the University of Ottawa.
The main objective of our research is to determine to what extent software engineering tool features could be derived from the cognitive patterns. We specifically focused on patterns in the temporal details hierarchy (explained in Section 1.3).
As the first stage of our work, we studied the features in two major modeling tools: Rational Software Architect (RSA) and Borland Together Architect (BTA). This study analysed the extent to which the tools’ existing features relate to the cognitive patterns. Following this analysis, we developed, discussed and refined a list of potential new modeling tool features based on the cognitive patterns. Finally, we developed and evaluated a prototype of the feature that our study determined was the most promising.
a particular point in time (these are independent of UML notes and are not part of UML). The annotations could be used, for example, to provide design rationale. They would only appear when a software engineer reviews the diagram as it existed at the specific time; they then disappear.
We developed the prototype in the context of IBM’s Rational suite of UML modeling products [16]. The final prototype is a plug-in for Rational Software Modeler, version 7; however, it is designed such that it should be able to work with any Eclipse-based tool that uses the Eclipse Graphical Modeling Framework [13].
We evaluated the prototype to capture the participants’ preferences, experience and performance while exploring UML models. We conclude that the cognitive patterns are indeed a good basis for the development of software engineering tool features.
1.2 Background
The cognitive patterns were developed by Murray as a key element of his PhD research [1], under the direction of Lethbridge. The development of the patterns was based on extensive literature review and user studies in industrial settings [4]. The collection of patterns is divided into various categories including one called “Temporal Details” [3], which was our main focus in this research. Temporal Details is both a high level pattern, as well as a pattern language containing several sub-patterns.
It is well understood that while understanding a software system, a software engineer’s mental model changes over time. The Temporal Details patterns describe the dynamics of the changes in someone’s mental model [3]. The pattern can be used to describe the changes in how the mental model is expressed, e.g. using diagrams. One of the most important of the Temporal Details Patterns is called Snapshot. Murray put particular emphasis on developing this pattern, gathering a large amount of data and developing a comprehensive snapshot theory.
In Murray’s research, the cognitive patterns and snapshot theory were developed with the hypothesis that they could help developers create better software engineering tools. The idea is to base tool feature development on the results of scientific studies. Resulting tools should better support aspects of human cognition, which is an important
factor in their evaluation [6]. In our research, we provide a practical implementation to test Murray’s hypothesis.
1.3 About cognitive patterns
“A cognitive pattern is a structured textual description to a recurring cognitive problem in a specific context” [3].
A cognitive pattern differs from the well-known software design patterns in the following manner: A design pattern captures a technique to solve a design problem, whereas a cognitive pattern captures a technique that is partly or wholly mental and that is employed potentially subconsciously by a person trying to perform any complex task. One example of a cognitive pattern is the ‘Thinking Big’ pattern. It describes how when the user is exploring one part of a system, he will tend to need to see the big picture in order to fully understand how the part he is studying relates to the rest of the system and how it affects the system.
Cognitive patterns are categorized in a hierarchy. Higher-level patterns may contain several related sub-patterns. Two examples of higher-level patterns [2] are
Baseline Landmark, which describes how a person navigates his way to the understanding of a problem with constant reference to familiar parts of the system, and
Temporal Details, which is our main focus in this research.
The Temporal Details pattern and its sub-patterns deal with the fact that humans cannot understand something complex instantly. Their understanding must evolve with time. In particular, aspects of initial understanding might need to be augmented or replaced. As a high level pattern, the temporal details pattern is broken down into the following sub-patterns: Snapshot, Long View, Multiple Approaches, Quick Start, Meaning, and Manipulate History1. The following briefly explains what each pattern is about:
Snapshot:A snapshot is an instance of a representation2 at a point in time during its evolution such that the most recent incremental changes to the representation is
conceptually complete enough for people to discuss and understand it. The snapshot does not have to be an accurate or complete representation and it may contain inconsistencies. Snapshots can be seen during a time when someone is creating a diagram or model in a software engineering tool, or during an explanation someone presents on a whiteboard. The process of identifying snapshots is somewhat subjective, but in [1], Murray provides concrete guidelines for doing so, and also identifies a wide variety of types of snapshots. To illustrate the key concept of being conceptually complete: if the user added a class box in a UML diagram and then named the class, the snapshot would be considered to occur only after the class is named.
Long View: A Long View is a series of related snapshots; in other words, a set of representation-instances through a period of time as the representation is being developed to convey some concept. Showing the series of snapshots in a Long View is a way to tell a story visually. A user might use a Long View to explain a new aspect of a system.
Multiple Approaches: Sometimes a user has difficulty understanding a concept following a particular explanatory approach. A solution is to consider alternative approaches to gain more understanding. Moreover, there might be different valid alternatives to solve a particular problem.
Quick Start: People need simple starting places to begin understanding or exploring a system. They will often refer to something familiar and evolve their understanding from that point. Quick Starts can form the first snapshots in Long Views. For example, rather than explaining all aspects of a system’s development, an explanation could start with a simple version that is well known.
Meaning: It is important for reviewers to understand the reasons behind design decisions or multiple approaches. The thoughts in the designer’s mind are lost with time. It would be beneficial for the reviewer to be able to know what the designer was thinking and the reason behind his design. It is also important to capture the logic while moving on from one state of the system to another. It can also hold key information that explains
2 The representations we will focus on are UML models, but the cognitive patterns have broader scope.
the changes made to a system. Meaning is essential in understanding how a system is built and how it evolved. The notion of temporal annotations, discussed earlier, is the most concrete manifestation used to explicitly record meaning, although the Meaning pattern covers the idea of implicit meaning too.
Manipulate History: This pattern builds on Snapshot, Long View and Multiple Approaches (those allow you to designate points, sequences and branches in the history of a model’s evolution). Manipulate History allows you to adjust the history itself so you can revisit your understanding process.
1.4 Problem and main hypothesis
Software developers encounter difficulties when trying to understand or explain large software projects using current development tools. People have a difficult time understanding a complex artifact, such as a model or design, which has been developed over time.
The above problem can be broken down into several sub-problems:
a) Humans are fundamentally unable to absorb a complex model when it is presented as a single chunk. Humans need assistance building a mental model of the model. The understanding process helps people to organize their mental model into chunks.
b) People do not know what the most important aspects of a model are; in particular they have a hard time finding the parts of a complex model that they need to solve their own problem.
c) People do not know the best place to start understanding a model. They do not automatically know a reasonable sequence to approach the understanding so that they can build on prior knowledge in a sensible way. They will therefore tend to start in an arbitrary place, and waste time understanding parts of a model which are not relevant to their needs, or which are not ‘central’ to the model.
f) People are unaware of the decisions and rationale that led the model to be the way it is.
g) Unawareness of aspects of a model leads to incorrect decisions and repeated work (such as re-analyzing the same issue someone has already analyzed).
h) People are unaware of design alternatives that were considered but did not find their way into the final design – such lack of awareness can cause people to
choose a design alternative that should be rejected.
To summarize: Software developers are not provided with enough features in their development environments that go side by side with cognition. This reduces the amount of understanding that developers are able to extract from software models therefore requiring more time to understand changes and design decisions.
We hypothesize that this problem could be solved to a limited extent by incorporating features based on the temporal details cognitive patterns.
1.5 Motivation
A prototype proposing a solution to the above problem could allow developers to understand software systems in a smaller amount of time, which would result in increased productivity. Such a feature may also improve understanding, resulting in better decisions, fewer defects, and higher quality.
The prototype could also lead to a commercial product delivered to customers. The idea of basing tool features on cognitive patterns could influence the industry to base development of software features on scientific studies, and more specifically on studies of cognitive patterns.
1.6 Overview of the Temporal Model Explorer feature in the
context of Cognitive Patterns
As discussed in Section 1.1, we created a feature in Rational Software Modeler that we call TME (Temporal Model Explorer). This feature records the complete history of development of a UML model at the level of the individual user-interface commands
the user employs (e.g. adds a class, renames a variable, or creates a relationship). The resulting record is a Long View.
The user can mark points in development history as Snapshots. People later trying to understand the model can use a scrollbar to slide each diagram “backwards and forwards in time”, and can jump from snapshot to snapshot. The set of snapshots can be edited at any time.
Finally, a user can create, edit and view temporal annotations, thus rendering the Meaning of changes explicit.
Incorporation of feature extensions related to Quick Start and Multiple Approaches is left to future work.
1.7 Key results
Participants expressed a very positive experience using our prototype. All the participants agreed that the TME prototype helped them understand class diagrams faster. Participants enjoyed the concept of snapshots and the majority wrote that temporal annotations are very useful when understanding models.
The majority of participants preferred a specific variant of our feature we call “final position.” In this variant, when viewing an earlier state of the system, the layout of the diagram appears with all classes in the positions to which they are eventually moved.
Participants agreed that the tool is user-friendly and that they would use it if it was available in their work environment if they were asked to understand a class diagram.
1.8 Outline of the remainder of the thesis
Chapter 2 includes a review of software development tools, with an analysis of their features and limitations, as well as how they support cognitive patterns. Chapter 3 outlines the procedure for choosing a new feature to prototype. Chapter 4 talks about the
Chapter 2: Review of current software development
tools
This chapter first introduces how development tool environments have evolved over time and outlines some of the remaining limitations in such environments. We will discuss current solutions and limitations illustrating these with examples from current software development environments including IBM Rational Software Architect 6.0 and Borland Together Architect 2006. We will relate current features to specific temporal details cognitive patterns.
2.1 Software development tools history
Software development tools and environments have advanced a lot starting with simple editors and compilers [23] to large-scale software visualization and development applications. With the advancement of computer hardware, software been able to progress in size and complexity to places never thought of before, with sizes of hundred of millions lines of code. Software exploration, search, analysis and visualization tools have become necessary, as have change management systems. New tools are often released, and studies of which tools are better have been performed [5]. Many tool evaluation frameworks have also been set up to help developers and designers create better tools.
Early environments were useful but they did not provide tools that were clearly integrated together [23]. It was the developer’s job to connect the tools together: using pipes for example. The first tool integration efforts resulted in allowing a compiler to send the location of syntax errors to the editor which would handle the event [23]. Tools could register for events in other tools such that they would be notified when the registered events took place.
The main challenge in software development tools is still their integration [23]. While tools have advanced so much, in practise, their use has not advanced as much. The problem lies in the fact that the tools are still specific. They might force the user to write his program in a specific language or use a particular operating system. Some of the solutions to this challenge include the adoption of XML for saving and exchanging data
by a large number of commercial applications. Parsers have been developed to allow applications to read and save XML data easily.
Another important factor that is has often not been given enough attention in software applications is the problem of usability. While most developers know the basic graphical user interface guidelines, only a few of them are able to incorporate User-Centered Design in the software development lifecycle [20]. Developers should learn to appreciate a user-centered design approach and to evaluate the impact of choosing certain dialogue types and input/output devices on the user.
The above remarks were key motivators when building our functional prototype. We focused on the integration and usability factors: the prototype had to be well integrated and very easy to use. Our experiments in later stages confirmed that the participants found the prototype to be very user-friendly and they all agreed that they would use it if it was available to them.
2.2 Current solutions and limitations
We decided to explore the features of two modeling tools that are well known and well established in the software industry. The chosen tools were Rational Software Architect 6.0, which continues the series of the well known Rational Rose modeling products, and Borland Together Architect 2006.
IBM Rational Software Architect, RSA, is a software design and development tool that provides users with modeling capabilities and other features for creating well-architected applications and services [14]. Two powerful features of RSA are the browse and topic diagrams that allow users to explore a UML model based on a chosen central element from the model and looking through relationships of that element to the rest of the model. Filters can specify the depth and types of relationships to show. IBM Rational ClearCase, which is integrated with RSA, provides sophisticated version control [18]. Rational Software Modeler (RSM) [15] supports the same modeling features of RSA but
Borland released a new series of products in 2006 related to software modeling: Together Architect, Together Designer, and Together Developer [7]. Each tool provides specialized features related to the role of its intended user (software architect, designer, developer). However, they all provide the same modeling capabilities so we have chosen to evaluate Borland Together Architect 2006 (BTA) to learn more about the modeling features that Borland provides. The StarTeam product from Borland provides a complete range of change and configuration management solutions [8].
A variety of types of solutions have already been developed to address the problem described in the introduction (Section 1.4) – i.e. problem of people having a difficult time understanding a complex artifact, such as a model or design that has been developed over time.
The solutions can be broken down into several categories: physical division, temporal division, annotations, fine-grained change tracking, and persistent undo stacks. We will explain in the following the concepts in each category of solutions and the extent to which they solve the problem. We will also show screen shots and comment on how current products present features in certain solution categories. Additionally, we will relate the features to cognitive patterns.
2.2.1 Physical division
The most common known partial solution to the main problem we are addressing can best be described by the terms ‘divide and conquer’, ‘drilling down’ or ‘physical division’ of the artifact. A model is divided into multiple views or documents, typically arranged hierarchically. The understander starts by understanding a top-level overview that typically contains only a few details, and then ‘drills down’, expanding details as required.
Facilities for doing this kind of hierarchical exploration are found in a vast number of environments:
• Outline processors in a word processor allow you to see a table of contents to get
an overview of a document, and then expand any section or subsection as needed
• Tools in modeling environments show a hierarchy of the artifacts available in a
• ‘Grouping’ facilities in a spreadsheet allow you to hide and show groups of lines
or columns. These can be nested.
• Facilities in a map viewer allow you to expand the types of details shown as you
zoom in on a location.
• RSA browse diagrams allow you to browse a model by specifying a central
object and the depth of the relationships from that object to the rest of the model. A user can increment the depth to learn incrementally about the model.
• EASEL [21] allows you to construct an architecture using several change sets
(group of artifacts). Reviewers can apply or remove change sets to understand different features or versions of the represented system. Figure 1 shows EASEL’s user interface including the different layers (change sets) that the user can apply or remove.
• Physical division solutions relate to the Quick Start pattern discussed in Section
1.3.
Figure 1 - EASEL change sets [11]
Extent to which the above solves the fundamental problem we are addressing
This first class of solutions, facilities for divide and conquer or drilling down, partially solve sub-problems a) to e) in Section 1.4, but they offer very limited assistance
2.2.2 Temporal division
The second major class of solutions is facilities that allow you to look at different versions of a model as they have existed at different points in time. For example, you can use a configuration management or change control tool (such as CVS, to be discussed in Section 2.2.3, or ClearCase [18]) to look at an earlier stage in a model’s development. Often the earlier stage is simpler and thus easier to understand. The understander can proceed by initially looking at the simpler model and then looking at subsequent versions one by one. This naturally solves sub-problem c) (in Section 1.4).
Temporal division solutions relate to the Snapshot and Longview patterns discussed in Section 1.3.
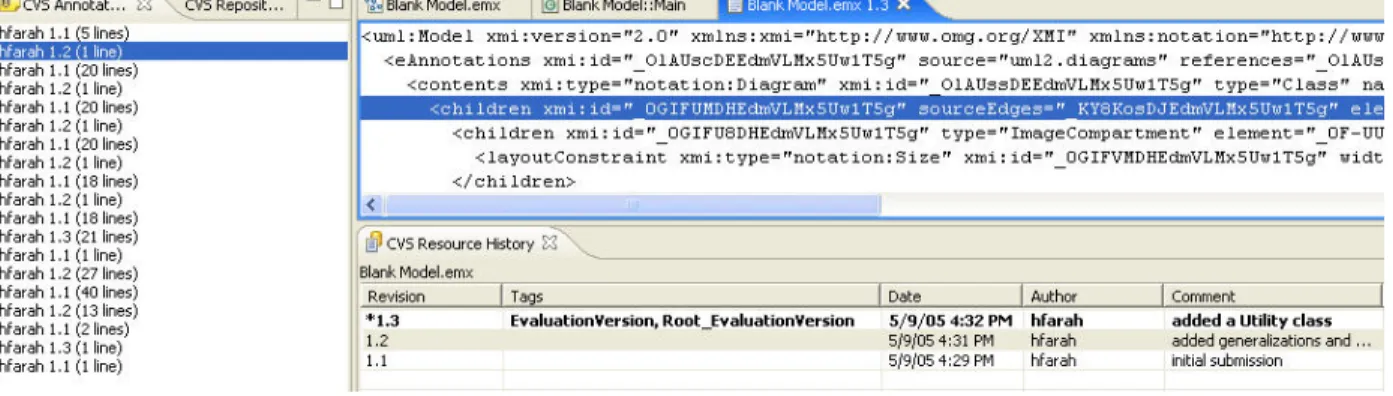
RSA and BTA support these solutions through the CVS features provided by Eclipse. The user has the option to use CVS repositories to maintain different versions of a system. The user is able to commit changes with comments that help understand the reason of the changes in the future. A table lists all the versions of a file including the time, date, author and comment related to the changes. The list of versions in the “CVS Resource History” can be considered as a Long View (series of Snapshots) as it shows the user the evolution of the system through each version. Figure 2 shows different versions of a file, each version is tagged with a date, author and comment.
Figure 2 - Eclipse history revisions view
The “CVS Annotate” feature allows the user to go through a file (text based) sequentially from the start until the end while seeing which part belongs to which version and the comments on that version. The number of lines and the author of the change are highlighted; the text inside the file is highlighted as well as the version number (as shown in Figure 3). The user can easily associate the highlighted areas together.
Figure 3 - Eclipse CVS annotations view
Some tools, such as Rational Software Modeler / Rational Software Architect have Compare-Merge facilities that allow you to see the difference between two versions to better understand the changes, and as a result, to better understand the overall model. RSA compare-merge functionality demonstrates the Snapshot pattern.
As discussed in Section 1.3, a snapshot is a view of a partial or entire system that can be discussed or contains relevant information.
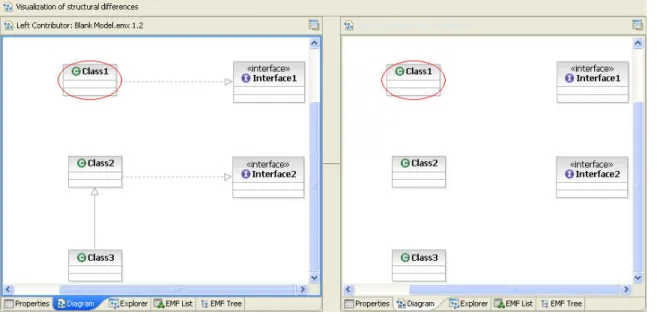
RSA can show snapshots while comparing two versions of a system. The snapshots can be at different levels of granularity. The compare-merge feature automatically generates snapshots. Compare-merge produces snapshots at very low levels of granularity, and groups them in higher-level snapshots. The low-level snapshots are not meaningful from a user’s perspective. For example, if we make an association between two classes, the snapshots shown are: 1) adding a reference in the source edges collection of the first class, 2) adding a reference in the target edge collection of the second class, 3) adding a reference in the edge collection of the diagram, and more, as shown in the tree figure. The higher-level snapshots groups all the snapshots related to the creation of the association. However, the user cannot have a customized-level of snapshots. The snapshots cannot be edited (added, merged or removed).
Snapshots could be part of a tree structure (shown in Figure 4) or visualized on side by side graphs (shown in Figures 5, 6, 7).
Tree:
Figure 4 - RSA model compare tree view
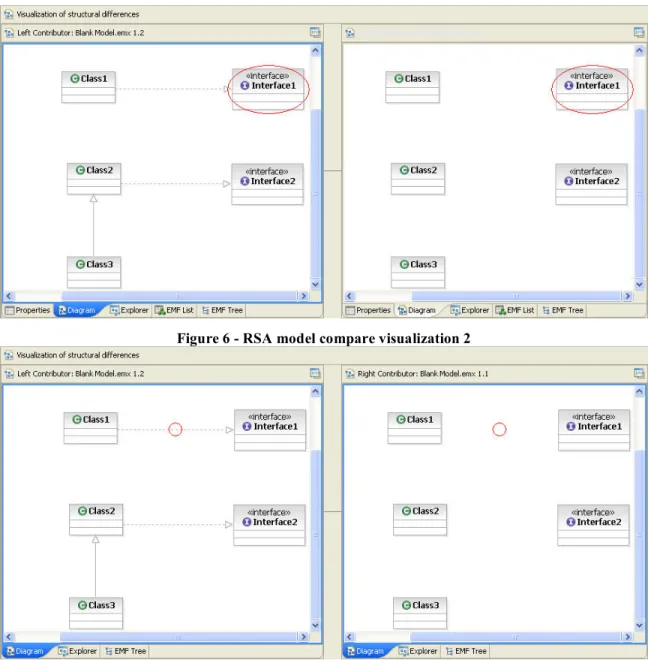
At the higher level of granularity, only Class1 and Class2 would be highlighted since the added relationships concerned them most. But if we extend the tree node related to adding the implementation relationship between Class1 and Interface1, we can visualize three different snapshots that highlight the process very well: Class1 is highlighted (shown in Figure 5), Interface1 is highlighted (shown in Figure 6), and the link is highlighted (shown in Figure 7).
Figure 6 - RSA model compare visualization 2
Figure 7 - RSA model compare visualization 3
The previous series of snapshots create a long-view (as discussed in Section 1.3, the Long View pattern is similar to telling a story) that can show the evolution of the system over time. While a snapshot consists of only 1 diagram, the long-view consists of
Extent to which the above solves the fundamental problem we are addressing
This second class of solutions, the ability to look at points in the history of a solution’s development and compare such points, partially solves most sub-problems presented in Section 1.4.
The understander is able to see simpler versions of the model, and is also able to obtain some appreciation of the decision making process that went into the design, by observing the changes that were made. However, such solutions are somewhat awkward – the user has to explicitly load earlier versions and run compare-merge operations. Also the granularity of the deltas (differences between two versions) tends to be large (versions are normally saved only after a complete problem is solved) and unpredictable (people may do a large amount of work before saving a newer version).
2.2.3 Annotations, temporal annotations and design rationale
documenting
The third class of solutions is facilities that allow you to add annotations. Annotations (often called ‘comments’ or ‘notes’) relate to the Meaning pattern discussed in Section 1.3. Such facilities are available in word processors, spreadsheets, CAD tools and software modeling tools. The modeler adds annotations to explain details that would not otherwise be obvious. Annotations can often help the understander make sense of some complex aspect of the model. However, UML notes should be added to a diagram in moderate numbers, since too many notes would complicate the diagram and hide its main design. Notes should be attached to existing elements only, if an element is deleted at a given stage in time, its note would not make much sense afterwards.
Annotations are also available in versioning systems (solution class 2.2.2 above). For example, when saving a version of an artifact in a tool like CVS, the saver will be prompted to document the reason for the change. (The reason might be automatically
documented if the change is tied to a bug-tracking system). We call this type of annotation ‘temporal annotations’ since they document why something is being done at a particular point in time. Temporal annotations are particularly useful for helping people to understand the rationale for a particular change. In fact, there are tools explicitly designed to document the rationale for decisions.
Hipikat [10] can save artifacts (change tasks, source file versions, messages posted on developer forums, and other project documents) during a project’s development history. It can then recommend which artifacts are useful to complete a particular task. Depending on the type of artifact, it could contain design rationale or general information to help a developer better understand how to solve the task.
RSA and BTA support the following solutions related to annotations, allowing people to learn aspects of the rationale behind design decisions and alternatives.
UML diagrams support adding explanatory notes (shown in Figure 8) that give the user more information about the system (also available in BTA).
Figure 8 – RSA UML note attached to a class
Borland also presents additional features with its StarTeam product (RSA could support similar repository features using ClearCase [18]): we were required to set up the Borland StartTeam Server 2005 Release 2 [8] to enable the project sharing functionality.
Sharing a project using StartTeam gives the user more intuitive features allowing him to input more rationale when making changes as shown in Figure 9 below.
The change request form allows the user to input all the details related to a change: status, priority, type, severity, platform, external references, component, category, synopsis, responsibility, description, solution, attachments, and comments.
Figure 10 - StarTeam change request form, solution tab
The solution tab shown in Figure 10 separates the types of solutions used to provide the user a better understanding of the context of the solution: work around or fix.
Extent to which the above solves the fundamental problem we are addressing
This class of solutions, annotations, and particularly temporal annotations, can work in conjunction with the other two classes of solutions to provide understanders with considerable guidance. However, the granularity of temporal annotations made in conjunction with a configuration management or version management system is dependent on the granularity with which versions are saved. An alternative, using a rationale-tracking tool [19] to explicitly document all design decisions is so cumbersome that such tools are rarely used in practice.
2.2.4 Fine-grained change tracking
A fourth approach is change tracking. In most word processors, and many other software tools, it is possible to track changes applied to a document by multiple authors. The understander therefore can glean information by looking at the types of information contributed by different people.
Extent to which the above solves the fundamental problem we are addressing
This approach does not solve the overall problem, but contributes to the solution to a limited degree.
2.2.5 Persistent undo stacks
or saves a model. However, some tools have implemented persistent undo such that on reloading of a model, recent changes can be undone, perhaps all the way back to the beginning. This could be used by an understander trying to understand a model and forms the basis of a key aspect of this invention.
Extent to which the above solves the fundamental problem we are addressing
Persistent undo stacks have some potential to help with the understanding process, in that the understander could undo all changes and then replay them one by one. This has several drawbacks, including: 1) if a user undoes many changes and then starts editing, or saves the model, all subsequent undo/redo states would be lost; 2) the granularity of the undo stack is too fine; 3) persistent undo does not incorporate temporal annotations.
2.3 Support for other Temporal Details patterns
Rational Software Architect and Borland Together Architect also contain features related to temporal details patterns that were not discussed in the previous section. The analysis of these features helped us get better ideas for product new features as discussed in Section 3.
2.3.1 Rational Software Architect (RSA) 6.0
In the following, we will show how RSA to a certain extent supports the cognitive patterns, particularly Temporal Details. We will start by stating the pattern’s name followed by explanations and screenshots from the tool:
Quick Start
The Quick Start pattern points out that people need a quick way to start a new task.
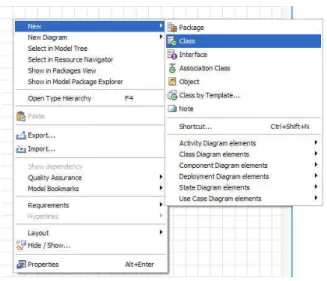
1. If the user holds the cursor still for a few seconds, a simple menu appears with alternatives to start building the system including classes and interfaces (shown in Figure 11 below).
Figure 11 - RSA diagram elements popup menu
2. The user can choose from the items located on the palette (shown in Figure 12) by clicking on one item then clicking on the location in the diagram where he wants to place it.
Figure 12 - RSA palette for class diagrams
3. Other alternatives include right-clicking on the blank diagram and selecting an option to add elements from the pop-up menu shown in Figure 13 below.
Figure 13 - RSA popup menu for class diagrams
If the user imported a project that already contained existing models, he has the option to drag and drop an element from the “Model Explorer” (shown in Figure 14) onto a diagram.
Figure 14 - RSA model explorer view
If the user is trying to understand a complex system, he can search a model for basic elements (Baseline Landmarks pattern) including a main method or a diagram to refer to his startup point. Double-clicking on the search results (shown in Figure 15 below) would open the diagram.
Figure 15 - RSA find and replace view
Multiple approaches
The following features are supported by Eclipse, hence they are available both in RSA and BTA.
CVS features allow a user multiple approaches for building the system: e.g. an evaluation version and a complete version.
a. The CVS features offered in Eclipse allow the user to tag multiple file versions and to create different branches for files or projects. They can be accessed through the menu shown in Figure 16.
Figure 16 - Eclipse popup menu, team options
b. To exclude some features from the evaluation version of his software product, a user creates another branch in CVS containing the files for the evaluation version which will not be affected by further updates to the files. The user will have the option to merge the branch with the other versions of the system in the future. The user can also switch between the development of multiple branches and versions as shown in Figure 17 or compare them in the “CVS Resource History” (shown in Figure 18) that also contains embedded rationale for the changes.
Figure 17 - Eclipse CVS options
Figure 18 - Eclipse CVS Resource History view
2.3.2 Borland Together Architect (BTA) 2006 for Eclipse
The following are the features in Borland Together Architect 2006 related to cognitive patterns and particularly to the Temporal Details category. We will give each pattern’s name followed by how it is demonstrated in BTA:
Quick Start
After creating a new modeling project, a blank diagram is displayed and the user has the following quick start alternatives to start building a design:
1. Click on an item to be selected from the palette (shown in Figure 19) then click on the diagram location for it to be placed:
Figure 19 - BTA palette for class diagrams
2. Right-click on the empty diagram and choose an item from the context menu shown in Figure 20:
Figure 20 - BTA popup menu
3. If the user is working with an existing project, he could drag and drop existing model elements from the model navigator (shown in Figure 21) onto the diagram (given that they don’t already exist in the diagram)
Figure 21 – BTA Model navigator view
Snapshot
A snapshot is a view of a partial or entire system that can be discussed or contains relevant information.
The StartTeam environment allows a user to create and discuss a topic (as well as a change request, a requirement, or a task). Other users could reply to the topic forming a list of replies. Each topic or reply is a snapshot (related to the discussion, it’s not a snapshot related to the artifact being discussed) since they contain a collection of information that can be discussed in a fair amount of details. Figure 22 shows a topic and multiple replies under it.
Figure 22 - StarTeam Topic view
Figure 23 shows information related to the selected topic in the Figure 22. This group of information is a snapshot.
Figure 23 - StarTeam topic properties view
Long View
Figure 22 displays a series of snapshots forming a sub-tree having the first topic as the root. This sub-tree encapsulates the discussions on that topic from several users following a Long View pattern: a person would move from one snapshot to the other in order to fully understand the topic.
Figure 24 - StarTeam Audit view
2.4 Concluding remarks
We learned that the previous tools support Temporal Details to a certain extent. We note that the level of granularity supported by CVS is not fine grained. Submissions to CVS cannot be changed: once a version has been submitted, it is persisted as a version. A user cannot delete versions from CVS or edit the comment on a submission. CVS branching is a powerful feature for managing multiple approaches.
Snapshots are supported but their level of granularity cannot be customized and they cannot be edited (added, merged, or removed).
In the next chapter, we will describe new tool features that address the above limitations.
Chapter 3: On generating new features
A major objective of the earlier research into cognitive patterns [1, 10, 12, 13] was that they should lead to ideas for better software engineering tool features – in particular, features that would better correspond to the way people think and work. This chapter describes the process we used to develop and refine a list of new features for RSx based on cognitive patterns.
The first step in our approach was to use existing UML tools extensively, in particular Rational Software Architect 6.0 and Borland Together Architect 2006, thinking about the features they provide from a cognitive patterns perspective. In addition, we attended one usability study for RSA in order to gain more information about how users use it and try to generate a list of new ideas for improving their experience. The study was performed by the user-centered design team at the IBM Ottawa Lab. We watched an experienced RSA user participate in the study. The study took place in two separate rooms in order not to bother the user. We monitored the study from the other room using NetMeeting to see everything the user did on the screen and by telephone to listen to the conversation.
In the next section we will describe a list of potential prototype features that we generated. In Section 3.2, we discuss how we evaluated those features in order to choose the most appropriate idea to prototype. Section 3.3 presents the three main features we generated and the chosen feature to prototype.
3.1 Initial list of features
We generated a list of potential new features while using Rational Software Architect, Borland Together Architect and reviewing the papers about cognitive patterns [1, 10, 13]. Our ideas where based on incremental learning, understanding how the system works, and learning why the system was designed the way it has been.
Please note that the ‘Thinking Big’ pattern (i.e. a user needs to see the bigger picture in order to better understand how a part fits in the system) was removed from the Temporal Details category at a later stage in this research. However, we have decided to keep the feature related to this pattern in this list since it was evaluated at that time as being part of the Temporal Details group.
The following outlines each of the features that were generated.
3.1.1. Details equalizer
Currently in RSA: filtering is applied to one object in the diagram at a time. RSA “Browse” and “Topic” diagrams ignore the filtering specified in the original diagram. This feature would filter attributes and operations from all the objects in any diagram based on a defined level of detail (public, protected, private, package). This approach would enhance incremental learning by showing the big picture then giving more details. The user would use a series of sliders (visualized in Figure 25) to quickly set the level of details on different criteria. (Relates to: Quick Start)
Figure 25 - Details equalizer sketch
3.1.2. Elements filter
RSA supports other types of filtering including relationship-based filtering (generalization, dependency, realization…) that is very well implemented as part of the ‘Browse’ or ‘Topic’ visualization diagrams. Using the Elements filter feature, a user would be able to choose to see elements in the diagram according to specific criteria, before looking at the full diagram. The user would be able to quickly understand some concepts and have a base for further understanding. The criteria could include elements that have notes attached to them, or the filter could be based on the most central elements (e.g. most attributes, associations, inheritance). (Relates to: Quick Start)
3.1.3. Diagram slider
In this feature, a user could view the entire history of a diagram’s creation by using a slider control that would evolve the diagram from its initial state to its final state (similar to telling a story). This was part of the Temporal Model Explorer (TME) feature eventually chosen to implement. (Relates to: Quick Start, Long View)
3.1.4. Diagram version slider
This feature builds up on the previous one. Instead of having a very detailed slider, the user could specify at which points to tag a version of the diagram. Future users would review all the previous versions leading to the final diagram (an alternative would be to have multiple tabs allowing the user to randomly jump between versions). Aspects of this, i.e. the use of snapshots, are also found in the TME feature. (Relates to: Quick Start, Long View, Snapshot)
3.1.5. Package outline
The icon of a Java package should have the ability to show the classes and interfaces or other resources that belongs to it. This would show the big picture of the system to the user and might reduce search time by allowing increased visibility in the details of the system. However, if a package contains too many elements, an icon view would show limited details because of the space limitations. (Relates to: Thinking Big)
3.1.6. Easy access to versions of a diagram
Currently in RSA, if a user wants to see different versions of a diagram, he has to open the “CVS Resource History” view and double click on each version which will open the model followed by the diagram. By the time three different versions are displayed, the editor tabs are overwhelmed and it becomes confusing to switch between versions.
3.1.7. Search for feature
A user should have the option to view all areas related to a feature. This requires defining what parts of the software relate to the feature in the first place. This could save time when searching for textual matches or references that relate to the feature. An example of using this feature would be to search for all the places in the code or diagrams that relate to ‘printing’. (Relates to: Quick Start)
3.1.8. Explanation diagrams
This feature would provide a new type of diagram that would contain explanations and links to diagrams or code. This feature could guide the user where to start in understanding a problem. It lets the user go through the diagram step by step (e.g. tabs) or view it all (e.g. tree) to understand a concept while looking at other diagrams at the same time. The creator of a model could mark starting points for understanding each diagram.
One can argue that the user can achieve this with any diagram including notes but the advantage here would be the tree or tab view that allows the user to see all the steps in a compact way and go through them. (Relates to: Quick Start, Meaning)
3.1.9. Features list
This feature would list the features in the system with links to the diagrams where they are implemented.
A new user has no idea of a system he never saw before, he needs a starting point. Instead of looking at various diagrams and trying to figure out what they are for, a view could show a features list that contains multiple main features of the system with links to related diagrams that could serve as a starting point for understanding the feature or the system.
Each feature could include a sequence of diagrams to visit with some meaning of each diagram to the feature. (Relates to: Quick Start, Meaning).
3.1.10. Alternative diagrams display
Currently in RSA, if a user wanted to develop an alternative approach for a design shown in a particular diagram, he needs to create a new diagram, build the other approach into the new diagram and insert a link in the original diagram with a note informing the user of an alternative design.
We’re proposing to have an icon in the original diagram which would represent the availability of an alternative design. When the user clicks on that icon, the window containing the original diagram would be divided in half and the two approaches would be displayed side-by-side in the split window. This will allow the user to examine the differences between the two approaches more effectively. (Relates to: Multiple Approaches)
3.1.11. Part swapping
Part swapping involves switching between design alternatives inside the same diagram. A user could select parts of a diagram and specify alternative files containing alternative design for the selected parts. An icon would specify that an alternative design exists and with a button click on that icon, the user would swap design alternatives in the diagram. (Relates to: Multiple Approaches)
3.1.12. Annotations
Annotations would highlight the reasons behind changes. Annotations could be included in the “Compare with local history” feature within Eclipse. This existing Eclipse feature saves a copy of the file that the user is working with each time the user saves the file in order to track versions of the file over time. Our feature would involve adding optional annotations to each point in time where a file version exists to explain the reason for a change.
3.1.13. Version player
This feature would show the user different versions of a file or diagram in sequence. This could help the user understand how the file contents evolved.
Currently, the user could open all the versions of a diagram but it would result in too many editors and can become confusing. It would be useful if the user could see a sequence of diagrams, each one lasting for a specific time interval then move to the next. This could be done by selecting many versions in the “CVS Resource History” view and having a ‘play’ option. The version currently showing will be highlighted in the view so that the user can see the highlighted comment (entered when the user submits an update to the CVS repository). Aspects of this appeared eventually in TME. (Relates to:
Snapshot, Long View, Multiple Approaches)
3.1.14. Diagram compare
When comparing diagrams in the RSA compare-merge view, highlight all the changes at the same time (currently not working), and have the option to see the change description (e.g. “added generalization class1-class2”) right on the diagram instead of having it as a separate tree (Figure 4), this would save the user having to click the item each time and switch to the diagram view. (Relates to: Snapshot, Meaning)
3.1.15. Save compare
Add the capability to save a compare-merge view (Figures 5, 6, 7) as one diagram to which the user can add notes explaining some changes. Currently, the user can compare two versions of a diagram side by side with highlighted changes but he cannot save that comparison. (Relates to: Snapshot, Multiple Approaches)
3.2 Evaluating and grouping the features
We held meetings with five senior IBM product managers and developers to evaluate the value of each of the ideas in our list. Product managers were closely linked to customers and they took in consideration the importance of a feature to the customers when evaluating its value. We did not question customers directly for confidentiality
purposes, this evaluation was restricted to IBM but in a way that ensured taking into consideration what the users of this tool desired.
3.2.1 Participants feedback
We interviewed participants with different qualifications: software developers, team managers, product managers and members from the IBM Centers for Advanced Studies (CAS) in Ottawa. We wanted to gather feedback from different points of views and capture a general perspective of what feature is mostly desired.
Participant 1
IBM Software Group, Rational
Model Driven Development Product Management
The discussion was brief, about 20 minutes. The participant knew RSA very well and quickly judged if a feature was beneficial for the overall product or not. He was able to point out the developer who would be the appropriate contact for every feature. I was able to hold meetings with these contacts to obtain better feedback on all the features.
Participant 2
IBM Software Group, Rational
IBM Ottawa Center for Advanced Studies
This participant gave us feedback on all the features, the meeting lasted about 40 minutes. His perspective focused on how to make the tool communicate the design between developers effectively. His judgment was also affected by how often or how likely the users are to use the feature. He gave us the following comments and suggestions:
• The search for a feature (3.1.7) would not be very effective because people will
not trust it since some areas might be forgotten to be marked.
• Add a diagram player feature that records the order in which objects were
created.
• Finally, he had doubts that the save compare annotations (3.1.14) would be used
frequently.
Participant 3
IBM Software Group, Rational Rational Modeling Platform Lead
The meeting lasted for about one hour. We discussed in depth the features related to understanding change in the compare-merge area. Prototyping opportunities were clear in that area. The following were some of his comments on the proposed features:
• The diagram player feature (3.1.3) could encounter limitations regarding
maintaining the size of the history files but it could also be very instructive.
• The diagram version slider (3.1.4) could be improved by allowing the user to
designate diagram snapshots (this was implemented in our prototype) and assigning them specific names.
• The search for feature (3.1.7) would be a great idea if users use it well: this
required a user to link what he is currently working on to a feature of the system. If the user forgot to make a link to a feature any time he worked on something new, the search for feature would not return complete results.
• He suggested that a feature other than explanation diagrams (3.1.8) could be the
use of hyperlinks (similar to the TODO concept: in Eclipse, while writing source code, a developer can add a comment using ‘//TODO’. This will automatically place his comment in a separate Eclipse view called ‘Tasks’. This feature helps the developer track all his remaining tasks in all the files in his development environments.).
• The feature list (3.1.9) was an improved way of reverse engineering the
• Alternative diagrams display could be useful in the markup and review: The user
could look at different alternatives and choose the main one.
• The diagram compare feature (3.1.14) could have one model (instead of two
side-by-side displays) with add/change/delete annotations. When a user hovers over an annotation with the cursor, a tool tip could be displayed containing more information about the change.
• Saving the compare merge view was a feature taken into consideration by the
team for future development; it takes a lot of time.
Participant 4
IBM Software Group, Rational Senior Software Developer, Architect
This participant was related to the field of semantic concern: how to distinguish (e.g. using different colors) parts of the diagram based on some concerns. He was particularly interested in the first two filtering features (3.1.1 and 3.1.2) for browse and topic diagrams and suggested to merge them into one feature. He mentioned that the diagram player (3.1.3) is more of a demo feature and that it would have more value if the user could explain or add explanations later to playback (this was implemented in our prototype).
Participant 5
IBM Software Group, Rational Aurora Shapes Management
This participant is involved in the field of visualization and diagram representation and filtering. He had the following comments:
• Modify to the second suggestion (3.1.2) by linking it to a query. The challenge
would be the way it is presented to the user. However, something was already being done in that area.
• The diagram slider (3.1.3) was cool but he questioned how useful it would be. • The search for feature (3.1.7) has something similar already available: Rational
RequisitePro is a requirements management tool that facilitates the communication of project goals between a group of people. It provides detailed traceability to show how requirements may be affected by changes [17].
• For part swapping (3.1.11), how would we handle printing hidden sections? • The model annotation (3.1.12) was very interesting, an idea would be
commenting as well (MS Word example: users could choose text and include a comment that would appear on the side of the screen for other users to read and possibly reply to).
• The diagram player (3.1.13) would have scalability issues.
• An alternative to the save compare screen (3.1.15) feature: a user could take a
snapshot by a third-party program, annotate it then save it as an image.
3.2.2 Feature scores
Table 1 shows the features and their evaluation scores given by the different participants indicated as P1, P2, P3, P4, and P5. We asked each participant to rank each feature between 1 and 3: 1 meant that the feature was needed and 3 meant that this feature was not required.
ID Feature Weight 1 Details equalizer
2 Elements filter 3 Diagram slider
4 Diagram version slider 5 Package outline
6 Easy access to versions 7 Search for feature 8 Explanation diagram 9 Feature list
10 Alternative diagrams display 11 Part swapping 12 Annotations 13 Version player 14 Diagram compare 15 Save compare P1 P2 P3 P4 P5 Avg 1 1 1 1 2 1.2 2 3 2 1 3 2.2 1 2 2 2 3 2 2 2 2 2 2 2 3 2 3 3 2 2.6 3 2 1 2 2 2 1 3 1 1 1 1.4 2 2 2 2 2 2 3 2 1 2 1 1.8 3 2 2 3 3 2.6 3 2 3 3 2 2.6 2 3 1 2 1 1.8 2 3 3 2 3 2.6 3 2 1 2 2 2 1 3 1 3 3 2.2
Table 1 - Prototype features' weights
Participants were asked about the features in the same order but each time they were asked to rank each feature independently from the others. This was necessary because each team manager might rank the features depending on whether they were related to his work or not, and we wanted to get feedback independent of that to gain a better idea of the overall importance of each feature.
The package outline (3.1.5), alternatives diagram displays (3.1.11), part swapping (3.1.12), and version player (3.3.13) features averaged a score of 2.6. They were considered as possible future enhancements. There was a lack of interest in implementing
[inc] Allows incremental understanding on static system by managing views [dev] Shows system evolution dynamically
[enh] Facilitates and enhances existing usability/new feature
ID Feature
[inc] Details equalizer [inc] Elements filter [dev] Diagram slider
[dev] Diagram version slider [enh] Easy access to versions [inc] Search for feature [inc] Explanation diagram [inc] Feature list
[enh] Annotations [enh] Diagram compare [enh] Save compare
Table 2 - Prototype features' categorization
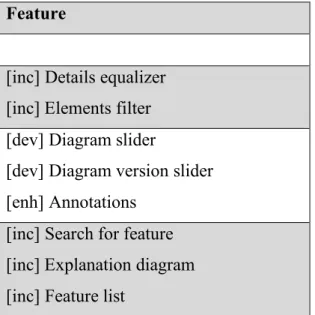
We removed most of the features related to enhancements and merged similar features in order to group them in one common feature. Table 3 shows how the remaining features were grouped:
Feature
[inc] Details equalizer [inc] Elements filter [dev] Diagram slider
[dev] Diagram version slider [enh] Annotations
[inc] Search for feature [inc] Explanation diagram [inc] Feature list
Table 3 - Prototype features' grouping to create three new main features
Finally, we gave names to the three larger ‘main’ features resulting from this grouping: Diagram equalizer, Diagram player and Diagram guide. Table 4 shows these three features with the highest and lowest rankings that they received (highest and lowest rankings relate to the combined rankings of the features that were merged):
ID Feature Weight (max/min)
A) Diagram equalizer B) Diagram player C) Diagram guide P1 P2 P3 P4 P5 Avg 1/2 1/3 1/2 1/1 2/3 1.2/2.2 1/2 1/2 1/2 2/2 1/3 1.2/2.2 1/3 2/3 1/2 1/2 1/2 1.2/2.4
Table 4 - Main prototype features evaluation
![Figure 1 - EASEL change sets [11]](https://thumb-us.123doks.com/thumbv2/123dok_us/9583390.2444281/22.918.173.746.573.816/figure-easel-change-sets.webp)