Oligopolistic and Oligopsonistic Bilateral Electricity
Market Modeling Using Hierarchical Conjectural
Variation Equilibrium Method
Submitted in fulfillment of the requirement for the degree of
Doctor of Philosophy
by
Amir Hessam Alikhanzadeh
Brunel Institute of Power Systems (BIPS), Department of Electronic
and Computer Engineering
Brunel University
Abstract
An electricity market is very complex and different in its nature, when compared to other commodity markets. The introduction of competition and restructuring in global electricity markets brought more complexity and major changes in terms of governance, ownership and technical and market operations.
In a liberalized electricity market, all market participants are responsible for their own decisions; therefore, all the participants are trying to make profit by participating in electricity trading. There are different types of electricity market, and in this research a bilateral electricity market has been specifically considered.
This thesis not only contributes with regard to the reviewing UK electricity market as an example of a bilateral electricity market with more than 97% of long-term bilateral trading, but also proposes a dual aspect point of view with regard to the bilateral electricity market by splitting the generation and supply sides of the wholesale market. This research aims at maximizing the market participants’ profits and finds the equilibrium point of the bilateral market; hence, various methods such as equilibrium models have been reviewed with regard to management of the risks (e.g. technical and financial risks) of participating in the electricity market.
This research proposes a novel Conjectural Variation Equilibrium (CVE) model for bilateral electricity markets, to reduce the market participants’ exposure to risks and maximize the profits. Hence, generation companies’ behaviors and strategies in an imperfect bilateral market environment, oligopoly, have been investigated by applying the CVE method. By looking at the bilateral market from an alternative aspect, the supply companies’ behaviors in an oligopsony environment have also been taken into consideration.
At the final stage of this research, the ‘matching’ of both quantity and price between oligopolistic and oligopsonistic markets has been obtained through a novel-coordinating algorithm that includes CVE model iterations of both markets. Such matching can be achieved by adopting a hierarchical optimization approach, using the Matlab
Patternsearch optimization algorithm, which acts as a virtual broker to find the equilibrium point of both markets.
Index Terms-- Bilateral electricity market, Oligopolistic market, Oligopsonistic market, Conjectural Variation Equilibrium method, Patternsearch optimization, Game theory, Hierarchical optimization method
Declaration
I AmirHessam Alikhanzadeh declare that this research, its idea, analysis, findings, and conclusions that are included in this PhD thesis are entirely developed by me for the purpose of this program only and have not been submitted for another qualification.
Acknowledgements
The accomplishment of this investigation was only possible by the guidance, professional supervision, and encouragement that have been offered by my supervisors Prof. Malcolm Irving and Prof. Gareth Taylor. I am grateful for the devoted time, effort, constructive feedback, and thoughts and creativity provoking ideas you both have honored me.
I am thankful of academic members, administrative staff, and colleagues in Brunel Engineering and Design School for their support during my PhD program.
Finally, special thanks to my family and every person who loved to see the successful accomplishment and achievement of this work.
Table of Contents
Abstract ... ii
Declaration ... iv
Acknowledgements ... v
List of Figures ... xi
List of Tables ... xvi
List of Abbreviations ... xviii
Chapter 1: Introduction ... 1
1.1 Introduction ... 2
1.2 Significance of this Research ... 4
1.3 Scope of this Research ... 5
1.4 Aim and Objectives ... 6
1.5 Outline of this Research ... 7
1.6 Publications ... 9
Chapter 2: Literature Review ... 10
2.1 Introduction ... 11
2.2 Concept of Electricity Market ... 12
2.3 Models for Electricity Sector... 15
2.3.1 Monopoly ... 15
2.3.2 Purchasing Agency ... 15
2.3.3 Wholesale Competition Model ... 16
2.3.4 Retail Competition ... 17
2.4 Global Movements towards Market Restructuring ... 18
2.4.1 Nordic Countries ... 18 2.4.2 Continental Europe ... 19 2.4.3 New Zealand ... 20 2.4.4 Australia ... 20 2.4.5 United States ... 20 2.5 Great Britain ... 21
2.5.1.1 Competition at Generation Level ... 22
2.5.1.2 Competition at Transmission Level ... 22
2.5.1.3 Competition at Distribution Level ... 23
2.5.1.4 Competition among Suppliers ... 23
2.5.1.5 Electricity Pool General Structure ... 26
2.5.2 Appearance of NETA and BETTA ... 28
2.6 Concerns and Consequences of Market Deregulation ... 30
2.7 Electricity Market Modeling Trends ... 32
2.7.1 Top – Down Analysis ... 34
2.7.1.1 Computable General Equilibrium (CGE)... 34
2.7.2 Bottom – Up Analysis ... 34
2.7.2.1 Simulation Methods ... 35
2.7.2.1.1 Multi Agent Based Systems (MABS) ... 35
2.7.2.1.2 Fuzzy Cognitive Maps (FCM) ... 38
2.7.2.2 Optimization Methods ... 39
2.7.2.2.1 Exogenous Price ... 39
2.7.2.2.2 Demand-Price Function ... 40
2.7.2.3 Equilibrium Methods ... 41
2.7.2.3.1 Game Theory and Equilibrium Methods ... 42
2.8 Summary ... 44
Chapter 3: BETTA, Balancing Mechanism and Risk Management ... 45
3.1 Introduction ... 46
3.2 Motivations for Transformation from Pool to Bilateral Market ... 46
3.3 Stakeholders in Restructured Electricity Markets ... 47
3.4 Operation of BETTA ... 49
3.4.1 Long-term Bilateral Contracts ... 51
3.4.2 Power Exchange (PX) ... 52
3.4.2.1 Power Exchange Charges ... 53
3.4.3 Balancing Mechanism (BM) ... 54
3.4.3.1 Operation of Balancing Mechanism... 55
3.4.3.1.1 Gate Closure ... 56
3.4.3.1.3 Real Time Balancing ... 58
3.4.3.1.4 Bid and Offer Payment ... 59
3.4.3.1.5 Importance of Balancing Mechanism ... 60
3.4.4 Imbalanced Settlement (IS) ... 60
3.5 Comparing BETTA with other Major Electricity Markets ... 63
3.5.1 Operational Comparisons between Competitive Electricity Markets... 64
3.6 Risk Management ... 67
3.6.1 Why Risk?... 68
3.6.1.1 Impact of Restructuring on the Market Participation Risks ... 69
3.6.1.2 Impact of BETTA on the Market Participation’s Risks ... 71
3.6.2 Other Aspects of Risks in Electricity Markets... 74
3.6.2.1 Electricity Market Risks Associated with Renewable Obligations (ROs) 75 3.7 Summary ... 77
Chapter 4: Oligopolistic Electricity Market Modeling ... 78
4.1 Introduction ... 79
4.2 Perfect Competition ... 80
4.3 Market Power in Electricity Markets ... 81
4.3.1 Monopolistic Electricity Market ... 83
4.3.2 Oligopolistic Electricity Markets ... 83
4.3.3 Market Power Measurement Techniques ... 86
4.3.3.1 Price-Cost Margin Index ... 87
4.3.3.2 Herfindhal-Hirschen Index (HHI) ... 87
4.3.3.3 Simulation Analysis ... 88 4.3.3.4 Equilibrium Methods ... 89 4.3.3.4.1 Collusion ... 91 4.3.3.4.2 Bertrand Model ... 92 4.3.3.4.3 Cournot Model ... 93 4.3.3.4.4 Stackelberg Model ... 94
4.3.3.4.5 Supply Function Equilibrium (SFE) Model ... 95
4.4 Conjectural Variation Equilibrium (CVE) Model ... 95
4.5 Oligopolistic Electricity Market Modeling Using CVE ... 97
4.5.2 CVE Applications and Formulations in an Oligopolistic Electricity Market . 99
4.6 Oligopolistic Electricity Market Case Study ... 106
4.6.1 Impact of Inverse Demand Curve Slope and Intercept on Oligopolistic Electricity Market ... 108
4.7 Market Power in UK ... 116
4.8 Summary ... 118
Chapter 5: Oligopsonistic Electricity Market Modeling ... 119
5.1 Introduction ... 120
5.2 Oligopsonistic Electricity Market Modeling Using CVE ... 120
5.2.1 Supply Companies’ Behaviors in a Bilateral Electricity Market ... 121
5.2.2 CVE Applications and Formulations in an Oligopsonistic Electricity Market ... 123
5.3 Conjectural Variations Specifications in Oligopolistic and Oligopsonistic Electricity Markets ... 130
5.3.1 GenCos’ Conjectural Variations Boundaries ... 131
5.3.2 SupplyCos’ Conjectural Variations Boundaries ... 133
5.4 Oligopsonistic Electricity Market Case Study ... 134
5.4.1 Impact of Inverse Generation Curve Slope and Intercept on Oligopsonistic Electricity Market ... 136
5.4.2 Impact of Retail Price on Oligopsonistic Electricity Market ... 144
5.5 Impact of and on Oligopolistic and Oligopsonistic Electricity Markets ... 145
5.5.1 and Oligopolistic Electricity Market ... 145
5.5.2 and Oligopsonistic Electricity Market ... 151
5.6 Oligopsony in UK Electricity Market ... 156
5.7 Summary ... 157
Chapter 6: Hierarchical Co-ordination Algorithm ... 158
6.1 Introduction ... 159
6.2 Market Equilibrium ... 159
6.3 Co-ordination between Oligopolistic and Oligopsonistic Electricity Markets.... 161
6.3.1 Role of Oligopolistic Electricity Market in Co-ordination Algorithm ... 162
6.4 Hierarchical Optimization Algorithm ... 166
6.4.1 Hierarchical Algorithm Optimizer ... 168
6.5 Hierarchical Optimization Algorithm Case Study ... 170
6.6 Summary ... 177
Chapter 7: Conclusions and Future Works ... 178
7.1 Introduction ... 179
7.2 Achievements and Contributions ... 179
7.3 Directions for Future Works ... 183
References ... 184 Appendix A ... 195 Appendix B ... 197 Appendix C ... 202 Appendix D ... 204 Appendix E ... 210 Appendix F ... 218
List of Figures
Figure 1.1: Liberalized Electricity Market Components... 2
Figure 1.2: Bilateral Long-Term Trading Share ... 3
Figure 1.3: Electricity Market Functionalities ... 5
Figure 1.4: Scope of this Research ... 6
Figure 2.1: Monopoly of Electricity Market ... 13
Figure 2.2: Restructuring Dimensions and Possibilities ... 14
Figure 2.3: Purchasing Agency Model of Electricity Market ... 15
Figure 2.4: Wholesale Competition Model ... 16
Figure 2.5: Retail Competition Model ... 17
Figure 2.6: Privatized UK Electricity Industry Structure ... 25
Figure 2.7: Overview of Pool’s Procedures ... 26
Figure 2.8: Electricity Pool Market Merit Order Ranking ... 26
Figure 2.9: Including Wholesale and Retail Markets ... 29
Figure 2.10: Overview of Different Electricity Market Modeling Approaches Investigated in this Research... 33
Figure 2.11: Layered Structure of an Agent... 37
Figure 2.12: Differences between Optimization Model and Equilibrium Model ... 41
Figure 3.1: A Competitive Electricity Market Structure ... 49
Figure 3.2: Time Line of BETTA Operations ... 50
Figure 3.4: Typical GenCo’ and Demand’ FPNs, Left FPN for a GenCo, Right FPN for
a Demand ... 57
Figure 3.5: A Typical Bid – Offer Pair for a GenCo ... 58
Figure 3.6: Acceptance of Bid – Offer Pair of a Generator Unit ... 59
Figure 3.7: SO’s Real Time Balancing ... 59
Figure 3.8: BETTA Structure by Volume ... 60
Figure 3.9: Imbalanced Settlement Exposure, (a) Spills are paid at SSP, (b) Shorts must be paid at SBP ... 62
Figure 3.10: Overview of Settlement Process ... 63
Figure 3.11: General Framework of Electricity Market... 66
Figure 3.12: Categorized Comparisons between Different Market Structures ... 66
Figure 3.13: BSC’s Actions in BETTA ... 69
Figure 3.14: SupplyCo in a Restructured Market ... 70
Figure 3.15: Price Volatility in BETTA ... 72
Figure 3.16: Imbalance arising from variable generation ... 73
Figure 3.17: Imbalance arising from unexpected generation failure on 25MW capacity ... 74
Figure 3.18: Three Main Future Electricity Markets Pillars ... 76
Figure 4.1: Oligopolistic Electricity Market Boundary ... 84
Figure 4.2:Overview of Market Power Unique Structure Measurement Tools ... 90
Figure 4.3:The Relationship between Price of Electricity and the Quantity of Demand 98 Figure 4.4: Initial Inverse Demand Curve... 104
Figure 4.6: Impact of Inverse Demand Curve Slope on GenCo1 Output ( =1000) .. 110
Figure 4.7: Impact of Inverse Demand Curve Slope on GenCo1 Output ( =800) .... 111
Figure 4.8: Impact of Inverse Demand Curve Slope on GenCo1 Output ( =600) .... 112
Figure 4.9: Impact of Inverse Demand Curve Slope on GenCo1 Output ( =400) .... 113
Figure 4.10: Impact of Inverse Demand Curve Slope on GenCo1 Output ( =200) .. 113
Figure 4.11: Impact of Inverse Demand Curve Slope on Total Output ( =1500) ... 114
Figure 4.12: Impact of Inverse Demand Curve Intercept on GenCo1 Output ( =70 ) 115 Figure 4.13: Impact of Inverse Demand Curve Intercept on Selling Price ( =70 ) ... 115
Figure 4.14: The Share of Six Large GenCos in the UK ... 116
Figure 4.15: Share of Dominant GenCos in UK: (a) 2006; (b) 2011 ... 117
Figure 5.1: Oligopsonistic Electricity Market Boundary ... 121
Figure 5.2: Inverse Generation Curve ... 122
Figure 5.3: Initial Inverse Generation Curve ... 126
Figure 5.4: Impact of Inverse Generation Curve Slope on SupplyCo1 Purchased Value ( =5) ... 137
Figure 5.5: Impact of Inverse Generation Curve Slope on SupplyCo1 Purchased Value ( =10) ... 138
Figure 5.6: Impact of Inverse Generation Curve Slope on SupplyCo1 Purchased Value ( =50) ... 139
Figure 5.7: Impact of Inverse Generation Curve Slope on SupplyCo1 Purchased Value ( =80) ... 140
Figure 5.8: Impact of Inverse Generation Curve Slope on SupplyCo1 Purchased Value ( =100) ... 141
Figure 5.9: Impact of Inverse Generation Curve Slope on SupplyCo1 Purchased Value
( =120) ... 142
Figure 5.10: Impact of Inverse Generation Curve Slope on Total Purchased Electricity Value ( =5) ... 142
Figure 5.11: Impact of Inverse Generation Curve Intercept on SupplyCo1 (Slope=30 ) ... 143
Figure 5.12: Impact of Inverse Generation Curve Intercept on Buying Price (Slope=30 ) ... 143
Figure 5.13: Impact of Retail Price on SupplyCo1 (Intercept=50, Slope=30 ) ... 144
Figure 5.14: Impact of Retail Price on Buying Price (Intercept=50, Slope=30 ) ... 145
Figure 5.15: Impact of on GenCo1 Output ... 148
Figure 5.16: Impact of on GenCo2 Output ... 149
Figure 5.17: Impact of on GenCo3 Output ... 149
Figure 5.18: Impact of on Total Output ... 150
Figure 5.19: Impact of on Selling Price ... 150
Figure 5.20: Impact of on SupplyCo1 ... 154
Figure 5.21: Impact of on SupplyCo2 ... 154
Figure 5.22: Impact of on SupplyCo3 ... 155
Figure 5.23: Impact of on Total Purchased Value ... 155
Figure 5.24: Impact of on Buying Price ... 156
Figure 6.1: Market Equilibrium ... 160
Figure 6.2: Stability of the Market Equilibrium ... 161
Figure 6.4: Hierarchical Optimization Algorithm ... 167
Figure 6.5: Hierarchical Optimization Structure ... 168
Figure 6.6: Patternsearch Exploratory Moves ... 170
Figure 6.7: Best Points for Intercepts and Slopes of Inverse Demand and Generation Curves ... 172
Figure 6.8: Objective Function Value ... 173
Figure 6.9: Patternseach Mesh Size Value ... 174
List of Tables
Table 2.1: Domestic Market Share of Local REC (June 2000) ... 24 Table 3.1: Overview of World’s Most Established Power Markets Compared With
BETTA... 65 Table 4.1: Oligopolistic Electricity Market Case Study ... 106 Table 4.2 (a): Impacts of Inverse Demand Curve intercept and Slope on GenCos in
Oligopolistic Market ( =1500) ... 108 Table 4.2 (b): Impacts of Inverse Demand Curve intercept and Slope on GenCos in
Oligopolistic Market ( =1000) ... 109 Table 4.2 (c): Impacts of Inverse Demand Curve intercept and Slope on GenCos in
Oligopolistic Market ( =800) ... 110 Table 4.2 (d): Impacts of Inverse Demand Curve intercept and Slope on GenCos in
Oligopolistic Market ( =600) ... 111 Table 4.2 (e): Impacts of Inverse Demand Curve intercept and Slope on GenCos in
Oligopolistic Market ( =400) ... 112 Table 4.2 (f): Impacts of Inverse Demand Curve intercept and Slope on GenCos in
Oligopolistic Market ( =200) ... 113 Table 5.1: Oligopsonistic Electricity Market Case Study ... 135 Table 5.2 (a) Impacts of Inverse Generation Curve Intercept and Slopes on SupplyCos in Oligopsonistic Market ( =5) ... 136 Table 5.2 (b) Impacts of Inverse Generation Curve Intercept and Slopes on SupplyCos
in Oligopsonistic Market ( =10) ... 137 Table 5.2 (c) Impacts of Inverse Generation Curve Intercept and Slopes on SupplyCos in Oligopsonistic Market ( =50) ... 138
Table 5.2 (d) Impacts of Inverse Generation Curve Intercept and Slopes on SupplyCos
in Oligopsonistic Market ( =80) ... 139
Table 5.2 (e) Impacts of Inverse Generation Curve Intercept and Slopes on SupplyCos in Oligopsonistic Market ( 100) ... 140
Table 5.2 (f) Impacts of Inverse Generation Curve Intercept and Slopes on SupplyCos in Oligopsonistic Market ( =120) ... 141
Table 5.3: Retail Price Impacts on Oligopolistic electricity Market ... 144
Table 5.4: Impacts of on GenCos’ Strategies ... 146
Table 5.5: Impacts of on GenCos’ Strategies ... 146
Table 5.6: Impacts of on GenCos’ Strategies ... 147
Table 5.7: Impacts of on SupplyCos’ Strategies ... 152
Table 5.8: Impacts of on SupplyCos’ Strategies ... 152
Table 5.9: Impacts of on SupplyCos’ Strategies ... 153
Table 6.1: Oligopolistic Market Participants’ Parameters ... 171
Table 6.2: Oligopsonistic Market Participants’ Parameters ... 171
Table 6.3: Intercepts and Slopes Values for Both Sides of the Market ... 172
Table 6.4:Market Equilibrium Point ... 175
Table 6.5: GenCos’ Market Share ... 175
Table 6.6: SupplyCos’ Market Share ... 175
Table 6.7: GenCos’ Profits ... 176
List of Abbreviations
ABM Agent – Based Model
ATC Available Transfer Capabilities
BM Balancing Mechanism
BMU Balancing Mechanism Unit
BSC Balancing and Settlement codes
CALISO California Independent System Operators
CGE Computable General Equilibrium
CV Conjectural Variation
CVE Conjectural Variation Equilibrium
EC European Council
EU European Union
ETSO European Transmission Operators
ENTSO-E European Network of Transmission Systems Operators for Electricity
EMCAS Electricity Market Complex Adaptive Systems
ERCOT Electric Reliability Council of Texas
FCM Fuzzy Cognitive Maps
FIPA Foundations for Intelligent Physical Agents
FERC Federal Energy Regulation Committee
GA Genetic Algorithm
GPS Generalized Patternsearch
ISO Independent System Operators
ISO-NE Independent System Operators New England
IEM Internal Electricity Market
IPP Independent Power Producers
JADE Java Agent DEvelopment Framework
KKT Karush-Kuhn-Tucker
LMP Local Marginal Pricing
MC Marginal Cost
MW Megawatt
MAS Multi Agent System
MO Market Operator
MISO Midwest Independent System Operators
MABS Multi Agent Based Systems
NEM National Electricity Market
NEMMCO National Electricity Market Management Company
NYISO New York Independent System Operators
NG National Grid
NGC National Grid Company
OFGEM Office of Gas and Electricity Markets
OASIS Open Access Same-time Information System
OTC Over The Counter
PJM Pennsylvania-New Jersey-Maryland
RO Renewable Obligation
RTO Regional Transmission Organizations
REC Regional Electricity Companies
SAA SettlementAdministration Agent
SSP System Sell Price
SBP System Buying Price
SMP System Marginal Price
SO System Operator
SoS Security of Supply
SPP Southwest Power Pool
Supply Co Supply Company
TSO Transmission System Operators
TransCo Transmission Company
UK United Kingdom
1.1 Introduction
Electricity utility systems around the world continue to evolve from vertically integrated monopoly structure to a competitive environment market, which provides all the customers with the choice of services. The electricity markets liberalization combines the unbundling vertically integrated utilities, introduction of competition in the market and the limitation of central and governmental control.
Figure 1.1: Liberalized Electricity Market Components
For instance, the electricity market in UK has seen major changes since the Electricity Act in 1989, which introduced a competitive environment and began the privatization in all sections of the market [1] in order to bring transparency and liquidity into electricity trading. These changes resulted in the electricity Pool; afterwards the New Electricity Trading Arrangement (NETA) appeared in 2001, which included England and Wales and was a bilateral electricity market. In 2005 NETA reformed into British Electricity Trading and Transmission Arrangement (BETTA) covering England, Wales and Scotland [2]. In such a market structure, as it will be investigated in details in Chapter 3, most of the energy trading are long-term bilateral contracts (Figure 1.2) and the general principles of these changes have been the unbundling of the market into separate areas of generation, transmission, distribution and supply.
Competition Limitation of central and governmental control Unbundling Vertically Intergrated Utilites
Figure 1.2: Bilateral Long-Term Trading Share
In bilateral electricity markets, each market participant has its own and unique business, aims, strategy, and technical and financial risks. Decentralizing decision-makers is one of the significant goals of restructured bilateral markets. The change from centralized to self-dispatched market created a wide range of challenges for all market participants to optimize their strategies in order to maintain or increase their profits and decreases their exposures to the risk, because of the time duration of the price volatility in spot and balancing markets; which seems challenging for all market participants.
The volatility exhibited by markets restructuring (e.g. UK electricity market evolutions), several market failures (e.g. California electricity market crisis) and different behaviors of restructured markets (e.g. various electricity market structures in different countries) have highlighted the need for a better understanding of market structure and its complexity.
Bilateral Electricity
Market
Other Spot and Balancing Markets Long-term bilateral tradingAdvance modeling approaches are needed to demonstrate the complication of this kind of market structure and model the behaviors of market participants over a period of time and show how they react to the economic, financial and technical changes in the power system. One of these approaches is Conjectural Variation Equilibrium (CVE) method, which brings robustness to the market modeling comparing to other applied approaches. This research investigates imperfect bilateral electricity market modeling based on equilibrium method for profit maximization on both sides of the market and finding equilibrium point of the market.
1.2 Significance of this Research
Electricity, and more generally the energy, has become a significant and key issue in developed and even developing countries around the world and plays an important role in forming their medium and long-term macro economical and financial strategies. Electricity has also an impact on economic environment. Restructuring can bring different policies in the electricity markets and change the objectives of market participants. Far from the advantages that these deregulations can bring to the electricity market and power system, there will also be some challenging environment and conditions for participants.
One of the key impacts of deregulation is increasing exposure to the risks. By the nature of power system and electricity market, certain risks exist, such as: operational and technical failures, demand variations, volatilities in price of fuel based on international policies (e.g. recent Middle East crisis). However, in a monopoly industry, which is regulated and vertically integrated, carrying different strategies like excessing capacity can easily cover all these risks. On the other hand deregulation do not only accentuate the inherent market risks but also brings additional risk sources like the complexity of market structure, lack of time, complex pricing procedure and etc. These risk resources can cause imperfect competition in the market.
Therefore, it is essential to consider both sides of the bilateral electricity market and consider the reactions and behaviors of market participants on both sides of the market in order to monitor the market power.
1.3 Scope of this Research
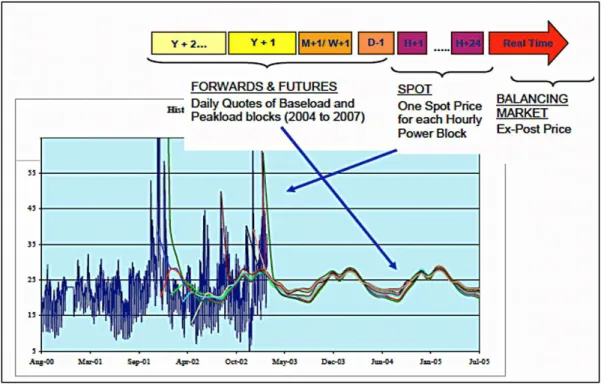
The current research covers bilateral electricity market modeling considering the impacts of long-term contracts on the equilibrium point of the market. According to Figure 1.3 the majority of electricity trading in the bilateral electricity markets are long-term contracts [2]; therefore their influences on the decision makers in the market should be taken into consideration. Figure 1.3 provides an overview about different functions of electricity market within the time period.
Figure 1.3: Electricity Market Functionalities
According to the figure above, long-term electricity market can bring profit maximization and also risk management. However, by considering only generation side of the market, achieving to a competitive and stable bilateral electricity market is impossible, since the impacts of demand side behaviors have not been considered. In such a market structure both generation and demand sides of the market should be considered and the impacts of each firm’s strategic decision on the equilibrium of the market need to be studied. The market participants should be modeled as decision makers that consider their rivals’ strategies base on any changes in their decisions. In this method all the firms can learn from their decisions and other market participants behaviors, simultaneously. Ne w M ar ke t Ne w M ar ke t F unc ti ons Traditional Market Operational Functions Functions New Market Functions - Risk Management - Profit Maximization - Long-term Contracts for
Selling and Purchasing Electricity
- Infrastructure Investments - Maintenance - Energy Management
- Future Market Bids - Budget Planning for Future Investments - Annual Reserves management - Fuel - Market Bids - Reserve - Ancillary Services - Economic Dispatch - Unit Commitment Issues: Start-up and Shut-down of
Thermal Units - Pumped Storage
Operations
After reviewing several approaches, equilibrium model will be applied in this research, and among different equilibrium models, Conjectural Variation Equilibrium method [2] has been selected based on its investigated specifications in Chapter 4.
According to Figure 1.4, both sides of the market have been considered in this research and since it is a double-sided environment, it is essential to consider the link between generation and supply sides and influences of these two edges on each other in an
imperfect environment. Therefore two market terms have been introduced: oligopolistic
electricity market and oligopsonistic electricity market. This research is observing these
two types of market individually and furthermore, by building and developing a novel algorithm, which looks at the common aspects of these two types of market, the equilibrium point of the whole bilateral market can be investigated.
Figure 1.4: Scope of this Research
1.4 Aim and Objectives
The principle aim of this research as mentioned in the scope of this research is modeling market participants’ behaviors in bilateral electricity market in order to find out the
Oligopolistic Electricity Market Long term Decisions Oligopsonistic Electricity Market The scope of this research Electricity Market
equilibrium point of the market, while all market participants are making profit. Hence, the followings would be the objectives of this research:
Detailed investigations on BETTA structure as a bilateral electricity market
example, in order to understand the market participants’ behaviors and clarify the necessity of considering both sides of the market.
Identifying different types of risks and uncertainties in bilateral electricity
market.
Detailed investigations on different electricity market modeling techniques. This
covers the following aspects:
Why is it required to model bilateral electricity markets?
Why has equilibrium modeling been chosen?
Why has the Conjectural Variation Equilibrium method been selected?
Considering imperfect competitions in generation side of the market, looking at
oligopolistic electricity market modeling.
Considering imperfect competitions in supply side of the market, looking at
oligopsonistic electricity market modeling.
Investigating the impacts of generation companies (GenCos) and supply
companies (SupplyCos) strategies on both sides of the market.
Calculating equilibrium point of the market considering both sub-markets, while
all market participants are making profit by taking part in electricity trading.
1.5 Outline of this Research
This section provided an overview of this research. The following chapters provide a more exhaustive picture of the relevant applications of the research.
Chapter 2 provides different concepts of electricity market and demonstrates how electricity market has been evolved from vertically integrated structure to a competitive and transparent environment. In order to clarify market revolutions toward deregulations, market structures in several countries have been investigated. One of these reviewed markets is UK electricity market. The appearance of electricity Pool structure has been reviewed and the reasons of transforming into bilateral electricity
market have been highlighted. Furthermore, different types of market modeling techniques have been investigated and Equilibrium method has been selected as a modeling approach based on its specifications.
In Chapter 3, the UK electricity market, BETTA, structure has been investigated in details as an example of bilateral market in order to clarify the importance of modeling bilateral electricity market. The reasons behind bilateral market modeling will be explained based on different facts such as price volatility in Balancing Mechanism (BM) and spot market; hence, the impacts of such a market structure on market participants’ behaviors and strategies will be presented.
Exercising market power in bilateral electricity market will be reviewed in Chapter 4, by investigating some concepts such as perfect competition and monopoly. It will be explained that in order to model bilateral electricity market, it is essential to split it into generation and supply sides. In Chapter 4, the imperfect competition in generation side will be studied and GenCos’ strategies in oligopolistic electricity market will be highlighted. In order to monitor market power, different techniques will be reviewed and equilibrium method, particularly Conjectural Variation Equilibrium (CVE) approach will be selected. A presented case study in this chapter, illustrates that the inverse demand curves parameters such as slope and intercept and also GenCo’s conjectures about their rivals’ have strong impacts on the market.
SupplyCos’ behaviors will be taken into consideration in chapter 5 by investigating and modeling oligopsonistic electricity market. In this chapter the boundaries of GenCos’ and SupplyCos’ conjectures will be studied and the impacts of inverse generation curve parameters and the retail price on SupplyCos’ strategies will be highlighted.
Chapter 6 looks at the bilateral electricity market at a higher level in order to find the equilibrium point of the market. The co-ordination between oligopolistic and oligopsonistic electricity markets will be highlighted and a novel hierarchical optimization algorithm will introduced By performing this algorithm the equilibrium point of the market can be calculated, in which all market participants are making profits and the proposed case study in this chapter can validate this algorithm.
1.6 Publications
A. H. Alikhanzadeh, M. Irving, G.A. Taylor, “Oligopolistic and Oligopsonistic Bilateral Electricity Market Modeling Using Hierarchical Conjectural Variation Equilibrium Methods,” European Transaction on Electrical Power, 2013, Submitted for Publication. A. H. Alikhanzadeh, M. Irving and G.A. Taylor, “Combined Oligopoly and Oligopsony
Bilateral Electricity Market Model Using CV Equilibria,”2012 IEEE Conference on
Power and Energy Society General meeting, San-Diego, California, USA.
A. H. Alikhanzadeh and M. Irving, “Bilateral Electricity Market Theory Based on
Conjectural Equilibria,” 2011 8th International Conference on the European Energy
Market (EEM), Zagreb, Croatia, pp. 99-104.
A. H. Alikhanzadeh, M. Irving and G.A. Taylor, “UK electricity market modeling using combined Conjectural Variation equilibrium method and hierarchical optimization
algorithm”, 2012 47th International Universities Power engineering Conference
(UPEC), London, UK.
A. H. Alikhanzadeh, M. Irving and G.A. Taylor, “Bilateral Electricity Market Model
using Conjectural Variation Equilibria and Hierarchical Optimization”, ”, 2011 46th
Chapter 2: Literature
Review
2.1 Introduction
Electricity market deregulation has changed the power industry from a centralized structure into a competitive market environment. Over the past two decades many changes have been made in the power industry in order to make a new economical structure. There are several commodity markets around the world, which almost have the same structure and mechanism. In all of them, supply should meet the demand and market equilibrium should be found; however, there are several factors that make the electricity market different and more complex compared to others such as:
Method of delivery (Generated electricity from one generator cannot be directed
to a specific costumer).
Date of delivery (Electricity demand should be met on real time basis).
Complex regulations (The existence of several governance regulations make the
market structure complex).
Transactions conditions (Complex market structure brings complication into
transaction conditions e.g. forward, future and option contracts).
Limitations on storage (Electricity can not be stored like other comedies in large
scale)
Governmental obligations (existence of several governmental and renewable
obligation bring complexity into the market).
Demand prediction (Unlike other comedies the demand profile predictions is
challenging).
Fast market operations (e.g. in the UK electricity market the System Operator
has got only 1 hour in order to match the generation and demand for each settlement period).
Liberalization, climate policy and promotion of renewable energy are challenges to players in the electricity sector in many countries. Policy makers have to consider issues like market power, bounded rationality of players and appearance of fluctuating energy
sources in order to provide adequate legislation. Furthermore, interactions between markets and environmental policy instrument become an issue of increasing importance. A viable approach for the scientific analysis of these developments is equilibrium methods, the goals of this chapter is to provide an overview on the market concept and its evolution towards a competitive environment, this evolution of the power market leads to a new electricity market that is an ‘electricity pool’. Yet the pool concept suffered from a number of disadvantages. Those problems led the UK government to announce New Electricity Trading Arrangement (NETA) as a new power market in 2001 and developed into British Electricity Trading and Transmission Arrangement (BETTA) in 2005 that covers England, Wales and Scotland. BETTA specification leads us toward understanding the concepts of oligopoly and oligopsony market conditions and investigations of this market structure.
In order to achieve a clear understanding of the UK electricity market operation, as a bilateral electricity market, and to find out how this market can be modeled in a way to create an environment to help all market participants make profit, an overview of electricity market revolutions from vertically integrated utilities to a competitive market environment in the UK and other countries is presented in this chapter. Pool structure electricity markets will be described and a brief introduction about the appearance of NETA and BETTA will be discussed. However, a more detailed review of BETTA and the risks of participating in such a market will be provided in Chapter 3. Considering deregulated electricity markets’ risks, this chapter correspondingly evaluates different market study methods, which have been studied. Further details with respect to the proposed modeling method will be discussed comprehensively in Chapter 4.
2.2 Concept of Electricity Market
Several governance structures and market designs have been proposed to reflect regional and national requirements. Like other competitive markets, numerous evolutions have occurred and still there are some ongoing revolution processes; however unlike other markets the governance, regulations and pricing arrangements for this kind of market are very complicated. It took years for policy makers to find out that markets for
transmission and energy cannot be introduced without any linkage between them and after several trial investigations some appropriate and established structures have been introduced [2].
Several years ago, when customers wanted to buy and use electricity they had no choice since the structure of the electrical industry was a monopoly. Thus, they had to buy electricity from the utilities, which was vertically integrated and held the monopoly [1]. Those utilities managed generation, transmission, distribution, infrastructure supervisions and electric services to the individual large or small customers. They also coped with the maintenance and future developments of their own assets to meet the future demand level and also maintained both high voltage transmission lines and low voltage distribution network. Therefore, the security of supply, which is one of the most important pillars in national strategies, could not be met properly since it was shared among all these vertically integrated utilities. Some of these utilities were government agencies, while others were regulated private companies. Figure 2.1 demonstrates the monopoly model of electricity market [1]. In (a) the utility is completely vertically
integrated; however in (b) the distribution handled by two or morecompanies.
(a) (b)
Energy sale
Energy flow within a company
Figure 2.1: Monopoly of Electricity Market [1]
Generation Company Wholesale Transmitter Distribution Company Generation Company Wholesale Transmitter Distribution Company Customer Customer
In the 1980’s engineers, customers and economists realized that this kind of structure could remove the incentives to operate, participate and make investment efficiently in the electrical industry. The public utilities were so close to the government and these policies could interfere with the power market [2]. Besides, the regulated private utilities passed on the cost of their mistakes to the customers and that made the price of the electricity unreasonably high.
In order to introduce more incentives to the market participants and make the quality of supply higher and the electricity price low, the existence of competition in the market and among the participants of the electricity industry is an essential issue to consider. In most cases the introduction of competition leads into privatization. In the privatization process some public utilities are sold to the private sector by the government [1].
Figure 2.2 shows the double dimension of the restructuring process. The vertical axis shows the reforms related to the ownership and the horizontal axis displays the market
structure [3].By moving towards left, the level of completion increases.
Figure 2.2: Restructuring Dimensions and Possibilities [3]
Direct Government Ownership
The government owns and manages the system
Government Owned
The government owns the corporation that manages the system
Privately
Private Companies Manage the System
Ownership & Management Market Structure Monopoly Purchasing Agency Wholesale Competition Retail Competition Commercialization Corporation Privatization Power purchase contracts COMPETITION Distribution network access & standard costs Transmission network access & market
2.3 Models for Electricity Sector
According to the Figure 2.2, four electricity models combining the types from Hunt and Schuttleworth (1996) and Tenenbaum, Lock and Barker (1992) can be considered. The level of competition at each stage has distinguished these models, presented as below.
2.3.1 Monopoly
Generation, transmission and distribution in this model are vertically integrated, although in the distribution section there may be different distribution companies, which have local monopoly conditions (Figure 2.1). This can happen commonly in the wholesale market even for bilateral trading [4,5].
2.3.2 Purchasing Agency
This is a first step around a competitive environment in the electricity market. In this model the utility no longer owns all the generations. Here the Independent Power Producers (IPP) plays an important role and sells their electricity as purchasing agents [1]. Figure 2.3 illustrates the purchasing model, in which IPPs are also participating in the electricity trading and have brought competition into the generation side.
Figure 2.3: Purchasing Agency Model of Electricity Market [3] Own Generations Wholesale Purchasing agency Distribution Consumer IPP IPP
One of the advantages of this model is introducing some competitive environments in the generation side. However, this model cannot be an appropriate one especially for a bilateral market since there are still some monopoly and monopsony powers among the participants.
2.3.3 Wholesale Competition Model
There is no central organization in this kind of model. All the Distribution Companies (DisCos) purchase the electricity directly from the Generation Companies (GenCos) and
distribute among their customers. As shown in Figure 2.4, large customers are allowed
to buy the electricity directly from the wholesale market [1,2,5-7]. At the wholesale level, only the operation of the transmission network and the Spot market remain centralized [1]. On the other hand, at the retail level the system is still centralized, since each DisCo purchases electricity on behalf of customers that are located in that area.
Figure 2.4: Wholesale Competition Model [3]
Wholesale Market Transmission System GenCo Genco GenCo Genco GenCo GenGco DisCo Genco Consumer Genco Consumer Genco DisCo Genco DisCo Genco
It is noticeable that the wholesale market can take the form of Pool or bilateral transactions [2]. This model creates a more competitive environment at the generation level because the wholesale price can be determined by the bidding strategies of the GenCos. On the other side, the retail price of electricity should be regulated based on the fact that there is no chance for small customers to select their suppliers if the prices are too high. This is even challenging for DisCos since they cannot reduce their exposures to the risk of increases in the wholesale price.
2.3.4 Retail Competition
In this model customers have been given the chance to choose their suppliers in full retail competition [7-9]; therefore there is no need for the retail price to be regulated any more. In this model, because of transaction charges some large customers can purchase
electricity directly from the wholesale market. Figure 2.5 demonstrates the structure of
this model.
Figure 2.5: Retail Competition Model [3]
Consumer Consumer Consumer Consumber Consumer Consumer Large consumers Large consumer GenCo Genco GenCo GenGeco
Wholesale Market TransmissionSystem
Wholesale market transmission system
Retail Market DistributionNetworks
Retail market Distribution Networks
SupplyCo Retailer GenCo Genco SupplyCo Retailer SupplyCo Retailer
It is also noticeable that Distribution Companies’ physical activities are totally separate from their retail activities to avoid any local monopoly for supplying the electricity to the end users [2]. The only concern that remains is the monopoly in operation of transmission and distribution networks, so it is expected that the charges for using these networks would be shared among all the market participants. Hence, differences in these models are whether there is competition among generation companies, supply companies and also whether the final consumers can choose whom to buy their power from, e.g. comparing to wholesale model, in retail completion the end-users have been provided the chance of choosing their suppliers.
2.4 Global Movements towards Market Restructuring
In the late 1970s, one of the earliest introductions to the privatizations in the market structure took place in Chile. Argentina also tried to build a market and privatize existing generation companied and provide capital investments for reintegration of assets and for transmission expansions. Other Latin countries like Brazil, Peru and Colombia were among those followers who tried to establish a competitive market in 1990s [2].
Economic crisis forced other countries around the world to restructure their market into a completive one in order to bring transparency and remove market power from wholesale trading. Nordic countries, Continental Europe, New Zealand, North America, Australia and Great Britain were among those pioneers [2]. Brief summary of these market revolutions are described below.
2.4.1 Nordic Countries
Nordic countries consist of Norway, Sweden, Finland and Denmark. Norway was the first country that introduced market restructuring by the Energy Act of 1990. Following Norway, Sweden tried to establish a competitive market in 1995, which resulted in establishing Norwegian-Swedish Exchange (Nord Pool) in 1996. Later on Finland
joined this market in 1998, West Denmark in 1999 and East Denmark in 2000. There are five System Operators (SO) in this market, one for each country except Denmark with two SOs; therefore the Nord Pool can be considered as the only existing international market [10].
2.4.2 Continental Europe
Since electricity markets in each European Union (EU) states have weak points in terms of cross-border electricity exchanges the idea of single Internal Electricity Market (IEM) was introduced in 1996 [11-13].
The majority of trading would be bilateral contacts including forward and future arrangements; only a small fraction of trading would take place in daily and hourly contracts in the spot markets in order to help all participants to fine-tune their positions. The IEM would be divided into submarkets in order to help Transmission System Operators (TSOs) monitoring and controlling each zone. In 1999, European Transmission System Operator (ETSO) was established in order to implement IEM. Also in 2009, European Network of Transmission Systems Operators for Electricity (ENTSO-E) was founded to insure co-operation among European TSOs and implement regulations and rules in line with European Union legislation [12].
However, it is obvious that further investigations required establishing a single IEM for all EU states, with the purpose to fulfill all three European Union pillars, which are as follow:
Security of supply
Sustainability and environment
Competition
European Council (EC) has set a target as 2014 to achievement of the Internal Electricity Market. By this time electricity would be traded freely in Europe [11].
2.4.3 New Zealand
New Zealand used to have a monopoly electricity market until 1994. Since then several deregulations took place in both generation and retail sides to bring competition into the market. The wholesale electricity market, called NZEM, brought transparency and regulated prices by using pool and spot markets. NZEM in considered as the first international market based on nodal pricing, which brings Local Marginal Pricing (LMP) in the market. M-co is a company who administrates the market on behalf of government and a state-owned company is the owner of transmission networks and plays the role of TSO [14].
2.4.4 Australia
Altered commercial solutions and restructures were introduced in the early 1990s to eliminate the monopoly from wholesale and retail markets and bring functionality into transmission and distribution network operations. In 1998 the major reform took place in southern and eastern Australia where the National Electricity Market (NEM) was established. The market operator for this market is called National Electricity Market Management Company (NEMMCO).
The NEM involves pool structure where all the electricity sold at wholesale level is traded in this market. NEM covers one of the longest interconnected power systems since there are six zones in this market and constraints on interconnectors can cause distinct marginal spot prices among these regions [2,15].
2.4.5 United States
The emerge of Independent System Operators (ISOs) in United States happened in 1996 after launching the Energy Policy Act of 1992. The Federal Energy Regulatory Commission (FERC) introduced ISOs including Pennsylvania-New Jersey-Maryland (PJM), ISO New England (ISO-NE), New York ISO (NYISO), California ISO
(CalISO), Midwest ISO (MISO), Southwest Power Pool (SPP) and Electric Reliability Council of Texas (ERCOT) [2].
Each ISO covers one or more than one area and is responsible for reliability and security of supply for those areas. The procedure of this market is based on two elements: Available Transfer Capabilities (ATC), provided by ISOs, and Open Access Same-time Information System (OASIS). These ATCs would be published on OASIS and based on bilateral trading; transmission requests can be addressed within those specified areas [16].
However diversity in a number of ISOs in United States caused divergence problems. Some ISOs had pool market background, which resulted in creation of several voluntary spot markets like 1997 PJM and 1999 ISO-NE markets [17,18]. In order to establish a top-level organization to ensure the reliability of all transmission networks and security of supply, FERC founded Regional Transmission Organizations (RTO) in 2000, which was responsible for market operations and regulations and supervising the ISOs. Finally, this complex structure of electricity market and partial deregulations caused market
manipulation and in 2000 California Market had several crises, which resulted in
multiple blackouts and economic fall out [19].
The California electricity market crisis was a good case that demonstrated the importance of considering market reliability in designing electricity market structure.
2.5 Great Britain
As discussed earlier, one of the main reasons of market deregulation was to make electricity, as a commodity in such a market, analyzable in economical and financial frameworks. UK electricity industry has seen major changes since Electricity Act in 1989 [5] in order to make it one of the most advanced electricity market in Europe. The following sections represent these evolutions.
2.5.1 Electricity Pool in UK
The UK introduced a new electricity market that started on April 1st 1990. The
electricity was sold through the Electricity Pool, which had become the wholesale market for trading electricity. In 1990 before the privatization, there were three major companies in England and Wales and National Power, Powergen and Nuclear Electric supplied approximately 75% of the UK’s power generation [5].
2.5.1.1 Competition at Generation Level
In the 1990s, the competition on the generation side created an environment in which there were nearly 40 major generation companies selling electricity into the Pool in England and Wales. However, the Pool was still dominated by the 5 largest companies – British Energy, PowerGen, National Power, BNFL Magnox Generation and Eastern Merchant Generation – that produced 50% of the generated electricity from October 1999 to September 2000. 2% of the generated electricity was provided by the France-England and Scotland-France-England interconnections and the remaining 48% from other medium and small size generation companies [20]. Also there were four large generation companies in Northern Ireland owned by Premier Power, Nigen and Coolkeeragh Power. In contrast to England and Wales and Northern Ireland, Scotland had a monopoly market dominated by ScottishPower and Hydro-Electric. Later Privatizations and deregulations covered National Power, PowerGen and Scottish Power in 1991, National Grid in 1995 and finally British Energy in 1996 [20].
2.5.1.2 Competition at Transmission Level
Before BETTA, there are four transmission operators in the UK. National Grid Company (NGC) is operating in England and Wales, which is the largest transmission network. Northern Ireland Electricity is operating the transmission network in Northern Ireland and similarly there are two transmission operators in Scotland: ScottishPower and Hydro – Electric. All these transmission networks are connected through several
interconnections. However, after 1990 in order to bring flexibility and competition in to the market these transmission networks are open to licensed suppliers based on a Grid Code [5,20].
2.5.1.3 Competition at Distribution Level
There were 15 privatized Regional Electricity Companies (RECs) in the UK from 1990 to 2001. Each distribution grid operated by one REC. RECs were responsible for both distribution and supply the electricity before the privatization however, after market deregulation these two tasks unbundled. 12 RECs covered England and Wales and distribution grid in Scotland was operated by 2 RECs alongside generation and transmission companies and Northern Ireland was vertically integrated with only one company [20].
2.5.1.4 Competition among Suppliers
Before privatization, distribution companies were responsible for supplying the customers in their regions. However, after Pool establishment the supply market became open for competition and RECs could participate in trading. There were two types of RECs in the market described as follow [5,20]:
First Tier RECs: These were the local responsible companies for distributing electricity in their designated area. Alongside their responsibilities for connecting end-users to the grid, they were constrained to supply electricity to any small customers within their licensed area as well. They were regulated by public electricity supply (PES) license. Since they were providing physical connections and playing the role of supplier they can easily dominate the market and their market share for each area would be high.
Second Tier RECs: Other supply companies were considered as Second Tier RECs. They were regulated by a private license. These supplier provided electricity for the customers, which were outside their regions.
Table 2.1 demonstrates the market share for each REC in each region. It can be found that the First Tier RECs were dominating the supply market.
Table 2.1: Domestic Market Share of Local REC (June 2000) [20]
Region REC (owner of supply business)
Market share by number of customers (%)
Market share by volume (%)
Eastern Eastern Energy (TXU) 81 82
South Southern Electric (SSE) 83 85
East Midlands East Midlands Electricity
(PowerGen) 79 79
Midlands Midlands Electricity
(Innogy) 82 85
Northwest Norweb (TXU) 83 81
South Scotland Scottish Power 84 86
Yorkshire Yorkshire Electricity
(Innogy) 84 85
Southeast Seeboard 83 84
London London Electricity (EdF) 84 85
Merseyside Manweb (Scottish power) 81 86
Northeast Northern Electric 78 75
Southwest Sweb (EdF) 89 91
South Wales Swalec (SSE) 84 88
North Scotland Hydro-Electric (SSE) 89 93
Correspondingly, Figure 2.6 has been provided in order to achieve to a comprehensive understanding of UK electricity Pool structure.
Generation
Transmission
Distribution and Supply
Customers
Figure 2.6: Privatized UK Electricity Industry Structure [5]
National Power POWERGEN Nuclear Electric EDF Hydro-Electric Public Electricity Suppliers Scottish Power ScottishPower Power Pool
National Grid Company Hydro-Electric
Scottish Nuclear
Scottish Power Hydro-Electric
Franchise (up to 1 MW) PES Monopoly
Open (over 1 MW) can contract with any
2.5.1.5 Electricity Pool General Structure
The Pool was a centralized market and designed to allow National Grid (NG), as the System Operator (SO), to be responsible for making sure that there is enough generation
capacity in the system to meet the end-users’ demand. Figure 2.7 demonstrates an
overview of Pool’s procedures.
Bidding PX SO Final schedules
Bidding from generators and suppliers
Determining market clearing prices &
quantities
Dispatching power for plants, carrying out congestion management
and purchasing ancillary services
Plants receive final schedules
Figure 2.7: Overview of Pool’s Procedures
Based on above discussion, the Pool does not buy or sell electricity. It just provides a framework, within which all sales and purchases of the electricity made between producers, and consumers took place. Bids submitted by the generation companies are ranked by the market operator in order of increasing price. This is called ‘‘merit order’’. Figure 2.8 below illustrates the merit order ranking.
Figure 2.8: Electricity Pool Market Merit Order Ranking
Bidding PX SO Final Schedule
£50 MWh £20 MWh £20 MWh Offer prices
The SO carries out a centralized dispatch, which decides which generation company run in order to meet the demand. Marginal generator is the last generator that is scheduled to meet the demand from either demand cost curve or demand forecast and System Marginal Price (SMP) is based on marginal cost of marginal generator [21,22]. Generators selling price into the Pool was based on the price of marginal generation in each half – hour.
Under this scheme generation companies have an incentive to offer a price which is equal to their marginal costs which implies:
Individual generators cannot increase the market price by raising their own offer
prices unless they know that their power plant is at the margin.
There is insufficient competition and some players would practice market power
because:
If they offer a price that is too high, they may not be dispatched at the times
when the spot price is above their real costs according to the merit order ranking and SMP.
If they offer a price that is too low, they may be dispatched at times when
the spot market price is below their real costs.
For some generation companies, the priority is to get their units running, so
market manipulation would happen and they may submit zero bids, but still get paid at SMP, which is not fair [22].
Since the beginning of the Pool until 1998 only the 50,000 largest customers had been given the opportunity to switch between the suppliers; however, from September 1998 all end-users were given this permission to make the demand side more active [21]. However the Pool was not able to make the demand side fully active in the market trading.
Although this restructuring brought some competition in the market that caused 30% reduction in electricity bills [21,23] in the first few years, after a while the Pool started to be suffering from some problems and discriminations.
Accordingly, the Pool suffered from number of key problems, such as:
Complexity of bids, since no-load price and average marginal cost should be
taken into account for submitting merit order price
Pool capacity payment, since all customers were paying for capacity payment,
which was not reasonable
One sided market, since the demand side did not have an active role
Market power, since some GenCos could submit zero bids to get paid at SMP
Marginal pricing
Lack of transparency in submitting bids
Lack of competition
These began a process to make fundamental changes in the market and led to NETA appearance.
2.5.2 Appearance of NETA and BETTA
The New Electricity Trading Arrangement (NETA) appeared in March 2001. NETA took four years to develop from its beginning of 1997, to implementation in 2001. This new arrangement covered England and Wales and reformed into British Electricity Trading and Transmission (BETTA) in 2005, which besides England and Wales, covers Scotland [24-30]. One of the most significant principles of BETTA is that the market should provide a free environment to bring the capability of meeting all electricity demand in the system. To achieve this goal BETTA abolished the electricity Pool as a
centralized market in which the National Grid Company (NGC) as the system operator according to the bids and offer of the market participants and the security issues of the system, determines which units of the GenCos should generate electricity and which generators and suppliers are permitted to sell and buy electricity in the Pool.
On the opposite side, BETTA has created a market framework in which all units of GenCos are free to self-dispatch and decide to generate electricity according to their objectives. They can enter bilateral contracts with suppliers. The key point of BETTA is based on a series of bilateral contract traded ahead of real time. These contracts can be in the form of forward and future trading several months or even one year ahead of real time. According to the main specifications of BETTA, unlike the electricity Pool that was centralized-dispatched, here all generators are self-dispatched. It means that each generation company according to its maintenance schedule, marginal cost, cost of fuel, etc., decides to generate the electricity or buy from the market. Therefore, all units of a power plant can generate within a wide range, they can generate at their full rated level
or nothing. Also demand side plays an active role through the retail market (Figure 2.9).
More about this new trading arrangement will be discussed in Chapter 3.
These significant specifications can lead us to find that all electricity market participants have various specifications as follow:
Heterogeneous; they are have various specifications
Autonomous; they are acting independently
Have their own objectives and their own strategies to reach them
They interact among themselves in a dynamic changing environment
Therefore, all these factors direct us to an investigation into a proper model in order to develop an algorithm that acts as a tool to support decisions and obtain knowledge about market behaviors to model this environment and maximize all market participants’ profits.
2.6 Concerns and Consequences of Market Deregulation
The electricity sector in both UK and Europe is experiencing considerable changes. The privatization of electricity market, climate policy, proposed Renewable Obligations
(ROs), CO2 emissions and renewable targets are some factors to be addressed now and
near future.
According to these issues new question arises:
How to simplify the structure of deregulated markets and the process of bidding?
How to model each market component to find out its objectives and strategies?
How can liberalized markets be developed without endangering the security of
supply?
How to implement a method in a way that all market participants would make
profit?
How to hedge the risk of market participations and reduce the exposures to the
![Figure 2.2 shows the double dimension of the restructuring process. The vertical axis shows the reforms related to the ownership and the horizontal axis displays the market structure [3]](https://thumb-us.123doks.com/thumbv2/123dok_us/9522701.2435722/34.918.163.833.583.979/figure-dimension-restructuring-vertical-ownership-horizontal-displays-structure.webp)
![Figure 2.6: Privatized UK Electricity Industry Structure [5]](https://thumb-us.123doks.com/thumbv2/123dok_us/9522701.2435722/45.918.148.855.92.719/figure-privatized-uk-electricity-industry-structure.webp)

![Figure 3.4: Typical GenCo’ and Demand’ FPNs, Left FPN for a GenCo, Right FPN for a Demand [20]](https://thumb-us.123doks.com/thumbv2/123dok_us/9522701.2435722/77.892.174.799.674.888/figure-typical-genco-demand-fpns-genco-right-demand.webp)
![Figure 3.6: Acceptance of Bid – Offer Pair of a Generator Unit [20]](https://thumb-us.123doks.com/thumbv2/123dok_us/9522701.2435722/79.892.206.745.101.356/figure-acceptance-bid-offer-pair-generator-unit.webp)