To Swing or not to Swing:
Learning when (not) to Advertise
Andrei Broder
†, Massimiliano Ciaramita
‡, Marcus Fontoura, Evgeniy Gabrilovich
†,
Vanja Josifovski
†, Donald Metzler
†, Vanessa Murdock
‡, Vassilis Plachouras
‡†Yahoo! Research, 2821 Mission College Blvd, Santa Clara, CA 95054, USA ‡Yahoo! Research Barcelona, Ocata 1, Barcelona, 08003, Spain
ABSTRACT
Web textual advertising can be interpreted as a search prob-lem over the corpus of ads available for display in a partic-ular context. In contrast to conventional information re-trieval systems, which always return results if the corpus contains any documents lexically related to the query, in Web advertising it is acceptable, and occasionally even de-sirable, not to show any results. When no ads are relevant to the user’s interests, then showing irrelevant ads should be avoided since they annoy the user and produce no economic benefit. In this paper we pose a decision problem “whether to swing”, that is, whether or not to show any of the ads for the incoming request. We propose two methods for ad-dressing this problem, a simple thresholding approach and a machine learning approach, which collectively analyzes the set of candidate ads augmented with external knowledge. Our experimental evaluation, based on over 28,000 edito-rial judgments, shows that we are able to predict, with high accuracy, when to “swing” for both content match and spon-sored search advertising.
Categories and Subject Descriptors
H.3.m [Information Search and Retrieval]: Miscella-neous
General Terms
Algorithms, Experimentation
Keywords
Web advertising, ad selection, result quality prediction
1.
INTRODUCTION
Web advertising allows merchants to advertise their prod-ucts and services to the ever growing population of Internet users. Online advertising has quite a few benefits over its brick-and-mortar sibling, as it allows making the ads rele-vant to users’ actions, rapidly changing the inventory and
Permission to make digital or hard copies of all or part of this work for personal or classroom use is granted without fee provided that copies are not made or distributed for profit or commercial advantage and that copies bear this notice and the full citation on the first page. To copy otherwise, to republish, to post on servers or to redistribute to lists, requires prior specific permission and/or a fee.
Copyright 200X ACM X-XXXXX-XX-X/XX/XX ...$5.00.
pricing of ads, as well as measuring response and conver-sion statistics [8, 26]. Online advertising is one of the major sources of income for a large number of Web sites, including search engines, blogs, news sites, and social networking por-tals. A significant part of Web advertising consists oftextual ads, the ubiquitous short text messages usually marked as “sponsored links” or the like. There are two primary chan-nels for distributing such ads. Sponsored Search (or Paid Search Advertising) places ads on the result pages of Web search engines, with ads being driven by the search query. All major Web search engines (Google, Microsoft, Yahoo!) derive significant revenue from such ads. Content Match
(orContextual Advertising) displays commercial ads within the content of third-party Web pages, which range from indi-vidual blogs and small niche communities to large publishers such as major newspapers. Today, almost all of the for-profit non-transactional Web sites rely at least to some extent on advertising revenue.
Both types of textual advertising can be viewed as a search over the corpus of available ads. The query triggering this search is derived either from the user’s Web search query, or from the content of the Web page where the ads are to be displayed. In both cases, the ad search query can be augmented with auxiliary information such as location, lan-guage, and user profile.
In conventional Web search, as well as in most informa-tion retrieval systems, if query terms are matched by some documents in the indexed collection then this query will nec-essarily yield some results. However, in Web advertising it is acceptable, and occasionally even desirable, not to show any results if no “good” results are available. That is, if no ads are relevant to the user’s interests, then showing ir-relevant ads should be avoided since they impair the user experience, and eventually may drive users away or “train” them to ignore ads. In any case, users are unlikely to click on irrelevant ads, and hence there are no economic benefits to such ads in either the pay-per-click or the pay-per-action model.
The ability to reliably assess the relevance of retrieved ads is also valuable for another reason. Ad selection platforms usually have multiple ad retrieval mechanisms that run in parallel and independently select ads. These sets are then merged and re-ranked together to select a few ads that are shown to the user. Different mechanisms might work well on different types of content. Therefore, if we could automat-ically determine when a certain mechanism is not working well for a particular content, we could exclude its results from the re-ranking.
In this paper, we investigate the problem of automatically predicting whether or not an individual ad or an entireset
of ads is relevant enough to be displayed. We call this the “swing / no swing” problem, in reference to the game of baseball, where the goal of swinging is to hit a home run, or at least get on base. In the advertising case, “swinging”refers to showing a set of ads. The goal of swinging in advertising is to show many relevant ads (a home run, if you will) or, at the very least a set of ads that do not drive the user away (a single base hit). In advertising, as with baseball, it is undesirable to always swing. In fact, it is often better not to swing at all, especially if the set of candidate ads are not relevant to the current context.
In the remainder of this paper, we propose and analyze two approaches for solving the swing / no swing problem. The first is a simple thresholding approach that relies on the scores produced by the ad ranking system and analyzes the candidate ads individually. The second is a more sophisti-cated machine learning approach uses a set of heterogeneous features to predict whether theentire set of candidate ads should be displayed or discarded. Notably, the features used for the swing decision are not available during the retrieval process, and this secondary filtering step is made possible through the introduction of additional knowledge.
The contributions of this paper are threefold. First, we pose the swing problem, which is a novel advertising task and and motivate the importance of the problem. Second, we propose two novel methods for solving this problem, one of which is based on global score thresholding and the other which is framed as a machine learning problem. Our empir-ical evaluation shows that both approaches can significantly improve ad relevance compared to a system that always shows ads. Third, we propose a novel set of knowledge-rich semantic features that are highly predictive of ad quality.
The remainder of this paper is laid out as follows. First, in Section 2, we describe the details of our swing/no swing model, including the various features used in our decision framework. Then, in Section 3, we evaluate our proposed approach in content match and sponsored search advertising settings. Section 4 discusses related work on advertising and predicting result set quality. Finally, Section 5 concludes the paper and describes potentials areas of future work.
2.
THE SWING/NO SWING MODEL
In this section, we describe our two approaches for de-termining when to advertise (swing) or when not to adver-tise (no swing). Given a query or a target page1
for which we want to produce ads, we assume that we have a “black box” ad ranking system that retrieves a set of candidate ads. We make no assumption as to how this set of candidates is produced. We only assume that some meaningful relevance score is assigned to each ad. Furthermore, we assume that every ad has some data associated with it, including a ti-tle, description, landing page, bid phrase, and a bid price. This data is fairly standard and used by most commercial search engine advertising systems. To enrich the ad repre-sentation, we annotate our ads with five semantic classes, using the technique proposed by Broderet al.[3].
2.1
Thresholding Approach
1
To simplify the presentation, we use the term “query” to describe both queries for sponsored search and Web pages for content match.
The first method that we propose is based on global score thresholding. If we assume that the scores produced by our “black box” ad ranking system are indeed reasonable, then we can further assume that ads with higher scores are more likely to be relevant than those with lower scores. Therefore, we propose setting a global score threshold that determines whether or not an ad should be returned or not.
In this scenario, different threshold settings return differ-ent sets of ads. If, for a given query, all of the ads have a very low score that is below the global threshold, no ads will be returned. This corresponds to a no swing decision. For those queries that retrieve at least one ad, we have ef-fectively made a swing decision. Therefore, every threshold corresponds to a different level of coverage, where coverage is defined as the proportion of queries for which at least one ad is returned. Different tradeoffs between coverage and ef-fectiveness can be achieved by tuning the threshold. Such tradeoffs must consider expected revenue (more ads shown, more revenue), as well as user dissatisfaction (more non-relevant ads, more dissatisfied users). Effectively modeling such tradeoffs is a very difficult problem that requires un-derstanding both short-term and long-term user behavior. Exploring these tradeoffs is beyond the scope of this work.
The primary advantage of this technique is that it is very simple to implement. The biggest disadvantage is the need to choose a reasonable threshold. Even though we assumed that the scores produced by our ad ranking system are rea-sonable, it is very likely, in practice, that they are very noisy, and reliably setting a global threshold may be dif-ficult. Although not explored in this work, better results may be achieved via score normalization [20, 22].
2.2
Machine Learning Approach
The second method that we propose frames the swing/no swing problem as a machine learning problem. The prob-lem can be naturally formulated as a binary classification problem. Given a query and the set of candidate ads, our goal is to predict whether or not the entire set of ads is rele-vant enough to display. This is very different from the task of ranking ads, which takes a query/ad pair as input, and produces a score that is then used for ranking. Here, our prediction mechanism takes a query and aset of ads as in-put and produces a yes/no decision as to whether the entire set should be displayed.
To form the ground truth for training the model, we must aggregate human judgments for individual query/ad pairs to distill a single judgment for each query/set-of-ads. Each ad/query pair gives a number of votes, according to its hu-man judgment, in favor of the swing action for the query. We decide that we should swing if the average number of votes is lower than some fixed threshold (denoted byτ). By set-ting the threshold very low, we will only show ads in a small number of cases where the ad result set is very high quality. On the other hand, if the threshold is set very high then ads will be shown for many queries, although the quality of the ads will not be as good. Therefore, the threshold should be considered a parameter that can be used in conjunction with a more complex, holistic cost function to determine whether or not to show ads. In our evaluation, we examine various values forτ.
We use Support Vector Machines (SVMs) for learning a classification model. We use SVMs because they have been
shown to be highly effective for a variety of other text classi-fication tasks. It is important to note that any binary clas-sifier can be used for this task, including Na¨ıve Bayes and boosted decision trees. It is not our goal to evaluate a wide range of classifiers, but rather to show how such classifiers can be applied to the task at hand.
2.3
Feature Construction
When framed as a classification problem, the swing/no swing problem can be reduced to choosing a set of features that are good at discriminating between good and bad sets of ads. In this section, we describe a variety of features that we hypothesize will be useful for learning the SVM-based swing/no swing predictive model. The features we propose attempt to capture two very different aspects of the candidate set of ads. The first aspect we aim to capture is the notion ofad relevance. In order to determine if an entire set of ads is relevant, it is important to have some measure of how relevant each individual ad is. Therefore, many of our features focus on standard information retrieval measures of relevance. Given a relevance measure for each individual ad, we must combine, or aggregate, the values in such a way that it characterizes the entire set of ads. We propose four different ways of aggregating these feature values.
The other aspect that we focus on isresult set cohesive-ness. Here, rather than aggregating features computed over individual query/ad pairs, we compute features over an en-tire set of ads. The features that we propose attempt to capture how cohesive the set of ad results are. We examine various types of cohesiveness, ranging from how cohesive the ad scores are to how semantically cohesive the ads are.
2.3.1
Ad Relevance Features
The first class of features that we consider have been pre-viously shown to be highly effective for ranking individual ads [10]. Since these features are good for ranking ads, it is likely that they will also be useful for predicting whether an entire set of ads is relevant or not. These features, in their original form, are computed over query/ad pairs. However, the swing/no swing decision is made for every query or tar-get page. Therefore, we must aggregate the query/ad pair feature values to produce a single value for the query/set-of-ads pair. Given a featureX that is defined over a single query/ad pair, we compute four aggregated feature values as follows: Xmin(Q,A) = min A∈AX(Q, A) Xmax(Q,A) = max A∈AX(Q, A) Xmean(Q,A) = X A∈A X(Q, A) |A| Xwmean(Q,A) = X A∈A SCORE(Q, A)·X(Q, A) P A′∈ASCORE(Q, A′)
where A is the candidate set of ads, Q is the query and
SCORE(Q, A) is the score returned by ad ranking system for adAwith respect toQ. The aggregate features attempt to capture general properties of the entire set of ads based on the characteristics of individual ads. The remainder of this section describes the ad relevance features (i.e.,X) that we use to compute aggregate feature values.
Word Overlap Ribeiro-Netoet al.[24] found that con-straining the ads such that they were only placed in target pages if the target page contained all of the bid terms im-proved precision. Our setting is different, so constraining the ads in this way eliminates almost every ad candidate. Rather, we encode this constraint in a set of four features that attempt to measure the degree to which the ad terms overlap with the query.
For the content match data, the first three features are binary, computed as follows:
if (∀t∈A)t∈Q,F1= 1, and 0 otherwise.
if∃t∈Asuch thatt∈Q,F2 = 1, and 0 otherwise. if¬∃t∈Asuch thatt∈Q,F3= 1, and 0 otherwise.
The first is “1” if all of the bidded terms from the ad ap-pear in the query. The second is “1” if some of the bidded terms appear in the query. The third is “1” if none of the bidded terms appear in the query. Our fourth word over-lap feature is a continuous feature that is defined as the proportion of bidded terms that appear in the query. The features were computed in the analogous way for the spon-sored search data, except that the role of the query and the ad are reversed, because the query is typically much shorter than the ad.
Cosine Similarity The cosine similaritysim(Q, A) be-tween the queryQand the adAis computed as follows:
sim(Q, A) = P t∈Q∩AwQtwAt q P t∈Qw 2 Qt q P t∈Aw 2 At (1)
where wQt and wAt are the tf.idf weights of term t inQ and inA, respectively. Thetf.idfweightwQtof termtinQ is aswQt =tf·log2
` N+1 nt+0.5
´
whereN is the total number of ads, andnt is the number of ads in which termtoccurs. The weightwAtof termtinAis computed in the same way.
Translation The bid terms, and for that matter the title and description in the ads, are a necessarily sparse rep-resentation of the full advertisement. As the language of advertising is quite concise, and the language of contextual advertising is even more so, we can imagine that some infor-mation is lost when translating ad title and descriptions to bidded terms and a sentence-length description. To capture the difference in the vocabulary, we build a translation table using the implementation of IBM Model 4 [4] in GIZA++ [1] from a parallel corpus of ad title and descriptions paired with their corresponding landing pages. The translation table gives a distribution of the probability of a word translating to another word, given an alignment between two sentences, and other information such as how likely a term is to have many other translations, and the relative distance between two terms in their respective sentences, as well as the ap-pearance of words in common classes of words. Details of IBM Model 4, and its implementation are provided in [4, 5] and [1].
After constructing the translation table, we compute two features. The first feature is the average of the translation probabilities of all terms in the target page, translating to all terms in the ad title and description. The second is the pro-portion of terms in the target page that have a translation in the ad title and description. Although learning a trans-lation table can be quite inefficient, this step can be done once, offline. Computing the actual features is a matter of
looking up pairs of terms in the translation table.
Pointwise Mutual Information Another measure of association between terms is pointwise mutual information (PMI). We compute PMI between terms of a target page or a queryQand the bidded terms of an ad. PMI is based on co-occurrence information, which we obtain from the query logs of a commercial search engine:
P M I(t1, t2) = log2
P(t1, t2)
P(t1)P(t2)
where t1 is a term from Q, and t2 is a bidded term from the adA.P(t) is the probability that termtappears in the query log, andP(t1, t2) is the probability that termst1 and
t2 occur in the same query.
In the case of content match data, we form the pairs of
t1 andt2 by extracting the top 50 terms according to their
.idf weight from each target page. Theidf weight is com-puted from an index of all the ads. For each pair (Q, A) we compute two features: the average PMI and the maximum PMI, denoted byP M I(avg) andP M I(max), respectively. The PMI for all pairs in the query log can be computed of-fline, and then the features require a table lookup for each query-ad pair of terms.
Chi-Squared Another measure of association between terms is theχ2
statistic, which is computed with respect to the occurrence in a query log of terms from a target page or a query, and the bidded terms of an ad. We compute theχ2 statistic for the same pairs of terms on which we compute the PMI features. Then, for each pair of queryQ and ad
A, we count the number of term pairs that have aχ2 larger than 95% of all the computedχ2
values. As with PMI, the
χ2 statistic can be computed offline for each pair of terms in the query log.
Bid Price We also use the ad bid price as a feature in determining whether or not to swing. If all of the ads retrieved have large bid prices, then it may be the case that the result set is of higher quality. Conversely, if all of the ads have fairly low bid prices, then it may indicate that the result set has poor quality.
2.3.2
Result Set Cohesiveness Features
We now describe our result set cohesiveness features. These features attempt to capture how cohesive, or coherent, the entire set of results is. Unlike the ad relevance features, which are computed for each ad and then aggregated, these features are directly computed over the entire set of ads. Previous research has shown that result set cohesivenses is highly correlated with result set quality forad hocretrieval and web search [11, 29]. Therefore, we hypothesize that such features will also be useful when applied to advertising. Here, we use traditional measures of topical cohesiveness and propose a novel measure of the semantic cohesiveness of a set of ads.
Score Coefficient of Variation Given a set of ad can-didates, we compute the coefficient of variation of the ad scores in order to measure the variance of ad scores for a given query. The coefficient of variation is used instead of the standard deviation or variance because it is normalized with respect to the mean. Since our ad scores are not nor-malized across queries, this normalization is important. The
feature is computed as follows:
COV =σSCORE
µSCORE
whereσSCOREis the standard deviation of the ad scores in the result set, anµSCORE is the mean of the ad scores.
Topical Cohesiveness The next set of features at-tempts to measure how topically cohesive the set of ad re-sults is. Several information retrieval studies have shown that result set quality is highly correlated with the topical cohesiveness of the results, with high quality result sets ex-hibiting strong cohesiveness [12]. Therefore, we investigate whether or not these types of measures may also be useful in the context of predicting when to advertise. We now de-scribe several ways to measure the topical cohesiveness of a set of ads.
Before computing any measures, we first build a statistical model, estimated from the set of ad candidates, as follows:
θz =
X
A∈A
P(z|A)P(A|Q) (2) where P(z|A) is the likelihood of item z given ad A, and
P(A|Q) is the likelihood of adAgiven queryQ. Here,θz is shorthand for P(z|Q), which is a multinomial distribution over itemsz. In this work, we consider two type of items – terms and semantic classes. We now describe how P(z|A) andP(A|Q) are estimated for both types of items.
For terms, we estimateP(z|A) using the maximum likeli-hood estimate and use the ad scores to estimateP(A|Q) as follows:
P(A|Q) = P SCORE(Q, A)
A′∈ASCORE(Q, A′)
(3) where, as before,SCORE(Q, A) is the score returned by the ad scoring system. Whenθ is estimated using Equation 2 in this way using terms, it is often called a relevance-based language model, or just a relevance model [19].
We estimateθz in a similar way for semantic classes. For each ad, we have a set of up to five semantic classes and their associated scores. Since we have scores for the seman-tic classes, we can leverage this information in order to es-timate a more accurate semantic class relevance model. We estimateP(z|A) as follows:
P(z|A) = PSCORE(z, A)
c∈CSCORE(c, A)
where C is the set of semantic classes andSCORE(c, A) is the score assigned by the classifier to class c for adA [3]. In addition,P(A|Q) is estimated according to Equation 3. Plugging these class-based estimates into Equation 2 yields a relevance model over semantic classes. It should be noted that we are the first to apply the idea of relevance modeling to semantic classes in this manner.
After building a relevance model over terms or classes, the cohesiveness of the model must be measured. The first mea-sure we use is called theclarity score, which has been used successfully in the past to predict the quality of search result sets [12]. The clarity score is the KL-divergence between the relevance model and the collection (background) model.The clarity measure attempts to capture how “far” the relevance model estimated from the set of ad candidates (θ) is from the model of the entire set of ads (ˆθ). If the set of ad can-didates is very cohesive and focused on one or two topics,
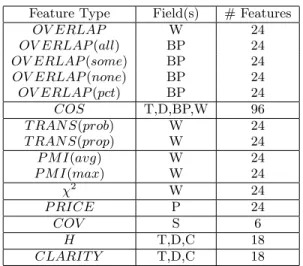
Feature Type Field(s) # Features OV ERLAP W 24 OV ERLAP(all) BP 24 OV ERLAP(some) BP 24 OV ERLAP(none) BP 24 OV ERLAP(pct) BP 24 COS T,D,BP,W 96 T RAN S(prob) W 24 T RAN S(prop) W 24 P M I(avg) W 24 P M I(max) W 24 χ2 W 24 P RICE P 24 COV S 6 H T,D,C 18 CLARIT Y T,D,C 18
Table 1: Summary of features used in the SVM pre-diction model and the fields they are computed over, where T denotes title, D is description, BP is bid phrase, W is whole ad, P is bid price, S is ad score, and C is semantic class.
then the relevance model will be very different from the col-lection model. However, if the set of topics represented by the ad candidates is scattered and non-cohesive, then the relevance model will be very similar to the collection model. The clarity score is computed as:
CLARIT Y(θ) =X z∈Z θzlog θz ˆ θz
where ˆθ is the collection model (maximum likelihood esti-mate computed over the entire collection of ads) andZ is the universe of terms or classes.
Another closely related measure of cohesiveness is the en-tropyof the relevance model, which is closely related to the clarity score. It is computed as:
H(θ) =−X
z∈Z
θzlogθz
We include this feature since it is a more classic measure of cohesiveness and because it does not require the compu-tation of a background model. We compute both clarity and entropy on relevance models estimated from the ad title terms, ad description terms, and ad semantic classes, result-ing in a total of six topical cohesiveness features.
3.
EMPIRICAL EVALUATION
In this section, we describe the details of our empirical evaluation. This includes the details of our experimental design, as well as results of our experiments that evaluate the effectiveness of our proposed approaches to the swing/no swing problem.
3.1
Implementation and Data Details
In Section 2.3, we described nine types of features for use with the SVM approach. Up until this point, however, we have not described what candidate set of ads the features are computed over. There are many possibilities, including usingallads that are retrieved for a given query or using the
topk retrieved ads, for some fixedk. Other options exist, but these are the most straightforward strategies.
In our experiments, we compute each feature over the top k ads retrieved for multiple settings of k (i.e., k ∈ {1,5,10,25,50,100}). That is, we compute each feature us-ing the top ranked ad, the top 5 ranked ads, the top 10, and so on. Thus, each feature is computed at six differ-ent depths. This allows the classifier to automatically learn which depths are the most important for each feature, rather than us manually specifying the depth each should be com-puted at.
Our experimental feature set is summarized in Table 1. For each feature type, we list the ad fields that the feature is computed over, and the total number of features of that type. There are a total of 402 feature in all.
We use the SVMlight2
implementation of Support Vector Machines [16]. We perform 10-folds cross validation and experiment using a variety of kernels (linear, polynomial, and radial basis). We optimize the SVM model for accuracy by sweeping over a wide range of kernel hyper-parameters and misclassification cost values.
In order to gain as much insight into the problem as possi-ble, we run our experiments against two content match data sets (denoted CM1 and CM2) and one sponsored search data set (denoted SS). The CM1 and CM2 data sets consist of 199 and 1103 Web pages, respectively. The SS data set is a col-lection of 642 queries. By using both content match and sponsored search data sets, we can analyze what, if any-thing, changes when our proposed solution is applied to two very different advertising tasks.
For each data set, we have editorial judgments of ad rele-vance. These judgments were done on individual query/ad pairs. For the two content match data sets, the possible judgments are 1 (excellent), 2 (good), and 3 (bad), while the judgments for the sponsored search data set range from 0 (perfect) to 5 (bad). There are 5554 and 13789 human judgments for the CM1 and CM2 data sets, respectively, and 8923 human judgments for the SS data set. For all three data sets, we assume judgments of 1 or 2 are relevant and all other judgments are non-relevant, thereby binarizing the non-binary judgments.
Throughout our experiments, we measure ad relevance effectiveness using Buckley and Voorhees’ BPREF metric, since the judgments we have for each of these data sets are incomplete [6]. We also evaluated our approaches using var-ious other metrics, including precision atk (k={1, . . . ,5}) and mean average precision. Although not reported here due to space limitations, we note that none of the conclusions drawn herein change as the result of using these alternative metrics.
3.2
Thresholding Approach
We begin by analyzing the effectiveness of the threshold-ing approach. One possible way to evaluate the approach is to plot BPREF versus the threshold value. However, the threshold values themselves are of little value to us, as they do not provide much information. Instead, we choose to plot BPREF versus coverage, where coverage is defined to be the proportion of queries for which at least one ad is shown. This is a commonly used metric in online advertising, as search engines typically try to maximize both coverage and relevance. However, in most cases, BPREF (or precision), 2
0 0.1 0.2 0.3 0.4 0 0.1 0.2 0.3 0.4 0.5 0.6 0.7 0.8 0.9 1 BPREF Coverage 0 0.1 0.2 0.3 0.4 0 0.1 0.2 0.3 0.4 0.5 0.6 0.7 0.8 0.9 1 BPREF Coverage 0 0.1 0.2 0.3 0.4 0 0.1 0.2 0.3 0.4 0.5 0.6 0.7 0.8 0.9 1 BPREF Coverage
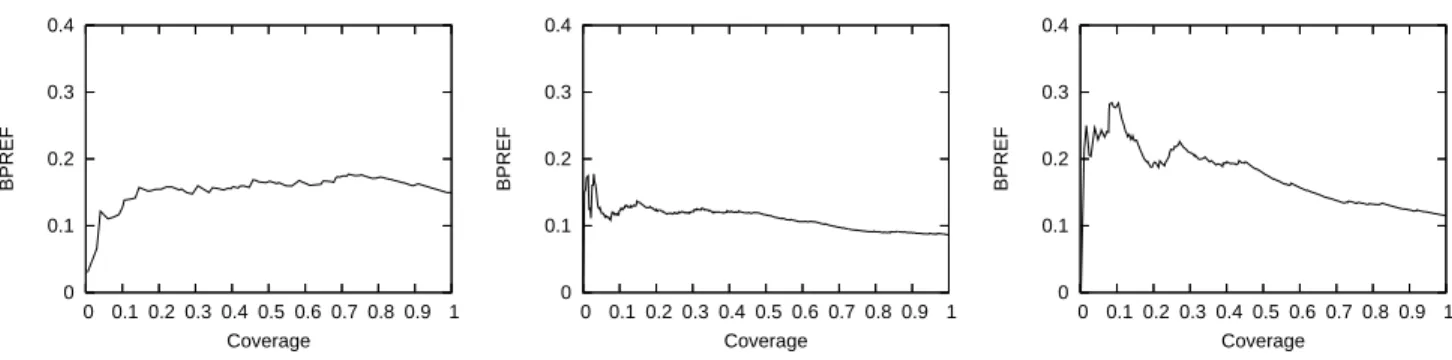
Figure 1: BPREF, as a function of coverage, for CM1, CM2, and SS (left to right) using thresholding.
decreases as the coverage increases. This is very similar to the behavior observed in precision-recall curves.
Figure 1 plots the BPREF as a function of coverage for the three data sets. The general trend across the plots is for the BPREF to decrease as the coverage increases. However, this is not always the case, as the effectiveness for the CM1 data set actually increases until about 80% coverage, at which point it begins to decrease. Since this is a new task, there are no previously established baselines that we can compare these results against.
In practice, these curves can be used to determine the best threshold to use for a particular task. Depending on the goals of the system, one could construct a cost function that is some combination of coverage and relevance. The threshold that optimizes the cost could then be used. Of course, in reality, other variables should also be considered, such as revenue and click-through.
3.3
Machine Learning Approach
Next, we evaluate how well our proposed SVM frame-work, and its associated feature set, can be used to predict the quality of sets of ads for various settings ofτ (see Sec-tion 2.2). Since this is a new task, and no baselines exists, we compare our results against a majority rules classifier which always returns the majority class. The results are given in Table 2 in the “SVM Accuracy” column. Bold results indi-cate statistically significant improvements over the majority rules baseline classifier.
For the two content match data sets, CM1 and CM2, we observe classification accuracies of at least 69% for every threshold setting. Obviously, when the class distributions are heavily skewed, as is the case when the threshold is very high or low, high prediction accuracy is easily achieved. In these cases, it is difficult for the classifier to do anything but classify every example as the majority class, simply be-cause there is so little training data for the minority class. Therefore, it is more interesting to analyze the 2.2 and 2.6 threshold settings, which roughly correspond to showing ads 40% and 60% of the time, respectively. For both of these settings, our technique significantly improves over classifying according to the majority class. This shows that our feature set is capable of distinguishing between good and bad sets of ads. We note that the results observed on the CM1 data set are typically better than the CM2 results. This is likely due to the fact that the CM1 data set is much cleaner and contains fewer noisy (e.g., spam, non-English) pages than the CM2 data set.
Similar results are obtained for the sponsored search data
set SS, although the absolute values are slightly lower than the content match data sets. One reason for this decreased accuracy is the fact that sponsored search tries to match ads to queries, which are very short segments of text that contain little information. On the other hand, in content match, we match ads against entire Web pages, which are longer and contain more information. Therefore, the sparse query representation results in noisier and less accurate feature values, especially for the ad relevance features, which makes prediction more difficult. One potential way to overcome this obstacle is to enrich the query representation using Web search results or other external resources [21, 25]. This is something we plan to investigate as future work.
3.4
Comparison of Techniques
We now compare the effectiveness of our two proposed swing/no swing approaches by carrying out the following experiment. Given a data set and a relevance thresholdτ, a SVM swing/no swing model is learned on a training set. The learned SVM model is then applied to a test set and the accuracy of the swing/no swing decision is measured. The coverage on the test set is also computed. As before, the coverage is simply the fraction of queries for which the SVM predicted to swing. Finally, the BPREF, to a maximum of depth 5, is computed over all the queries the SVM predicted to swing on. This provides a measure of how relevant the ads are using the SVM swing/no swing model.
In order to compare the SVM model with the thresholding model, we then find the global score threshold that yields the same coverage as that observed when the SVM swing/no swing model is applied. That is, we find the global score threshold that results in one or more ads being returned for the same number of queries as the SVM model. After ap-plying the global score threshold, we compute the BPREF. This BPREF can then be directly compared to the BPREF obtained from using the SVM model, since they are both computed at the same coverage level. The model that gives the largest BPREF should then be preferred.
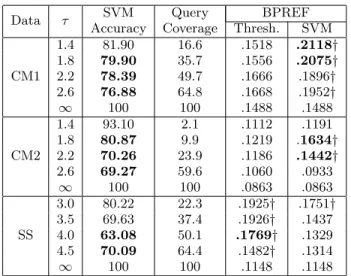
The results of this experiment are given in Table 2. For each data set and relevance judgment threshold (τ) pair, the table lists the accuracy of the SVM model at predicting whether or not to swing, the coverage achieved by apply-ing the SVM model to the query set, and the BPREF for both the SVM model and the threshold model (at the same level of coverage). The τ =∞case corresponds to always swinging, which is assumed to be the default behavior.
We first compare the relevance of the ads returned by the SVM and thresholding approaches to the relevance of
Data τ AccuracySVM CoverageQuery Thresh.BPREFSVM CM1 1.4 81.90 16.6 .1518 .2118† 1.8 79.90 35.7 .1556 .2075† 2.2 78.39 49.7 .1666 .1896† 2.6 76.88 64.8 .1668 .1952† ∞ 100 100 .1488 .1488 CM2 1.4 93.10 2.1 .1112 .1191 1.8 80.87 9.9 .1219 .1634† 2.2 70.26 23.9 .1186 .1442† 2.6 69.27 59.6 .1060 .0933 ∞ 100 100 .0863 .0863 SS 3.0 80.22 22.3 .1925† .1751† 3.5 69.63 37.4 .1926† .1437 4.0 63.08 50.1 .1769† .1329 4.5 70.09 64.4 .1482† .1314 ∞ 100 100 .1148 .1148
Table 2: Summary of the swing/no swing experi-ments. SVM swing/no swing prediction accuracy, coverage, SVM BPREF, and threshold BPREF are provided for the three data sets at various relevance threshold levels (τ). Bold accuracy values indicate a statistically significant improvement over a classifier that always predicts the majority class according to a one-tailedt-test at the p <0.05level.
the ads returned when no swing mechanism is used (i.e.,
τ =∞). If the swing mechanisms are truly effective, then, not only will ads be shown for fewer queries, but the ads returned should also generally be more relevant. In Table 2, BPREF values marked with a† indicate a statistically sig-nificant improvement compared to always showing ads. As we see from the results, the SVM approach is significantly better for 8 out of 12 settings, whereas thresholding is sig-nificantly better only 5 out of the 12 settings. The SVM ap-proach was effective for both content match and sponsored search, while thresholding was only effective on the spon-sored search data. This behavior may be due to the fact that many of the SVM features are unreliably estimated in the case of sponsored search, since the query is so sparse. As mentioned before, we hypothesize that augmenting the query with search results or other external knowledge would likely improve the effectiveness of the SVM approach on the SS data set. Therefore, these results suggest that the two proposed swing mechanisms are, indeed, effective at improv-ing the relevance of the ads beimprov-ing returned. As expected, as coverage increases, predicting swing or not swing becomes less useful. In situations where recall is unimportant, and very high precision is necessary, a swing mechanism could be very powerful.
Next, we investigate which of the two swing approaches returns the most relevant ads. In Table 2, a bold BPREF value indicates a statistically significant improvement over the other swing approach. For example, for the CM2 data set, with τ = 2.2, the SVM approach is significantly bet-ter than the thresholding approach. The results are simi-lar to our previous observations, that the SVM approach is more effective than the thresholding approach for the con-tent match data sets, and that the thresholding method is more effective on the sponsored search data set. However, it is important to notice that the thresholding approach is
Data τ AccuracySVM CoverageQuery Thresh.BPREFSVM
CM1 1.4 87.94 14.1 .1478 .2219† 1.8 87.90 33.7 .1497 .2019† 2.2 87.94 49.7 .1653 .1917† 2.6 86.43 58.3 .1677 .1929† ∞ 100 100 .1488 .1488 CM2 1.4 94.02 1.1 .1589 .1068 1.8 81.69 2.9 .1182 .1382 2.2 70.53 22.5 .1330 .1804† 2.6 72.35 86.7 .1059 .0943 ∞ 100 100 .0863 .0863 SS 3.0 82.71 4.1 .2500† .3889† 3.5 71.96 13.6 .2339† .2802† 4.0 69.63 54.9 .1650† .1539† 4.5 73.99 86.57 .1272 .1254 ∞ 100 100 .1148 .1148
Table 3: Summary of the swing/no swing feature se-lection experiments. Bold accuracy values indicate a statistically significant improvement over a classifier that always predicts the majority class according to a one-tailed t-test at thep <0.05level.
only significantly better than the SVM approach for 1 out of the 12 settings. This suggests that the SVM approach, de-spite its limitations on the sponsored search data, is superior to the simple thresholding approach. Therefore, considering the entire set of ad candidates, as is done in the SVM ap-proach, results in a more robust model than considering each ad separately, as the threshold approach does.
3.5
Feature Selection
When performing a failure analysis of our SVM, we found that many of our features are very noisy. In addition, by the very nature of how they are defined, many of the features are also strongly correlated with each other. Both of these factors make it difficult to learn a highly effective classifi-cation model. Therefore, we investigate how feature selec-tion can be used to alleviate these issues. Feature selecselec-tion is commonly used for tasks that have many noisy features and/or many highly correlated features. Here, we use a sim-ple greedy feature selection strategy that aims to directly maximize accuracy. During each iteration, the feature that increases accuracy the most is added to the model.
In our experiments, we use the greedy feature selection strategy to choose 10 features for each model learned. We chose to use 10 features because preliminary experiments suggested that diminishing returns, in terms of improved accuracy, start to set in after just 5-10 features have been selected.
Table 3, which is analogous to Table 2, shows the results of our feature selection experiments. We first compare the accuracy of the SVM (“SVM Accuracy” column) with and without feature selection. As the results show, the accu-racy of the SVM with feature selection is consistently better than the accuracy of the SVM without feature selection. In fact, the feature selection accuracy is never worse than the non-feature selection accuracy. The improvements are the most dramatic on the CM1 data set, which saw relative im-provements of up to 12%. All of the imim-provements on this data set were statistically significant, as well. These results
support our hypothesis that our feature set contains many noisy and correlated features and that feature selection can be used to consistently improve classification accuracy.
Next, we investigate whether the improved classification accuracy translates into improved BPREF. Although it is possible to compare the BPREF values in Table 3 with the BPREF values in Table 2, such a comparison is not com-pletely fair, because the coverage in the two tables is dif-ferent. Therefore, we proceed as before, and compare the BPREF of the SVM approach against the BPREF of the threshold approach. The SVM approach, without feature se-lection, outperforms (or equals) the threshold approach on 7 out of 12 settings ofτ (4 out of 12 were significantly better). With feature selection, the SVM approach outperforms the threshold approach for 8 out of 12 settings ofτ (3 out of 12 were significantly better). Therefore, from a high level, there is little improvement in BPREF as the result of using feature selection, despite the improvement in SVM accuracy. This may be the result of our ad ranking system producing poor rankings for the queries that the SVM swings on. Somewhat paradoxically, even if the SVM could predict which queries to swing on with 100% accuracy, there is no guarantee that the resulting BPREF will be perfect, or even better than a less accurate swing model, since the ad ranking system it-self is not perfect and has limitations. Therefore, the swing prediction model can only improve overall ad quality to a certain point. Beyond that point, improvements in effec-tiveness can only be achieved by improving the underlying ad ranking system.
Finally, it should be noted that feature selection can not only help improve effectiveness, but it can also improve the efficiency of swing prediction at test time, since the num-ber of features that need to be computed is significantly reduced. As we described, our feature selection models con-sist of only 10 features versus 402 when no feature selection is performed.
Therefore, our results suggest that feature selection is use-ful for improving the accuracy and efficiency of the SVM-based swing model. Improvements in ad quality can be achieved, as well, as long as the underlying ad ranking sys-tem is highly effective in the first place.
3.6
Feature Analysis
Thus far, we have only investigated high level evaluation measures, such as accuracy and BPREF. These measures provide insights into how our overall system works, but it does not reveal which features in our model are the most useful. We analyzed the usefulness of the features in our model in two ways.
First, we looked at which features tend to get chosen early on during the feature selection process we just described. This analysis provides insights into the general importance of each feature and how discriminative each is for predict-ing swpredict-ing or no swpredict-ing. We found that four features were consistently chosen first during training. These features are: 1) mean cosine similarity computed over the whole ad, 2) semantic class entropy, 3) mean cosine similarity over the ad title, and 4) meanχ2. The depth at which these features were computed varied widely, however we found that depths 5 and 10 were selected the most during the early stages of training.
In addition to looking at the order in which features are selected, we also investigate how well each feature correlates
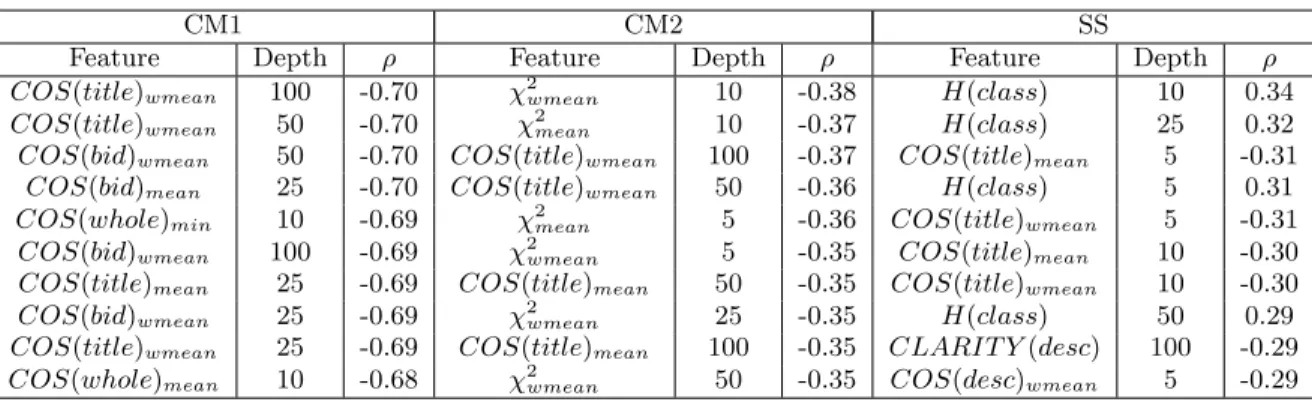
with the ground truth (result set quality). Table 4 lists the ten features with the largest absolute correlation (|ρ|) for each data set. When analyzing the sign of the correlations listed in the table it is important to recall that low judgments are good and high judgments are bad. Since there are so many features, it is impossible to give a detailed analysis of each. Instead, we note some general observations.
In all of our experiments, the cosine similarity feature, applied to ad titles, showed strong correlation. Although not as strong, cosine similarity computed over the ad description and ad bid phrases also exhibited strong correlations. The overlap, translation, PMI, andχ2feature types also showed relatively strong correlations, but not as consistently as the cosine similarity features.
The entropy, computed using semantic classes, was con-sistently the best of the topical cohesiveness measures. This result is interesting, in that it shows that the distribution over semantic classes in the top ranked ads are more pre-dictive of ad quality than the actual terms that make up the ads themselves. In addition, the entropy measure al-ways had stronger correlations than the clarity score. Since the clarity score has been shown to be a good predictor for result set quality in general search [12], our result suggests that entropy may also be useful for the task. The topical cohesiveness measures are more important on the sponsored search data set. As mentioned before, this probably results from the fact that cosine similarity and other related features are computed more accurately for content match, where the query is an entire Web page. Since the cohesiveness mea-sures are agnostic with respect to query representation, they are more stable across tasks.
No statistically significant correlation was found to exist between the aggregated bid price features and average ad quality. This does not necessarily mean that there is no correlation between bid price and ad quality, only that no correlation exists for ourmatched ads.
3.7
Learning from Clicks
One interesting option for training the kind of models discussed above involves using click-through data directly, from users feedback, rather than editorial judgments (e.g., see [17]). This might prove advantageous for at least two rea-sons. First, learning on click-data allows indefinitely large and up-to-date training sets without the need for costly hu-man editorial judgments to be made. Second, in online ad-vertising the quality of a system is ultimately measured in terms of clicks, thus optimizing accuracy on clicks means optimizing directly the desired global objective function. For learning on click-dataonlinelearning, rather thanbatch
learning, might be preferable, since the training data is never considered all at once, but only one item at a time. In an exploratory experiment in this direction, we evaluated an online perceptron algorithm [9] in place of SVMs and found the same patterns of results with only minor degradations in classification accuracy. However, we are unable to include these results due to space constraints. Thus, our prelim-inary experiments suggest that online learning is a viable alternative for handling very large training sets using clicks, and a fruitful area for future work.
4.
RELATED WORK
Research in online advertising is rapidly growing. Web advertising presents several engineering and modeling
chal-CM1 CM2 SS
Feature Depth ρ Feature Depth ρ Feature Depth ρ COS(title)wmean 100 -0.70 χwmean2 10 -0.38 H(class) 10 0.34 COS(title)wmean 50 -0.70 χmean2 10 -0.37 H(class) 25 0.32 COS(bid)wmean 50 -0.70 COS(title)wmean 100 -0.37 COS(title)mean 5 -0.31 COS(bid)mean 25 -0.70 COS(title)wmean 50 -0.36 H(class) 5 0.31 COS(whole)min 10 -0.69 χmean2 5 -0.36 COS(title)wmean 5 -0.31 COS(bid)wmean 100 -0.69 χwmean2 5 -0.35 COS(title)mean 10 -0.30 COS(title)mean 25 -0.69 COS(title)mean 50 -0.35 COS(title)wmean 10 -0.30 COS(bid)wmean 25 -0.69 χwmean2 25 -0.35 H(class) 50 0.29 COS(title)wmean 25 -0.69 COS(title)mean 100 -0.35 CLARIT Y(desc) 100 -0.29 COS(whole)mean 10 -0.68 χwmean2 50 -0.35 COS(desc)wmean 5 -0.29
Table 4: The ten features that correlate the strongest with the average ad quality scores. For each feature, the feature type, depth, and correlation (ρ) are given. Values reported are Spearman rank correlations. All correlations are statistically significant (i.e.,ρ6= 0) at the p <0.05level.
lenges and has generated research on different topics, such as global architecture design choices [2], the microeconomics factors involved in ranking [13], and the evaluation of the effectiveness of ad placing systems; e.g., by analyzing click-through rates [14] or individuals’ awareness beyond con-scious response [28].
To a large extent sponsored search can be framed as tra-ditional document retrieval, where the ads are the “docu-ments” to be retrieved given a query. Thus, one way of ap-proaching content match is to represent a Web page as a set of keywords in order to frame content match as a sponsored search problem. From this perspective, Carrascoet al. [7] proposed clustering of bi-partite advertiser-keyword graphs for keyword suggestion and identifying groups of advertisers, while Yihet al.[27] proposed a system for keyword extrac-tion from content pages for the task of Web advertising.
In general, the effectiveness of a Web ad is strongly af-fected by the level of congruency between the ad and the context. One of the main problems in matching ads with queries or Web pages is that ads contain very little text. In order to alleviate this problem, also called the impedance coupling problem, Ribeiro-Netoet al.[24] proposed to gen-erate an augmented representation of the target page by means of a Bayesian model built over several additional Web pages. Broderet al.[3] proposed a different solution to this problem which aims at improving simple string matching by taking into account topical proximity by using a semantic taxonomy. Ciaramitaet al. [10] use statistical correlations between the terms in ads and the terms in the target page, in a machine-learned ranking framework. In this work terms were associated if they had a high correlation in an external corpus, such as a query log, or the Web at large. Murdocket al.[23] use machine translation scores in a machine-learned ranking function to improve matching between ads and text. Lacerdaet al.[18] focused on the selection of good ranking functions for ads matching and use a genetic programming algorithm to select a ranking function – a non-linear com-bination of traditional IR measures – which maximizes the average precision on the training data.
Predicting the quality of the set of ads for a given query is related to the problem of predicting the performance of a query given a collection. If the ads are not relevant, the set of ads is less likely to be topically cohesive. Many of the fea-tures used in this paper are similar to metrics developed to predict query performance. Theclarity score was originally
presented as a predictor of a query’s ambiguity with respect to a given collection [12]. The idea is that the results at the top of a ranked list for an unambiguous query will be focused on a single (presumably relevant) topic, whereas for an am-biguous query, the topic of the results will be much more dif-fuse. Zhou and Croft [29] propose three metrics to evaluate a query’s specificity with respect to the corpus. Weighted information gain weights the information gain between a sample of the collection statistics, and the top ranked re-sults, weighted by the rank of the results. Query feedback
measures the similarity between a query generated by sam-pling from the retrieved documents, and the original query.
First rank change measures how often the top ranked doc-ument of a series of perturbations of the docdoc-uments in the ranked results list, remains the top ranked documents when the results are re-retrieved.
The task we deal with in this paper is also related to the work of Jinet al. [15], who investigated the problem of identifying “sensitive” Web pages in order to improve adver-tisements placement. A sensitive Web page is one whose content; e.g., a report about a catastrophic event, might be inappropriate for placing ads because it might annoy/upset the user with potential negative effects on the advertiser. Jin
et al. propose to solve this issue using an appropriate topical taxonomy in which each node, in addition to a topic label, is associated also with a binary “sensitive/non-sensitive” label. A training corpus of Web pages labeled according to the tax-onomy is created, thus a classifier can be trained to identify sensitive pages by classifying Web pages into the taxonomy. Jinet al. show that in this way the sensitive classification task with an accuracy around 80%.
However, our perspective differs from that of Jin et al.
in that our goal is not to decide whether to show an ad based on the sensitive aspects of the page. We address a different problem, that of deciding if ads should be displayed based on individual ad relevance (thresholding approach) or their aggregate quality (SVM approach) in order to minimize the risk of demanding the user’s attention with respect to inappropriate information.
5.
CONCLUSIONS
In this paper, we described two methods for deciding whe-ther to show ads in response to a query (sponsored search) or a target Web page (content match). We described and mo-tivated the problem and explained how it differs from the
problem of ranking ads. The thresholding approach used a simple global score threshold to determine if ads, indi-vidually, should be shown or not. Our machine learning approach, which was based on learning an SVM swing/no-swing model, made use of a wide range of features, including query/ad similarity features and topical cohesiveness fea-tures, to analyze the candidate set of ads as a whole.
Our experimental results showed that the SVM model is capable of achieving good swing/no swing prediction accu-racy on content match and sponsored search data sets, es-pecially when a greedy feature selection strategy was used. Furthermore, it was observed that both the thresholding and SVM model could significantly improve relevance over a sys-tem that always showed ads. Overall, the SVM approach tended to achieve better results for content match, whereas the thresholding approach was more effective for sponsored search data. Additionally, we analyzed how well the SVM features correlated with ad set relevance and showed that co-sine similarity and the entropy of the semantic classes from the top ranked ads are strong predictors of ad set quality.
There are several interesting avenues for future investi-gation and work. One possible future direction is to de-velop better features, especially for the sponsored search case when the query has such a sparse representation. It may also be worthwhile to move from a binary classifica-tion model to a more fine-grained type of classificaclassifica-tion or regression model. One of the most important yet difficult, future directions is to build a more appropriate cost function that incorporates aspects other than just relevance. Such a cost function would have to take into account user fatigue, ad appropriateness, click-through rates, expected revenue, among many other complex variables. Finally, our model is very general, and even though we only applied it to online advertising, there is no reason why a similar model could not also be applied to other tasks, such asad hoc retrieval or web search.
6.
REFERENCES
[1] Y. Al-Onaizan, J. Curin, M. Jahr, K. Knight, J. Lafferty, D. Melamed, F.-J. Och, D. Purdy, N. A. Smith, and D. Yarowsky. Statistical machine translation, final report, JHU workshop, 1999.
[2] G. Attardi, A. Esuli, and M. Simi. Best bets, thousands of
queries in search of a client. InWWW, Alternate Track,
2004.
[3] A. Broder, M. Fontoura, V. Josifovski, and L. Riedel. A
semantic approach to contextual advertising. InSIGIR,
pages 559–566, 2007.
[4] P. F. Brown, J. Cocke, S. A. Della Pietra, V. J. Della Pietra, F. Jelineck, J. D. Lafferty, R. L. Mercer, and P. S. Roossin. A statistical approach to machine translation. Comp. Linguistics, 16(2):79–85, 1990.
[5] P. F. Brown, S. A. Della Pietra, V. J. Della Pietra, and R. L. Mercer. The mathematics of statistical machine
translation: Parameter estimation.Computational
Linguistics, 19(2):263 – 311, 1993.
[6] C. Buckley and E. M. Voorhees. Retrieval evaluation with
incomplete information. InSIGIR, pages 25–32, 2004.
[7] J. Carrasco, D. Fain, K. Lang, and L. Zhukov. Clustering of
bipartite advertiser-keyword graph. InICDM Workshop on
Clustering Large Datasets. IEEE Comp. Soc. Press, 2003. [8] P. Chatterjee, D. L. Hoffman, and T. P. Novak. Modeling
the clickstream: Implications for web-based advertising
efforts.Marketing Science, 22(4):520–541, 2003.
[9] M. Ciaramita, V. Murdock, and V. Plachouras. Online
learning from click data for sponsored search. InWWW,
pages 227–236, New York, NY, USA, 2008. ACM.
[10] M. Ciaramita, V. Murdock, and V. Plachouras. Semantic
associations for contextual advertising.International
Journal of Electronic Commerce Research—Special Issue on Online Advertising and Sponsored Search, 2008. To Appear.
[11] S. Cronen-Townsend, Y. Zhou, and W. B. Croft. Predicting
query performance. InSIGIR, 2002.
[12] S. Cronen-Townsend, Y. Zhou, and W. B. Croft. Predicting
query performance. InSIGIR, 2002.
[13] J. Feng, H. Bhargava, and D. Pennock. Implementing sponsored search in web search engines: Computational
evaluation of alternative mechanisms.INFORMS Journal
on Computing, 19(1), 2007.
[14] K. Gallagher, D. Foster, and J. Parsons. The medium is not the message: Advertising effectiveness and content
evaluation in print and on the web.Journal Of Advertising
Research, 41(4):57–70, 2001.
[15] X. Jin, Y. Li, T. Mah, and J. Tong. Sensitive webpage
classification for content advertising. InProc. of the 1st
Int’l Workshop on Data Mining and Audience Intelligence for Advertising, pages 28–33, 2007.
[16] T. Joachims.Learning to Classify Text Using Support
Vector Machines: Methods, Theory and Algorithms. Kluwer Academic Publishers, 2002.
[17] T. Joachims. Optimizing search engines using clickthrough
data. InProc. of the ACM Conf. on Knowledge Discovery
and Data Mining. ACM, 2002.
[18] A. Lacerda, M. Cristo, M. Goncalves, W. Fan, N. Ziviani,
and B. Ribeiro-Neto. Learning to advertise. InSIGIR,
pages 549–556, 2006.
[19] V. Lavrenko and W. B. Croft. Relevance-based language
models. InSIGIR, 2001.
[20] R. Manmatha, T. Rath, and F. Feng. Modeling score distributions for combining the outputs of search engines. In SIGIR, pages 267–275, New York, NY, USA, 2001. ACM. [21] D. Metzler, S. Dumais, and C. Meek. Similarity measures
for short segments of text. InECIR, pages 16–27, 2007.
[22] M. Montague and J. A. Aslam. Relevance score
normalization for metasearch. InCIKM, pages 427–433,
New York, NY, USA, 2001. ACM.
[23] V. Murdock, M. Ciaramita, and V. Plachouras. A noisy
channel approach to contextual advertising. InProc. of the
1st Int’l Workshop on Data Mining and Audience Intelligence for Advertising, 2007.
[24] B. Ribeiro-Neto, M. Cristo, P. Golgher, and E. D. Moura. Impedance coupling in content-targeted advertising. In SIGIR, pages 496–503, 2005.
[25] M. Sahami and T. D. Heilman. A web-based kernel function for measuring the similarity of short text snippets.
InWWW, 2006.
[26] C. Wang, P. Zhang, R. Choi, and M. D. Eredita. Understanding consumers attitude toward advertising. In Proc. of the 8th Americas Conf. on Information System, pages 1143–1148, 2002.
[27] W. Yih, J. Goodman, and V. Carvalho. Finding advertising
keywords on web pages. InWWW, 2006.
[28] C. Y. Yoo.Preattentive Processing of Web Advertising.
PhD thesis, University of Texas at Austin, 2006.
[29] Y. Zhou and W. B. Croft. Query performance prediction in