“European Framework for Measuring Progress”
e-Frame
www.eframeproject.eu
SP1-Cooperation
Coordination and support actions (Coordinating actions) FP7 SSH-2011-3
Grant Agreement Number 290520 SSH.2011.6.2-1
Deliverable D2.5
Dissemination level: PUThe e-Frame Convergence Report:
Taking Stock of the Measurement Systems for Sustainable
Development and the Opportunities for Harmonisation
Authors
: Jan Pieter Smits, Rutger Hoekstra and Niels Schoenaker1June 19th 2014
1Jan Pieter Smits and Rutger Hoekstra are affiliated to Statistics Netherlands. Niels Schoenaker
Deliverable D2.5
The e-Frame Convergence Report:
Taking Stock of the Measurement Systems for Sustainable
Development and the Opportunities for Harmonisation
Summary
Over the last four decades has seen exponential growth of the number of systems to measure sustainable development (SD). Initiatives are not only restricted to the national level, but have also been developed for cities, regions, companies and products. This shows that many stakeholders now recognise that “you cannot manage what you cannot measure”. However, all these measurement systems are using different methodologies and indicators. There is therefore no common “language” for these stakeholders with which to communicate.
This report argues that a harmonisation of the measurement systems is needed. Several types of convergence are identified: conceptual convergence (of the terms and definition used), horizontal convergence (at a single measurement level such as national, regional, company and product levels) and vertical convergence (convergence between measurement levels).
Given the enormous amount of initiatives, the Convergence Report focuses on the term sustainable development (as opposed to other concepts such as well-being or green growth). The attention for SD has intensified because of the Post-2015 process which aims to create a set of Sustainable Development Goals (SDGs) in 2015. Also a number of important harmonisation steps have already been undertaken, such as the Stiglitz Report and the joint work of the UNECE/ Eurostat/OECD (Conference of European Statisticians Recommendations for Measuring Sustainable Development).
A new database has been created to compare 12 composite indicators and the indicator systems of 43 countries/institutes. These 55 systems are compared to the CES recommendations framework and the most popular themes and indicators are identified. This is important input for a convergence process. The convergence report ends with a number of recommendations about how to move the convergence agenda forward.
Keywords: progress, sustainable development, well-being, GDP and Beyond, Beyond GDP, capital, natural capital, social capital, human capital, economic capital, SEEA, CES recommendations, Task Force on Measuring Sustainable Development (TFSD), sustainability, human well-being
Table of Contents
1. Introduction ... 5
1.1 Conceptual, Horizontal and Vertical Convergence ... 6
1.2 This report: Focus on Sustainable Development at the National Level .. 8
1.3 Contents of this Report ... 8
2. Convergence of the Measurement of Sustainable Development ... 10
2.1 Introduction ... 10
2.2 History of Measuring Sustainable Development ... 10
2.3 History of International Harmonization Initiatives ... 12
2.4 Beyond the Measurement of Sustainable Development ... 14
3. CES Recommendations on Measuring Sustainable Development ... 17
3.1 Conceptual Basis ... 17
3.2 Sustainable Development Indicators ... 17
4. Sustainable Development: Convergence of Themes ... 20
4.1 Comparison of Composite Indicators at Thematic Level ... 20
4.2 Comparison of SDI Sets at Thematic Level ... 21
5. Sustainable Development: Convergence of Indicators ... 23
5.1 Comparison of SDI Sets at Indicator Level ... 23
5.2 Comparison of SDI Sets of “Higher” and “Lower” Income Countries . 24 6. Way Forward ... 27
References ... 29
Annex I. Database of Measurement Systems ... 34
1. Introduction
Throughout the last decade the world has been faced with a series of crises of an economic, financial and ecological nature. Increasingly, the awareness is growing that these crises stem, in part, on a too narrow focus on economic goals. There is a wide-spread feeling that lessons should be learnt from these experiences and that a new growth model, which take account of human well-being and its sustainability, is needed.
This increasing awareness of a greater focus on human well-being and its sustainability clearly manifested itself during the Rio+20 Conference in 2012. In the so-called Post-2015 agenda, which was launched during this conference, it was decided to formulate Sustainable Development Goals (SDG’s) to replace or supplement the existing Millennium Development Goals (MDG’s). The EU plays a crucial role in this initiative, especially because of the experience Europe has with the longstanding programme “GDP and Beyond”, which focusses on influencing societal developments by means of policy changes in order to enhance human well-being. Besides, the EU has important experience in the setting and tracking of policy goals, see the Lisbon Agenda and the present Europe 2020 strategy.
In order to foster the well-being of EU citizens in the long run, a new statistical information system is needed which goes beyond the traditional economic measures, notable Gross Domestic Product (GDP). The system needs to inform society in general, and policy makers in particular, as to where the EU is standing in terms of its well-being and to what extent European society is on a sustainable growth path. A further convergence in SDI sets within Europe is needed as apart from Eurostat’s SDI set, many individual member states have their own SDI sets, sometimes linked to their national sustainability policy strategies.There are three reasons why such convergence is needed:
• One voice. There is no consensus about an alternative to GDP. In fact,
this paper shows that there is a minumum of 55 different ways to measure sustainable development at the national level.
• International comparison. Harmonisation of the different systems makes
it easier for international comparisons between countries. For the national accounts, international comparison is governed by the 700-page SNA document which provides an overview of the conceptual basis of the accounts as well as the measurement practices. No such documents exists for the measurement of sustainable development.
• Targets for sustainable development. When there is common
understanding of the measurement of sustainable development, it makes it easier to establish international goals and targets to improve society in a sustainable way. An influential example of target-setting is the Post2015 process which will lead to set of Sustainable Development Goals (SDGs).
A convergence of measurement systems is therefore of vital importance in order to arrive at a convincing alternative to GDP. One of the reasons why GDP has become such a powerful statistic used for policy purposes is that it is an official
statistic, that there is a general consensus on how to measure it, and that all countries measure it along the same lines. Another reason why internationally comparable data on sustainable development (SD) are so important to have is that SD is a global phenomenon. Problems regarding SD can only be tackled when we have reliable information on SD and its various aspects, for a large set of countries, on the basis of comparable indicators. The aim to foster a further convergence of measurement is very much in line with the recommendations of the Rio+20 conference. Paragraph 38 of the outcome document The future we want of the Conference indicates that “We recognize the need for broader progress to complement gross domestic product in order to better inform policy decisions, and in this regard we request the United Nations Statistical Commission, in consultation with relevant United Nations system entities and other relevant organisations, to launch a programme of work in this area building on existing initiatives”. Of course, such a measurement system should be a flexible one, catering for the (different) needs of the least developed countries and higher-income countries.
Stressing the importance of convergence toward a common measurement standard should, however, not be interpreted as a signal that national or regional indicator sets are irrelevant. On the contrary, in case of specific national or regional SD strategies, specific indicator sets are needed to track the effects of the policy initiatives. Attempts to arrive at an international standardisation of measuring SD are not necessarily aimed against existing methods and systems of measurement.
This Report outlines the possibility of such a convergence and is mainly based on statistical work done within the European system of official statistics. This indicator set is based on the conceptual framework of the Task Force for Measuring Sustainable Development (a joint UNECE/Eurostat/OECD Task Force) which has been endorsed by the Commission of European Statistician (CES) in June 2013. Most of these data can be derived from Eurostat’s statistical databases . Moreover, these indicators are relevant to the policy domains addressed in the EU “GDP and Beyond” initiative.
1.1 Conceptual, Horizontal and Vertical Convergence
This report speaks about convergence so it is good to have a closer look at what this term means, and identify how different types of convergence might be classified.
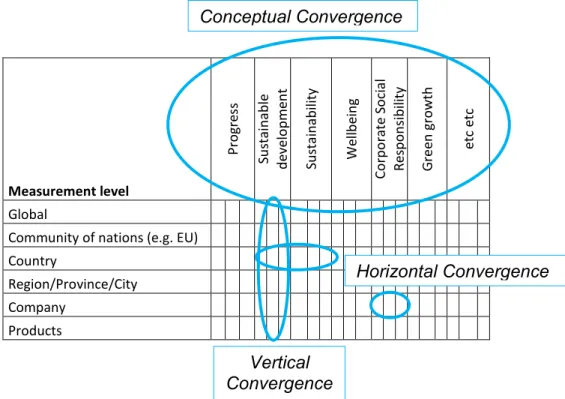
In figure 1.1 three types of convergence have been distinguished. In the column of the figure are a couple of the terms that are used in the “GDP and Beyond” debate. The list of not exhaustive terms such as “quality of life”, “footprints”, “green economy”, “happiness” and a plethora of other terms are used in the area of “GDP and Beyond”. This is of course, the a major problem: the lack of agreement on the core terms and definitions in the debate (and the relationship between those terms). The first type of harmonisation shown in figure 1.1 is therefore conceptual convergence. The confusion about terminology often
seriously hampers the debate and this is therefore vital step in developing a “common” language with which to move these development forward.
The rows of figure 1.1 show a second dimension to the convergence process: the measurement level of “GDP and Beyond”. Measurement systems have been created at various spatial scales to measure the performance in a territory/area. This does not happen only at the national level but also various other spatial scales. Measurement of the performance of companies in terms of corporate social responsibility (CSR) are have also been developed, as well as impacts of product (which is relevant for both companies as well as consumers). The dimension of the measurement level leads to two additional types of convergence: horizontal convergence and vertical convergence
Measurement level P ro gr es s Su st ai n ab le d ev el o p m en t Su st ai n ab ili ty W el lb ei n g C o rp o ra te So ci al R es p o n si b ili ty G re en gr o w th et c et c Global
Community of nations (e.g. EU) Country
Region/Province/City Company
Products
Figure 1.1 Conceptual, Horizontal and Vertical Convergence
Horizontal convergence is a process whereby the measurement (usually of a single concept) is harmonised at a single measurement level. For example, in chapter 3, the CES recommendations are discussed. This is an joint undertaking of the UNECE/Eurostat and OECD which is aimed at harmonising the measurement of the terms “sustainable development” and “sustainability” at the national level (circled in figure 1.1). Another example of horizontal convergence is the role of the Global Reporting Initiative (GRI) has in the harmonisation of CSR at the company level (also circled in figure 1.1).
Convergence is not only needed on the level of nation states, but also at other levels. Vertical convergence is focused on aligning measurement initiatives
Conceptual Convergence
Horizontal Convergence
Vertical Convergence
(“Measuring What Matters”) and the “Alignment project” initiated in the Netherlands.2
Although it is useful to think of convergence processes in this way, it is also important to realise that in practice, they may happen simultaneously. For example, horizontal convergence at the national level often coincides with conceptual convergence of the concepts being measured.
1.2 This report: Focus on Sustainable Development at the National Level
The “GDP and Beyond” debate is very board and encompasses a wide range of concepts, which are backed up by an even larger body of academic and “grey” literature. It is beyond the scope of this report to provide a take stock of all concepts at all measurement levels. This is simply not feasible. Instead we have chosen to focus in this report on the convergence on a single concept: namely, sustainable development. There are a number of reasons why this is good starting point for the discussion of convergence:
• Urgency. In the Post2015 agenda, the ambition has been formulated to
create a systems of global Sustainable Development Goals (SDGs). This means that this concept is high on the political and measurement agenda.
• International initiatives. Over the last decade or so a number of
international processes, such as the Stiglitz Commission and CES recommendations, have made a lot of progress with respect to the conceptual convergence of SD (see section 2.3).
• Concepts may be broadened to other fields. The conceptual convergence
that has taken place for SD may also be used in other areas of “GDP and Beyond” (see section 2.4)
• The SD agenda also incorporates the well-being agenda. The
measurement of SD is now understood to also include the wellbeing of the current generations. This means that, the wellbeing agenda, which is influential in some countries (UK) and institutes (OECD, Eurostat) is an integral part of the conceptual framework (see section 2.4)
1.3 Contents of this Report
Chapter 2 of this report provides an introduction to the history of SD measurement and its harmonisation. Furthermore, the conceptual model that has been created for measuring SD is linked to other concepts in the “GDP and beyond” debate such as green growth, progress and wellbeing.
2This project is financed by the Dutch Ministry for Infrastructure and the Environment. The
project links measurement systems at the national (CES recommendations-Statistics Netherlands), company (Global Reporting Initiative) and product level (The Sustainability Consortium).
Since the last major step in the harmonisation process is the endorsement of the CES Recommendations on Measuring Sustainable Development, this measurement system is discussed in Chapter 3.
The chapters 4 and 5 subsequently investigate the extent of convergence towards the SD themes and indicators described by the CES recommendations. The work is based on a comprehensive stocktaking exercise of 55 measurement systems for SD at the national level. All in all, over 3000 indicators have been linked in a SD indicator database. This empirical investigation shows that for some themes and indicators convergence is already well on its way, and on what topics substantial work still needs to be done.
Chapter 6 formulates how the “GDP and Beyond” community might move forward in the area of convergence.
2. Convergence of the Measurement of Sustainable Development
2.1 Introduction
There is a widespread understanding that society needs a better statistical ‘compass’ to shift emphasis from measuring economic phenomena to measuring SD. Focusing only on economic efficiency and the material aspects of life does not necessarily foster sustainable human well-being. For decades societal and public policy debate has been primarily informed by the economic key indicator GDP. This narrow focus has enabled the current situation where the world faces a series of crises, among which are the climate and the financial crisis. Therefore, society is in need of a compass which truly focuses on people’s well-being in the broadest sense of the word, including all dimensions of SD.
As this chapter shows, initiatives to create an alternative SD compass have a history of over four decades, while the harmonisation efforts are somewhat more recent (2005). The two developments (measurement and harmonisation) are discussed in section 2.2 and 2.3 respectively. In section 2.4, shows that the conceptual model that has emerged is also applicable to other concepts in the “GDP and Beyond” debate.
2.2 History of Measuring Sustainable Development
We start the history of measuring SD around 1970 when for the first time indicators were proposed that “corrected” aggregates from the national accounts – the statistical framework that governs the measurement of GDP. The system of national accounts was developed and harmonised in the 1930-1950s, and although they were highly successful, they also received criticism for the aspects that were included and excluded in the estimation of GDP. Hence, academics started to think of corrections to the national accounts.
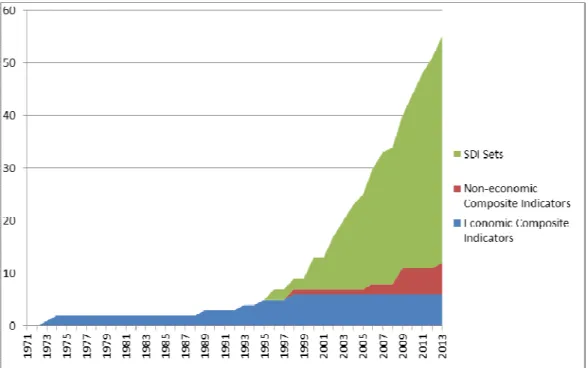
Figure 2.1 Cumulative number of measurement systems for sustainable development
Figure 2.1 charts the cumulative number of measurement systems on SD, which have emerged from the early 1970s onwards. The way in which this database of measurement systems has been constructed is explained in annex I, but for now it is sufficient to know that the that the year in which the measurement system was first proposed is the basis for the cumulative graph (revisions of these systems have not been included).
Three types of measurement systems have been distinguished:
1. Economic composite indicators measure SD in a single index, by “correcting’’ aggregates from the national accounts. For example, the Measure of Economic Welfare (MEW) (Nordhaus & Tobin, 1973) adjusts GDP by adding monetary estimates for leisure time, unpaid housework, and other aspects that have positive well-being effects and by deducting monetary values for phenomena that have a negative impact on human well-being such as commuting, defence, pollution and other environmental damage.
2. Non-economic composite indicators are also single indices which are constructed by using mathematical weighting techniques. The Human develop Index (HDI), a weighted average of educational attainment, income and life expectancy, is the most widely used composite of this kind. 3. Sustainable development indicator (SDI) sets. The philosophy behind these
sets is that SD is considered to be a multidimensional phenomenon which therefore requires a suite of indicators rather than a single number. In the European Statistical System Eurostat’s dataset for SD indicators are the most prominent example of such an indicator set.
Figure 2.1 shows that the first two decades, from the early 1970s to 1990s, were characterized by the development of economic composite indicators. Since the early 1990s the momentum has shifted from composite indicators towards sustainable development indicator (SDI) sets. The graph clearly shows a steep increase in the number of measurement system from the late 1980 and early 1990s onwards, which are primarily caused by the publication of the Brundtland report (1987) and the 1992 UN Conference on Development and the Environment in Rio de Janeiro (also known as the first Earth Summit). The Brundtland report was important in broadening the scope beyond environmental concerns to include social aspects at the national and international levels.
The adoption of “Agenda 21” during this first Rio conference stimulated the construction of SDI sets. Moreover, chapter 8 of Agenda 21 called on countries to adopt national sustainable development strategies (NSDS) (United Nations, 1992). These national strategies on SD also led to the building of SD indicator sets in individual countries and by international organizations. The first was the SDI set recommended by the United Nations Commission on Sustainable Development (CSD) in the early 1990s. The United Kingdom was the first country that developed a SDI set in 1996, after which dozens of others countries would follow.
This short history of measurement contains some encouraging and less encouraging messages . The good news is that the number of SD measures has increased considerably over the years, indicating that social interest in this topic is growing. The not-so-good news is that there are still striking differences in the ways in which SD is measured.
2.3 History of International Harmonization Initiatives
Figure 2.1 has shown the enormous increase in different measurement system for SD. However, simultaneously there have also been international efforts to harmonise the way that countries approach the measurement of sustainable development. Over the last decade three important initiatives can be distinguished:
• 2005-2009:
o Group: Working Group on Statistics for Sustainable Development (WGSSD)
o Leadership: UNECE/OECD/Eurostat
o Report: Measuring Sustainable Development (United Nations, 2009)
• 2008-2009:
o Group: Commission on the Measurement of Economic Performance and Social Progress
o Leadership: French Government
o Report: “Stiglitz report” (official title: Report of the Commission on the Measurement of Economic Performance and Social Progress)
• 2009-2014
o Group: Task force on Measuring Sustainable Development (TFSD)
o Report: “CES Recommendations” (official title: Conference of European Recommendations on Measuring Sustainable development (United Nations, 2014)
The WGSSD, a joint UNECE/OECD/Eurostat working group, was established by the Conference of European Statisticians (CES). The aim of the WGSSD was to reach a common understanding on the principles of how to measure sustainability and to develop a small core set of indicators (United Nations et al., 2008). The work was inspired by the work on the capital approach (Pearce and Atkinson 1993), also used by the World Bank (2006, 2010). The capital approach is based on the notion that resources (economic, natural, human and social capital) that we leave to future generations will determine the degree to which they will be able to meet their needs. Next to this ”future-oriented” approach, the WGSSD identified a second perspective: the integrated approach. This approach looks at the developmental potential for future generations on the basis of the capital approach, but also focuses on the needs of the current generation.
The latter perspective was employed in the Stiglitz-Sen-Fitoussi Report published in 2009 (Stiglitz et al., 2009). The Commission on the ‘Measurement of Economic Performance and Social Progress’ was led by Nobel prize winners Joseph Stiglitz and Amartya Sen, as well as the prominent French economist Jean-Paul Fitoussi. The main aim of the Commission was to identify the limits of GDP as an indicator of economic performance and social progress, and to assess the feasibility of alternative measurement tools. The Stiglitz-Sen-Fitoussi report makes an important point that would influence future harmonisation initiatives by stating that “The assessment of sustainability is complementary to the question of current well-being or economic performance, and must be examined separately.”
This last message was fundamental to the work of the joint UNECE/Eurostat/OECD Task Force on Measuring Sustainable Development (TFSD), which was the succesor to the WGSSD and started around the time that the Stiglitz report was published. The TFSD was asked to develop a framework toward measuring sustainable development at the national level. The Task Force included representatives from the lead intistutes (UNECE, Eurostat and OECD), World Bank, European Commission and ten countries. The TFSD developed a measurement framework and a list of suggested indicators to measure sustainable development at a national level. The framework is based on the work of the Brundtland, Stiglitz and WGSSD reports, but also expands it in a number of areas (see chapter 3). In June 2013, this work was endorsed by the Conference of European Statisticians (CES). The final report is named the “CES recommendations on measuring sustainable development” (United Nations, 2014).
There are already new international initiatives that may prove to be important in further convergence process. The so-called “Stiglitz II” commission has been formed and facilitated by the OECD. The United Nations Statistical Division (UNSD) has created a Friends of the Chair (FOC) group that is aimed at assisting
2.4 Beyond the Measurement of Sustainable Development
Since the CES recommendations are the last instalment in the convergence process they will be described in more detail in chapter 3. However, before finishing this chapter, we want to provide an overview of the CES conceptual framework and its relationship to important concepts in the GDP and Beyond debate. Figure 2.2 is based on the CES framework but is expanded to include concepts such as green growth and progress.
The following definitions are used:
Human well-being: A broad concept which is not confined to the utility derived from the consumption of goods and services, but is also related to people’s functioning and capabilities (i.e. the freedom and possibilities they have to satisfy their needs).
Sustainable development: Development that meets the needs of the present without compromising the ability of future generations to meet their own needs. Capital: A stock or resource from which revenue or yield can be extracted. Originally capital was seen as strictly physical, man-made capital (such as machinery and equipment, buildings and infrastructure. Gradually, the capital concept has been broadened to include natural, human and social capital.
Green growth: means fostering economic growth and development while ensuring that natural assets continue to provide the resources and environmental services on which our well-being relies.
Progress: A concept which deals with improvements in the well-being of people and households. Assessing such progress requires looking not only at the functioning of the economic system but also at the diverse experiences and living conditions of people.
Human well-being
The conceptual tour d’horizon starts with the concept of human well-being. Many different methods have been proposed to measure this concept, but there is no theoretical consensus . Essentially, human well-being is determined by what people regard as important in their lives. This can be a mix of subjective and objective measures. The concept of human well-being has many different connotations. This reflects the use of different labels in a wide range of academic fields (economics, philosophy, psychology, etc.) to describe the same or similar constructs. The report by Stiglitz, Sen and Fitoussi (SSF) (2009) acknowledges the different perspectives and provides a good summary of the various viewpoints. Instead of choosing one of these approaches, the Stiglitz-Sen-Fitoussi report proposes that the concept of human well-being be addressed using a comprehensive framework that combines the strengths of the various existing approaches.
Figure 2.2 CES Conceptual framework expanded to other “GDP and beyond” concepts
The CES Recommendations on Measuring Sustainable Development (United Nations, 2014) subscribed to this inclusive philosophy and defined the different themes of human well-being in a pragmatic way. First, the various perspectives on measuring human well-being were discussed starting out from an exploration of the academic literature. Second, a selection of themes was made based on a number of important empirical studies. This led to the identification of the following themes: subjective well-being, consumption and income, nutrition, health, labour, education, housing, leisure, physical safety, land and ecosystems, water, air quality, trust and institutions.
Later
Now
Human capital Economic capital Social capital Well-being Natural capital GDP Human capital Economic capital Social capital Well-being Natural capital GDP Green growth Well-being Sustainable development (Future-oriented view) Sustainable development (Integrated view)Progress
Sustainable development
Sustainable development is defined as a “development that meets the needs of the present without compromising the ability of future generations to meet their own needs”.
However, the CES recommendations (as did the WGSSD report) identified two different interpretation of this definition. The first is the so-called future oriented view which focuses on inter-generational issues and monitors to what extent capital stocks are being depleted, as this would undermine the possibility for society to maintain its well-being in the long run. The second perspective is the integrated view which states that the goal of sustainable development is to ensure the human well-being of both those currently living and of future generations. The integrated approach builds on the work of the Brundtland Commission, calling for attention to the fundamental trade-offs between human well-being ‘here and now’, ‘elsewhere’ and ‘later’.
Green growth
The concept of green growth takes the conventional measure of economic growth as a starting point, but on the condition that natural resources are not depleted. Studies into green growth essentially focus on the inter-relationships between economic and environmental indicators. Many of these indicators can be derived from the System of Economic and Environmental Accounts (SEEA). The OECD Green growth framework uses a similar methodology to the one shown in figure 2.2 although it also provides details with respect to productivity measures. This is however an expansion of the model which is entirely consistent to the measurement theory of the CES recommendations.
Progress
Progress can be seen as an umbrella under which the previous concepts can all be placed. The concept itself lacks any theoretical underpinning, but is due to its non-technical nature very attractive to policy makers and as a generic term. Figure 2.2 shows that the various concepts that are used in the “GDP and Beyond” debate can be conceptually linked to one and other. This is important because this provides a common language for the various stakeholders in the SD debate.
3. CES Recommendations on Measuring Sustainable Development
3.1 Conceptual Basis
A starting point for the CES framework is the Brundtland Report (1987), which defines sustainable development as development that “meets the needs of the present without compromising the ability of future generations to meet their needs”.
Furthermore, the Brundtland Report puts emphasis on the fairness of societal developments on a global scale. In an increasingly globalised world, the measurement approaches should reflect the transboundary impact of sustainability, by highlighting how a country in the pursuit of well-being of its citizens may affect the well-being of citizens of other countries. Essentially, sustainable development deals with the inter- and intra-generational aspects of human well-being, including the distribution of this well-being.
Following the Brundtland definition, three dimensions of sustainable development are distinguished, i.e. human well-being of the present generation in one particular country (referred to as ‘here and now’), the well-being of future generations (‘later’) and the well-being of people living in other countries (‘elsewhere’). This approach enables the user to distinguish to what extent the choices the present generation makes may lead to problems ‘elsewhere’ or ‘later’. These dimensions are also consistent to the conceptual categories identified by the Stiglitz and WGSSD reports, although the element of “elsewhere” is stressed more in the CES recommendations.
3.2 Sustainable Development Indicators
The CES Recommendations focuses on selecting potential sustainable development indicators grouped in three indicator sets: two large sets of 60 and 90 indicators respectively, as well as a small set of 24 indicators. The suggested indicators should be viewed as example indicators, identified on the basis of commonalities between different indicator sets and availability in international databases.
Two large indicator sets
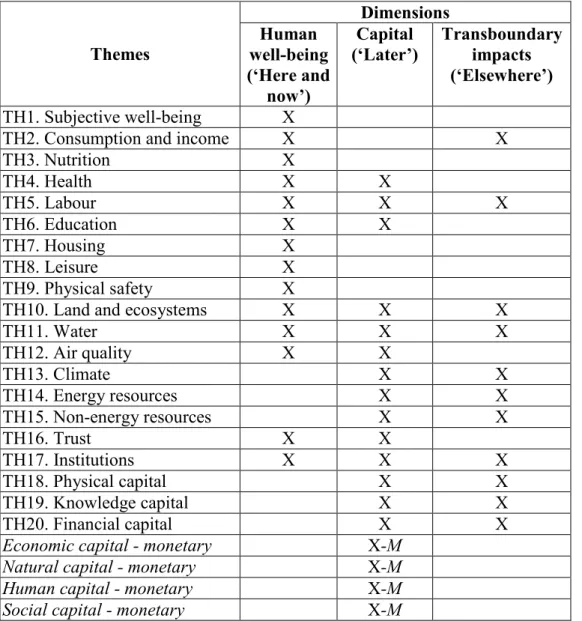
There are two ways to structure an SDI set. The conceptual and thematic categorisations can be seen as complementary. It is possible to select and use just one of them, or both simultaneously in developing a set of indicators. The relationship between the conceptual and thematic categorisations is shown in Table 3.1:
(a) In the conceptual categorisation a set of proposed indicators is presented according to the dimensions ‘here and now’, ‘later’ and ‘elsewhere’.
(b) In the thematic categorisation, the SDI set is organised according to the twenty themes mentioned earlier. Here, the indicators are no longer allocated along the dimensions ‘here and now’, ‘later’ and ‘elsewhere’. For example, education is one of the themes. The same indicators that are used to measure ‘education’ in the thematic categorisation, are used to measure both the well-being ‘here and now’ and the well-well-being ‘later’ in the conceptual categorisation. These links are marked with a cross in the relevant cells in Table 3.1. In addition to the ‘core’ indicators, indicators for the so-called ‘policy drivers’ are provided for each theme. These ‘policy driver’ indicators show how society (and policymakers) can influence the core indicators. In the case of education, for example, a ‘policy driver’ indicator could be the ‘percentage of early school leavers’.
Table 3.1 Framework for measuring sustainable development: relationship between the conceptual and thematic categorisations
Themes Dimensions Human well-being (‘Here and now’) Capital (‘Later’) Transboundary impacts (‘Elsewhere’) TH1. Subjective well-being X
TH2. Consumption and income X X
TH3. Nutrition X TH4. Health X X TH5. Labour X X X TH6. Education X X TH7. Housing X TH8. Leisure X TH9. Physical safety X
TH10. Land and ecosystems X X X
TH11. Water X X X TH12. Air quality X X TH13. Climate X X TH14. Energy resources X X TH15. Non-energy resources X X TH16. Trust X X TH17. Institutions X X X TH18. Physical capital X X TH19. Knowledge capital X X TH20. Financial capital X X
Economic capital - monetary X-M
Natural capital - monetary X-M
Human capital - monetary X-M
Monetisation
Economic, natural, human and social capital can be measured both in physical and monetary terms. The issues related to monetisation of different types of capital are discussed. For some capital stocks, monetisation methods are available within the realm of official statistics. Produced, financial capital and some natural resources are covered by the SNA 2008. The System of Environmental-Economic Accounting (SEEA) 2012 Central Framework covers a number of natural resources. The SEEA Experimental ecosystem accounting describes the approaches to monetisation of ecosystem services which is in an experimental stage.
The CES Recommendations stress that one should be cautious with the use of monetisation because of the assumptions involved with respect to future extraction rates, discount factors, and the estimation of implicit prices for stocks for which there is no market. Variation of these assumptions can often affect the outcome significantly. Capital indicators that can be measured in monetary terms are marked with ‘M’ in Table 3.1.
4. Sustainable Development: Convergence of Themes
The CES recommendations not only presented a conceptual measurement system, but also looked at the commonalities of SD themes and indicators on the basis of ten different datasets. In this chapter (and the next) this analysis is substantially broadened.
A database of 55 measurement systems (43 SDI sets and 12 composite indicators) to measure SD was created in order to investigate the commonalities between the measurement frameworks. Over 3000 indicators had to be linked to generate the results of chapter 4 and 5. Annex 1 of this report gives an overview of how the database of systems was created.
Section 4.1 focuses on the composite indicators and investigates which of the SD themes distinguished in the CES Recommendations are included. In section 4.2 the same sort of analysis is done for the 43 different SDI sets.
4.1 Comparison of Composite Indicators at Thematic Level
Table 4.1 shows to what extent the twenty themes are incorporated in the various composite indicators. Apart from “consumption and income, which are included in all composites, also most “environmental” themes are pretty well covered. However, six themes (trust, physical safety, nutrition, housing, knowledge capital and subjective well-being) are included in less than half of the composites.
4.2 Comparison of SDI Sets at Thematic Level
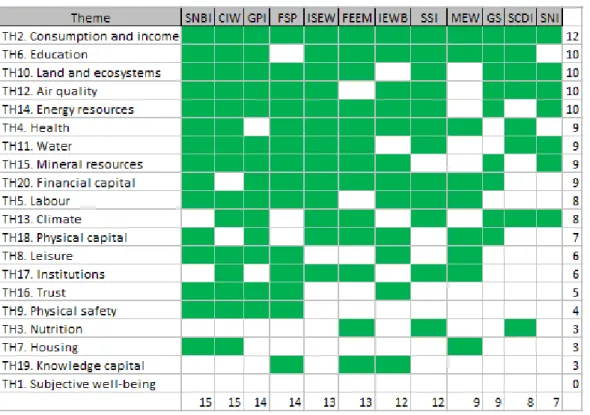
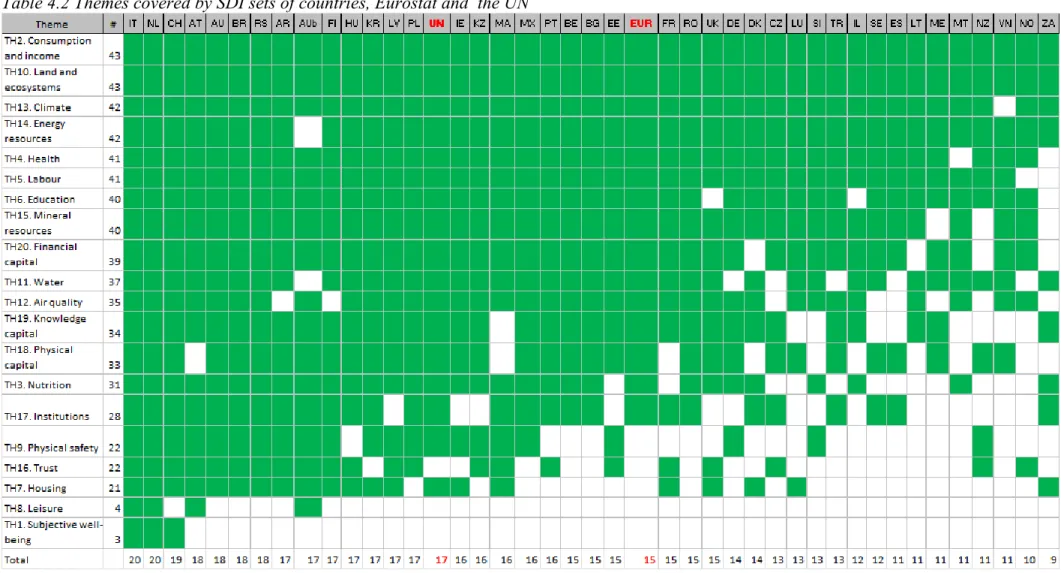
For the SDI sets a similar analysis is done. This analysis includes the SDI sets of 40 countries (Australia has two systems) and also the SDI sets of Eurostat and the United Nations. Table 4.2 presents the results per theme.
The themes ‘consumption and income’ and ‘land and ecosystems’ are covered by all SDI sets, and several other themes (climate, energy resources, health, labour) are covered by almost all of them. On the other hand, some themes like ‘subjective well-being’ and ‘leisure’, are hardly found in SDI sets.3
On average about 75% of the themes are covered by the SDI sets, indicating a that SDI sets, on average, have a broader definition of SD than composite indicators (59%). As can be seen from the table, most of the themes are taken into account by a majority of the countries. We could more or less divide the themes into three groups. First there is the group of themes that are covered by at least 75% of the countries (these are the 14 themes that are used by 33 countries or more). The themes in this group are largely to perfectly covered, which indicates a high level of consensus between countries at thematic level. The second group consists of the themes that are covered by less than 75 per cent, but which are still taken into account by many countries. According to table 4.2 this group contains four themes, namely ‘nutrition’, ‘physical safety’, ‘housing’ and ‘trust’. Although there seems to be some consensus on these themes, they are far from perfectly covered. The final group consists of the themes which are barely covered, namely ‘leisure’ and ‘subjective well-being’. In some cases this minimal coverage can be explained from a lack of data sources. However, for the themes ‘physical safety’, ‘trust’, ‘leisure’ and ‘subjective well-being’, data are available4. For ‘leisure’ there is only information available for some European countries, this data is gathered by HETUS (Harmonized European Time Use Survey). However, this information is hardly ever used in SDI sets. For ‘subjective well-being’ and ‘trust’ the data is gathered by other organizations like the European Social Survey (ESS) and the World Value Survey (WVS). These data are not gathered regularly but are not produced by official statistical institutes.
The analysis of the structure of the various SDI sets reveals that there are clear differences, but that many of the important themes as distinguished in the CES recommendations have been taken on board.
3 Note that this does not mean that those countries do not measure these phenomena. For
example, well-being is measured by quite a few countries, but not included in the SDI sets of the countries in question.
5. Sustainable Development: Convergence of Indicators
5.1 Comparison of SDI Sets at Indicator Level
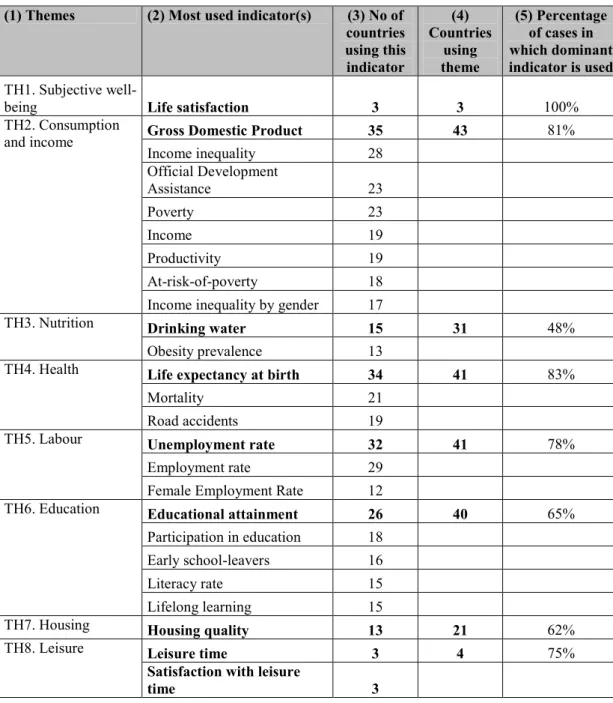
As in the previous analysis all SDI sets were included for a comparison at indicator level. The most important results are presented in table 5.1.
For each of the themes the most commonly used indicator is presented (column 2). By comparing this number with the total number of countries that in fact did include this theme in their SDI sets (column 4) we get an insight to what extent this dominant indicator is prevalent in most indicator sets. Column five reports the share of countries that use the dominant indicator to describe the theme in question
Table 5.1 Most used indicators per theme
(1) Themes (2) Most used indicator(s) (3) No of countries using this indicator (4) Countries using theme (5) Percentage of cases in which dominant indicator is used TH1. Subjective
well-being Life satisfaction 3 3 100% TH2. Consumption
and income Gross Domestic Product 35 43 81% Income inequality 28 Official Development Assistance 23 Poverty 23 Income 19 Productivity 19 At-risk-of-poverty 18 Income inequality by gender 17
TH3. Nutrition Drinking water 15 31 48% Obesity prevalence 13
TH4. Health Life expectancy at birth 34 41 83% Mortality 21 Road accidents 19
TH5. Labour Unemployment rate 32 41 78% Employment rate 29
Female Employment Rate 12
TH6. Education Educational attainment 26 40 65% Participation in education 18
Early school-leavers 16 Literacy rate 15 Lifelong learning 15
TH7. Housing Housing quality 13 21 62% TH8. Leisure Leisure time 3 4 75%
Satisfaction with leisure
TH9. Physical safety Recorded crime 14 22 64% Deaths from assault/homicide
rate 7 TH10. Land and
ecosystems Protected areas 31 43 72% Forest / vegetation cover 21
TH11. Water Water quality 25 37 68% Water abstraction 17
TH12. Air quality Acidifying emissions 23 35 66% Emissions of ozone
precursors 18 TH13. Climate GHG emissions 40 42 95% TH14. Energy
resources Energy intensity 31 42 74%
Renewable energy 31
Energy consumption 29 TH15. Mineral
resources Generation of waste 32 40 80% TH16. Trust Voluntary work 9 22 41% TH17. Institutions Voter turnout in elections 14 28 50% TH18. Physical
capital Gross fixed capital formation 24 39 62% TH19. Knowledge
capital R&D expenditures 31 34 91% TH20. Financial
capital Government debt 31 39 79%
Average 72%
For all of the 20 themes, on average in 72% of the cases the dominant indicator mentioned in column 2 was used to describe the theme in question. When considering the 20 themes individually, it seems that in the case of eight themes 75% or more of the SDI sets used the dominant indicator. For ten SDI sets this share was in between 50% and 75%. Only for two themes, trust and nutrition this share was somewhat lower than 50%. All in all, also on the level of indicators already a fair amount of convergence has been established.
5.2 Comparison of SDI Sets of “Higher” and “Lower” Income Countries
So far, a comparison has been made between the SDI sets of all countries irrespective of their average income level. However, a major problem in developing a common measurement system is the variety in characteristics, priorities and interests of countries, particularly between developed and developing countries. Therefore, the database was divided into two groups of countries, based on their income (adjusted for their purchasing power parity (Central Intelligence Agency, 2013). The 41 available SDI sets of 40 different countries were divided equally over the two groups. Australia has two SDI sets available, both sets were weighted equally (50%) and together represent Australia.
A first analysis on the thematic level reveals shows that both groups give equal attention to most of the themes. However, three themes are biased towards the ‘rich’ countries, i.e. ‘subjective well-being’, ‘leisure’ and ‘housing’. For the first two themes this could be expected, but the latter is somewhat more counter intuitive5. On the other hand, the theme ‘knowledge capital’ is biased towards the ‘poor’ countries.
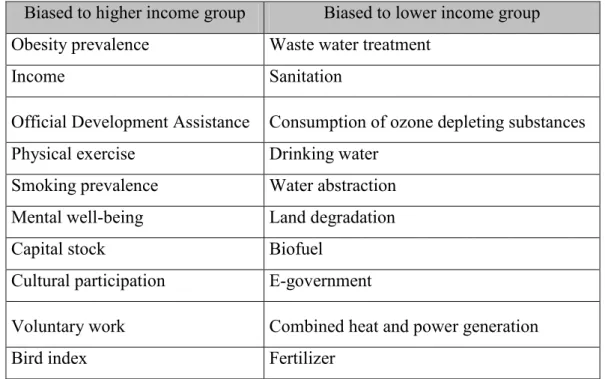
Table 5.2 provides an analysis of the indicators that are most biased towards richer or poorer countries. The indicators that are biased to the higher income group mostly comprise ‘luxury’ items, while the indicators that are biased towards the lower income group focus more on the basic needs. Where the lower income group shows less interest in topics like obesity, smoking prevalence, and physical exercise, the higher income group pays less attention to waste water treatment, sanitation, waste collection and drinking water.
Table 5.2. Indicator comparison of lower and higher income group Biased to higher income group Biased to lower income group Obesity prevalence Waste water treatment
Income Sanitation Official Development Assistance Consumption of ozone depleting substances Physical exercise Drinking water
Smoking prevalence Water abstraction Mental well-being Land degradation
Capital stock Biofuel
Cultural participation E-government
Voluntary work Combined heat and power generation
Bird index Fertilizer
The different priorities in the measurement systems of each group of countries are clearly visible. At the level of themes, some of them are either biased towards rich or towards poor countries. The more detailed indicator analysis reveals that these differences not only exist at the thematic level, but are also present within the themes. However, it should be noted that most of the SDI sets under investigation are from developed countries. The differences between measurement systems of “higher” and “lower” income countries would probably 5This bias can be explained if we look at a more detailed level. For both groups 7 countries take
into account housing quality. However, rich countries also take into account other indicators like ‘neighbourhood’, ‘rough sleepers’, ‘satisfaction with housing’, ‘housing costs’ and more, while ‘poor’ countries do not.
become even more clear when SDI sets of only less developed countries could be compared with those of developed countries, simply because they have different priorities and face different problems.
This conclusion makes sense, because countries are in different stages of development. While developing countries have to combat malnutrition, developed countries are facing the problem of obesity. This conclusion has clear implications for the development of a common measurement system. Because of all the above mentioned differences between countries, a flexible measurement system is required. It should allow for international comparison as much as possible, but should also allow countries to measure country specific indicators. In that sense we can repeat one of the main finding of the CES Recommendations that the themes of SD should be universal, but that some indicators can (and should!) be country specific.
6. Way Forward
There is a great societal need to go “beyond GDP” as the awareness is increasing that GDP growth alone may not always lead to more human well-being and is certainly not always sustainable. However, in order to pursue alternative policies that are more geared toward societal progress, an indicator system needs to be developed which aptly addresses the different issues which are at stake in the “GDP and beyond” realm. After all, society can only manage what it can measure.
This Convergence Report has taken stock of the existing work in the field of “GDP and beyond”, with a focus on SD. It summarises where we stand now, in in which directions the statistical community should move in order to provide sound alternatives to the conventional System of National Accounts .
Stimulating Conceptual, Horizontal and Vertical Convergence
Convergence is important because it creates a common language which is a basis for communication between stakeholders in society. There needs to be agreement on terminology (conceptual convergence), horizontal convergence (at a single measurement level such as national, regional, company and product levels) and vertical convergence (convergence between measurement levels).
There are many examples of harmonisation initiatives, and these should be stimulated. For the vertical convergence the challenge is to have co-operation between statisticians and the corporate sector. Good examples include the ”Measuring what matters” project in the United Kingdom and the “Alignment project” in the Netherlands.
Build on the convergence that is taking place in the measurement of SD
This report has gone in great detail when it comes to the convergence of the measurement of SD. Two criteria will have to be met in order for convergence to be successful:
1. There needs to be a consensus among experts as to how to measure human well-being and its sustainable development (aptly summarised as progress of societies). Chapter 3 gave an outline of the consensus that has been reached at an expert level. Building on the results of the WGSSD and the Stiglitz-Sen-Fitoussi Report, the CES Recommendations presented a new measurement system which has now been endorsed by 60 countries and which is also widely used in the United Nations Post-2015 agenda which is aimed at establishing Sustainable Development Goals.
2. A wide implementation of the measurement system is needed in order to facilitate policies aimed at well-being and its sustainability. In the chapters 4 and 5 it was investigated to what extent 55 of the most prominent SD measurement systems include the themes and main indicators as put forward in the CES Recommendations. This stock-taking exercise reveals that the commonalities between these different data sets are quite substantial. However, more efforts are needed to arrive at a true harmonisation of the measurement systems.
Continue work on Satellite Accounting
The CES recommendations are based on economic theory and therefore to the conceptual notions underlying the Systems of National Accounts (SNA). Nevertheless, the indicators of the CES recommendations does not go as far as suggesting a complete systems of satellite accounts to measure the various dimensions or sustainable development but it does suggest this a way forward. This route would have the advantage that there is the common language that has been created during negotiations about the SNA and SEEA. This will improve the consistency between indicators and will ensure that indicators going ‘beyond GDP’ are produced using the same concepts as those related to the measurement of GDP.
Work on institutional convergence
Sometimes the main hurdle in convergence processes are institutional. There is therefore also a need for institutional convergence. Now, partly due to the fact that many countries and international institutions have their own SDI sets, the adoption of a new system may not be feasible in the short run. In the case of the SNA, right before World War II the League of Nations urged countries to adopt this measurement system. In the “GDP and Beyond” realm we are in need of such an institutional sponsor. Perhaps the United Nations may play this role, as sustainable development is can clearly a global issue, but the European Union could play a leading role.
Grabbing opportunities: The Post2015 process
The final document of the Rio+20 United Nations Conference on Sustainable Development outlines an agenda for further activities.6 Two aspects are particularly relevant. First, paragraph 38 of the outcome of the conference states that “We recognize the need for measures of broader progress to complement gross domestic product in order to better inform policy decisions, and in this regard we request the United Nations Statistical Commission, in consultation with relevant United Nations system entities and other relevant organisations, to launch a programme of work in this area building on existing initiatives”.
Secondly, the outcomes of the Rio+20 Conference point to the need for policy action and formulation of policy goals. Paragraph 104 of the outcomes of this conference states that “we recognize that goals, targets and indicators, including where appropriate gender-sensitive indicators, are valuable in measuring and accelerating progress”. The document proposes that the UN Community formulate Sustainable Development Goals (SDG) to replace or improve upon the Millennium Development Goals (MDG).”
The Post2015 process therefore provides important momentum to bring forward the issue of convergence of measurement in the field of “GDP and Beyond”. The CES Framework forms a good basis to build an indicator set on sustainable development which can be linked to the new SDG’s.
6Rio+20, United Nations Conference on Sustainable Development, Agenda item
References
- Australian Bureau of Statistics (2013). Measures of Australia's Progress. - Australian Government Australia (2013). Sustainable Report Australia 2013,
Conversations with the future. Canberra.
- Bos, F. (2003). The National Accounts as a Tool for Analysis and Policy: Past, Present and Future. PhD thesis.
- Canadian Index of Wellbeing (2013). CIW composite index reveals Canadian wellbeing is on the decline. Downloaded on 01 22, 2014, van Canadian Index of Well-being: https://uwaterloo.ca/canadian-index-wellbeing/
- Central Bureau of Statistics Israel (2012). Sustainable Development Indicators in Israel 2009. Jerusalem.
- Central Statistical Office Poland (2011). Sustainable Development Indicators for Poland. Katowice.
- Central Statistics Office Ireland (2013). Sustainable Development Indicators Ireland 2013. Dublin.
- CIA (2013). The World Factbook. Downloaded on January 15, 2014, van Central Intelligence Agency: https://www.cia.gov/library/publications/the-world-factbook/rankorder/2004rank.html
- Costanza, R. (2014, January 16). Time to leave GDP behind. Nature, 283 - 285.
- Department for Environment, Food and Rural Affairs, Sustainable Development Statistics United Kingdom (2013). Sustainable Development Indicators. London.
- Department of Environmental Affairs South Africa (2011). National Strategy for sustainable development and action plan (NSSD1), 2011-2014.
- Department of International Economics, Sunmoon University South Korea (2006). The Korean National Strategy for Sustainable Development, A background report.
- Department of Studies , Planning and Coordination, Department of Environment Morroco (2005). Description of the national strategy and sustainable development indicators. Rabat.
- ESS (2013). Data and Documentation by Round/Year. Downloaded from European Social Survey: http://www.europeansocialsurvey.org/data/round-index.html
- Eurostat (2013, August 30). Sustainable Development Indicators.
Downloaded from Eurostat: http://epp.eurostat.ec.europa.eu/portal/page/portal/sdi/indicators
- Eurostat, European Commission (2013, 08 30). Sustainable Development Indicators. Downloaded on 10 31, 2013, van Eurostat: http://epp.eurostat.ec.europa.eu/portal/page/portal/sdi/indicators
- Federal Ministry of Agriculture, Forestry, Environment and Water Management Austria (2007). One way to a sustainable Austria, Indicator report 2007. Vienna.
- Federal Planning Bureau Belgium (2013, 9 30). Downloaded on 10 31, 13,
van Indicatoren van duurzame ontwikkeling: http://www.indicators.be/nl/indicator/ozonconcentratie
- Federal Statistical Office Germany. (2012). Sustainable Development in Germany, indicator report 2012. Wiesbaden.
- Federal Statistical Office, Federal Office for Spatial Development, Swiss Agency for Development and Cooperation, Federal Office for the Environment Switserland (2012). Sustainable Development Report 2012. Sustainable development, regional and international disparities. Neuchatel. - Fondazione Eni Enrico Mattei (2013). FEEM Sustainability Index.
Downloaded on 01 22, 2014, van Fondazione Eni Enrico Mattei : http://www.feemsi.org/index.php
- Genuine Progress Indicator. (sd). Downloaded on 01 22, 2014, van Genuine Progress, Moving Beyond GDP: http://genuineprogress.net/genuine-progress-indicator/
- Government Council for Sustainable Development, Ministry of the Environment, Czech Republic. (2009). Progress Report on the Czech Republic Sustainable Development Strategy. Government Council for Sustainable Development, Ministry of the Environment, Prague.
- Government of the Republic of Montenegro, Ministry of Tourism and Environmental Protection Montenegro. (2007). National Strategy of Sustainable Development of Montenegro.
- Hall, J., Giovannini, E., Morrone, A., & Ranuzzi, G. (2010). A Framework to Measure the Progress of Society. OECD, Italian National Institute of Statistics.
- Hueting, R. (1974). Nieuwe schaarste en economische groei. Agon Elsevier . - Hueting, R., & de Boer, B. (2001). Environmental Valuation and Sustainable
National Income According to Hueting. Downloaded from http://www.sni-hueting.info/EN/Publications/2001-Hueting-In-VanIerland-EtAl.pdf
- Hungarian Central Statistical Office (2011). Sustainable Development Indicators in Hungary. Budapest. Downloaded from Sustainable Development Indicators in Hungary.
- Institute of Geography and Statistics (IBGE) Brazil (2012). Sustainable Development Indicators, Brazil 2012. Rio de Janeiro.
- Kuik, O. (sd). Genuine Savings. Downloaded on 01 22, 2014, van Institute
for Environmental Studies (IVM): http://www.ivm.vu.nl/en/Images/AT3_tcm53-161574.pdf
- Kuik, O. (sd). Measure of Economic Welfare (MEW). Downloaded on 01 22, 2014, van Institute for Environmental Studies (IVM): http://www.ivm.vu.nl/en/Images/AT1_tcm53-161571.pdf
- Kuik, O. (sd). Sustainable National Income (SNI). Downloaded on 01 22, 2014, van Institute for Environmental Studies (IVM): http://www.ivm.vu.nl/en/Images/AT2_tcm53-161573.pdf
- Kuik, O. (sd). The Index of Sustainable Economic Welfare (ISEW). Downloaded on 01 22, 2014, van Institute for Environmental Studies (IVM): http://www.ivm.vu.nl/en/Images/AT5_tcm53-161576.pdf
- Kulig, A., Kolfoort, H., & Hoekstra, R. (2009). The case for the hybrid capital approach for the measurement of the welfare and sustainability. Statistics Netherlands. The Hague: Elsevier Ltd.
- Latvian Environmental Agency, Ministry of Environment of Latvia (2003). Sustainable Development Indicators in Latvia 2003. Riga.
- Lawn, P., & Sanders, R. (1998). Has Australia surpassed its optimal macroeconomic scale? Finding out with the aid of 'benefit' and 'cost' accounts and a sustainable net benefit index. Ecological Economics.
- Medrano, J. D. (2014). ASEP/JDS. Downloaded on December 16, 2013, van
Banco de datos: http://www.jdsurvey.net/jds/jdsurveyActualidad.jsp?Idioma=I&SeccionText
o=0404
- Ministry of Energy, Development and Environmental Protection Serbia (2007). National Sustainable Development Strategy. Belgrade.
- Ministry of Environment, Environmental Protection Agency, Denmark (2008). Indicators of sustainable development. Denmark. Copenhagen: Ministry of Environment, Environmental Protection Agency.
- Ministry of Environment, Luxembourg (2006). Sustainable Development Indicators. Downloaded from Portail de l'environnement: http://www.environnement.public.lu/developpement_durable/indicateurs/ID D_MAJ_06_08_ALL_PDF.pdf
- Ministry of Finance Norway (2011). State Budget 2012 (Chapter 6, Sustainable development and quality of life).
- Ministry of Sustainable Development France (2010). National Sustainable Development Strategy 2010 - 2013, Towards a green and fair economy. Paris.
- National Council of Economy and Labour and National Institute of Statistics Italy (2013). Equitable and sustainable well-being in Italy. Downloaded from Istat: http://www.istat.it/it/archivio/84348
- National Institute of Ecology & National Institute of Statistics, Geography and Information Mexico (2000). Sustainable Development Indicators of Mexico. Cuajimalpa.
- National Institute of Statistics Romania. (2011, 11). Sustainable development statistical indicators. Downloaded from National Institute of Statistics: http://www.insse.ro/cms/files/Web_IDD_BD_en/index.htm
- National Statistical Institute Bulgaria (2013). Downloaded on 10 31, 2013, van Republic of Bulgaria, National Statistical Institute: http://www.nsi.bg/otrasalen.php?otr=59
- National Statistical Institute Spain (2009). Sustainable Development 2008, Main developments in Spain to monitor SD Strategy EU. Madrid.
- National Statistical Office Malta (2010). Sustainable Development Indicators for Malta 2010. Valletta.
- Nordhaus, W., & Tobin, J. (1973). Is growth obsolete? New York: UMI. - Osberg, Lars, and Andrew Sharpe (1998) “An Index of Economic
Well-Being for Canada” paper presented at the CSLS Conference on the State of Living Standards and Quality of Life in Canada, October 30-31, Ottawa, Ontario (paper posted at www.csls.ca under recent events), also Research Paper R-99-3E, Applied Research Branch, Human Resources Development Canada, December.
- Pearce, D. W., & Atkinson, G. D. (1993). Capital Theory and the measurement of sustainable development: an indicator of 'weak' sustainability. Ecological Economics, 103-108.
- Prime Minister's Office and Statistics Finland (2013, 10 31). Downloaded on 10 31, 2013, van Findicator: http://www.findicator.fi/en
- Regional environmental Center for Central Asia, Kazakhstan. (2002). Sustainable Development Indicators for Republic of Kazakhstan, towards the world summit on sustainable development. Almaty.
- Secretary of environment and sustainable development Argentina (2012). System of sustainable development indicators. San Martin.
- Social republic of Vietnam (2012). Implementation of Sustainable Development, National report at the United Nations Conference on Sustainable Development (RIO+20). Hanoi.
- Standard Chartered Bank (2013). Special Report, Measuring Sustainable Development. Global Research.
- Statistical Office of the Republic of Slovenia. (2010). The Sustainable Development Indicators for Slovenia, second updated issue. Ljubjana.
- Statistics Estonia (2011). Indicators of sustainable development. Tallinn. - Statistics Lithuania, Environmental Protection Agency Lithuania. (2010).
Sustainable Development Indicators. Vilnius.
- Statistics Netherlands (2011). Monitor Duurzaam Nederland 2011. Den Haag: Centraal Bureau voor de Statistiek.
- Statistics New Zealand (2011). Key findings on New Zealand’s progress using a sustainable development approach: 2010. Wellington.
- Statistics Portugal (2013, 05 31). Sustainable Development Indicators. Downloaded on 10 31, 2013, van Statistics Portugal: http://www.ine.pt/xportal/xmain?xpid=INE&xpgid=ine_dossie_idsustentavel &xlang=en
- Statistics Sweden, Regions and Environment Department Sweden. (2012). Evaluation of Swedens' status with the EU sustainable development indicators. Stockholm.
- Stiglitz, J. E., Sen, A., & Fitoussi, J.-P. (2009). Report by the Commission on the Measurement of Economic Performance and Social Progress.
- Sustainable Society Foundation. (2013). Sustainable Society Index Framework. Downloaded on 01 22, 2014, van Sustainable Society Index - your compass to sustainability: http://www.ssfindex.com/ssi/framework/ - Turkish Statistical Institute. (2012). Sustainable development indicators,
2000-2011. Downloaded from Turkstat: http://www.turkstat.gov.tr/PreHaberBultenleri.do?id=10910
- UNCSD. (1996). Indicators of Sustainable Development Framework and Methodologies. New York: United Nations.
- United Nations. (1992). United Nations Sustainable Development, United Nations Conference on Environment & Development, Agenda 21. Rio de Janeiro.
- United Nations. (2007). CSD Indicators of Sustainable Development – 3rd edition. New York.
- United Nations. (2009). Measuring Sustainable Development. Report of the joint UNECE/OECD/Eurostat Working Group on statistics for sustainable development. New York and Geneva.
- United Nations (2014). Conference of European Statisticians Recommendations on Measuring Sustainable Development. Final report of the Task Force on Measuring Sustainable Development (TFSD)Joint work of UNECE, Eurostat, OECD.
- van den Bergh, J. C. (2009). The GDP Paradox. Journal of Economic Psychology, 117 - 135.
- van der Kerk, G., & Manuel, A. (2010). Short survey of relevant indexes and sets of indicators concerning development towards sustainability. Northern Alliance for Sustainability, Brussel.
- http://www1.eur.nl/fsw/happiness/hap_nat/nat_fp.php?mode=1
- WCED (1987). Our Common Future. World Commission on Environment and Development.
- World Bank (2006) The Changing Wealth of Nations: Measuring Sustainable Development in the New Millennium, The World Bank, Washington DC - World Bank (2011) Where is the wealth of nations? The World Bank,
Annex I. Database of Measurement Systems
A database of in total 55 measurement systems (12 composite indicators and 43 SDI sets) was created in order to investigate their commonalities. These systems were then linked to the CES recommendations measurement framework, which is used as a benchmark system.
The aim is to measure societal development in its broadest sense. Indicator sets should therefore include indicators for well-being in the “here and now” as well as for the “later” dimension. These sets are usually labelled using the terms “sustainable development” or “progress”. This implies that many systems that measure only the “here and now”, such as Eurostat’s well-being indicators or the Human Development Index, are not included in the database.
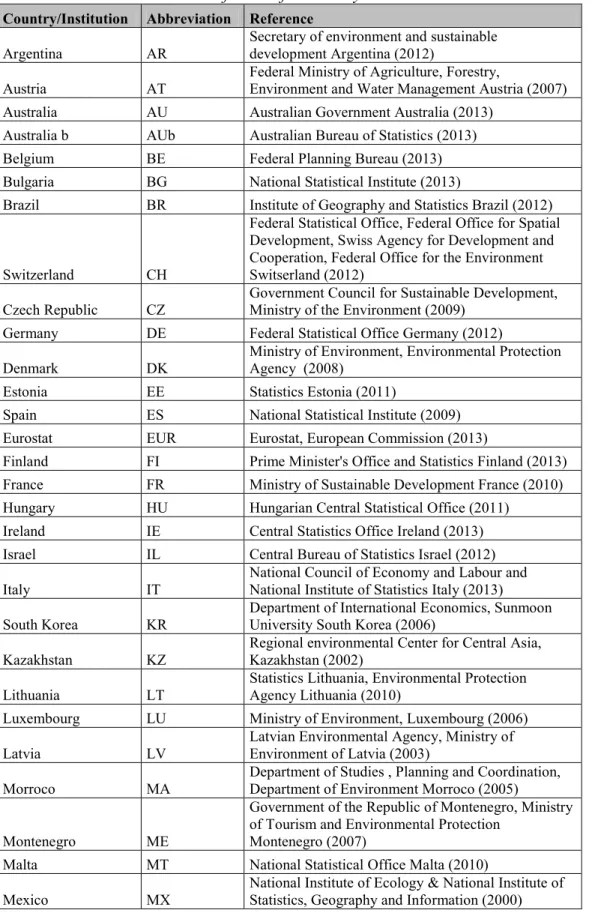
In total, twelve composite indicators were added to the database. For the SDI sets we focussed on countries from the EU28, G20 and the UN Open Working Group on Sustainable Development Goals. In total 86 countries were checked7,8, for which 43 SDI sets were found. Two were from Eurostat and the United Nations, while the other 41 SDI sets were from 40 different countries (Australia has two indicator sets-one for progress and one for sustainable development). An overview of the available SDI sets is presented in Annex II.
Some of the SDI sets were datasets uploaded on the internet, but most countries published an official report on paper. The most recent SDI reports were collected and translated if necessary9. All indicators of the SDI sets were linked to one of the twenty themes of the CES recommendations as well as to the list of “generic indicators”. A “generic indicator” is simply a group name for a number of indicators that differ slightly, but in essence are aimed to measure the same phenomenon. For example, there are many ways to measure “at-risk-of-poverty”,
7Due to time constraints not all countries in the world were checked for the availability of an
SDI set. Research was limited to the countries of the EU28, G20, UN Open Working Group on Sustainable Development Goals and New Zealand. Also the SDI sets of Eurostat and the United Nations are included. Most of the countries identified publish SDI sets once every over couple of years. Although there might be some changes and improvements between editions, these updates are considered as the same ‘measuring system’ and are only counted as one measurement method despite their differences. Australia however produces two completely different SDI sets, one by the Australian Government and one by the Australian Bureau of Statistics, these are regarded as two separate systems.
8Due to time constraints we were not able to double check all countries. The absence of SDI sets
from four of the EU28 countries is confirmed. However, for the G20 and Open Working Group members we were only able to execute a quick stocktake on the availability of SDI sets due to time constraints. For these countries it is possible that SDI sets are available, but we were not able to find them within our limited period of time.
9Many countries publish their SDI sets in their own language. Translations had to be made from
but they are all bundled under one generic indicator. Finally, a total of 3261 indicators of SDI sets were linked to the themes/generic indicators.10
Composite indicators give less detailed information at the indicator level and often only use a limited number of indicators. Therefore we simplified the analysis for composite indicators, and only analysed which themes were covered by each composite indicator. Also for the composite indicators additional information was collected about the year of their first release, the organisation responsible for the building of this indicator, etcetera.
10 Some indicators could not be linked because these themes were not part of the framework of
the CES recommendations. These focussed on specific sectors like agriculture, transport or tourism, that were not directly included in the measurement framework.