Received May 13, 2019, accepted May 25, 2019, date of publication June 17, 2019, date of current version January 7, 2020. Digital Object Identifier 10.1109/ACCESS.2019.2923270
Blending Big Data Analytics: Review
on Challenges and a Recent Study
FAIRUZ AMALINA 1, IBRAHIM ABAKER TARGIO HASHEM2, ZATI HAKIM AZIZUL 1,
ANG TAN FONG1, AHMAD FIRDAUS3, MUHAMMAD IMRAN 4,
AND NOR BADRUL ANUAR 1
1Faculty of Computer Science and Information Technology, University of Malaya, Kuala Lumpur 50603, Malaysia 2School of Computing and Information Technology, Taylor’s University, Subang Jaya 47500, Malaysia 3Faculty of Computer Systems and Software Engineering, University Malaysia Pahang, Kuantan 26600, Malaysia 4College of Computer and Information Sciences, King Saud University, Riyadh 11451, Saudi Arabia
Corresponding authors: Fairuz Amalina ([email protected]) and Nor Badrul Anuar ([email protected])
This work was supported in part by the University Malaya Research Fund Assistance (BKP) under Grant BKS058-2017, in part by the Fundamental Research Grant Scheme under Ministry of Education Malaysia, under Grant FRGS/1/2018/ICT03/UM/02/3, and in part by the Deanship of Scientific Research, King Saud University, through the Research Group Project under Grant RG-1435-051.
ABSTRACT With the collection of massive amounts of data every day, big data analytics has emerged as an important trend for many organizations. These collected data can contain important information that may be key to solving wide-ranging problems, such as cyber security, marketing, healthcare, and fraud. To analyze their large volumes of data for business analyses and decisions, large companies, such as Facebook and Google, adopt analytics. Such analyses and decisions impact existing and future technology. In this paper, we explore how big data analytics is utilized as a technique for solving problems of complex and unstructured data using such technologies as Hadoop, Spark, and MapReduce. We also discuss the data challenges introduced by big data according to the literature, including its six V’s. Moreover, we investigate case studies of big data analytics on various techniques of such analytics, namely, text, voice, video, and network analytics. We conclude that big data analytics can bring positive changes in many fields, such as education, military, healthcare, politics, business, agriculture, banking, and marketing, in the future.
INDEX TERMS Big data analytics, data analytics, deep learning, machine learning.
I. INTRODUCTION
The promising technology of today has enlarged user depen-dency on digital devices contributing to the increment of abundant data every second. The Cisco Visual Network-ing Index shows that the global mobile data traffic reached 11.2 exabytes monthly in 2017, and forecast depicts a raise of 13 folds over the next five years [1]. This high traf-fic rate produces ‘‘big data,’’ and the data analysis process periodically differs according to data types. Data have three types, namely, structured, semi-structured, and unstructured. Structured data rely upon big data analytics, whereas unstruc-tured data produce more content than companies have ever produced [2]. Unstructured data include text-based conversa-tions on social media, photos, video recordings, live videos, and sensor data. Traditional data analysis methods are not
The associate editor coordinating the review of this manuscript and approving it for publication was Chun-Wei Tsai.
that effective in analyzing these large-scale and complex data. Therefore, almost 80% of companies have low vis-ibility into their unstructured data and limited knowledge on managing such data [3]. With unstructured data, mod-ern businesses require new methods to analyze various big data [4]. New methods, namely, artificial intelligence (AI), machine learning, association rule learning, classification tree analysis, genetic algorithm, regression analysis, senti-ment analysis, and social network analysis are widely used in data analysis techniques. These methods also affect the way data are examined [5]. Thus, revisiting and redesign-ing data analysis methods are now trends in modern busi-nesses, especially changing the decision-making process. For example, the adoption of text analytics in decision making has grown from 15% to 45% within the past three years, social media analytics from 17% to 46%, geospatial analyt-ics from 17% to 37%, and predictive analytanalyt-ics from 28% to 51% [6].
Big data analytics adopts complexity [5] and the concepts of the six V’s in big data characteristics, which include volume, velocity, variety, variability, veracity, and value. With the adoption, the current data analytics requires new tech-niques in handling enormous data. In addition, the analytic process becomes complex with massive data from several sources. Subsequently, the input helps in the creation of an impactful analytic process and facilitates the decision-making process with easy analysis and accurate prediction results [7]. Hadoop, Spark, MapReduce, SAS, and Rapid Miner offer flexibility, scalability, and good performance to improve the analytic process [8], [9]. These advanced tools co-exist with programming languages, such as Python, Scala, and R and SQL. This coexistence boosts the potential of big data analytics in transforming unstructured to structured data in many domains unlimited to smart city [10], healthcare [11], military [12], business [13], education [14], and transportation [15].
The promising improvement in big data performance seems engaging; 60% of enterprises were expected to have Hadoop clusters running in production by the end of 2018 [16]. With this outlook, big data analytics is set to overtake traditional data analysis, allowing further support in processing enormous data and real-time response [17]. The capacity to acquire, store, process a large amount of data in various formats, and deliver meaningful informa-tion to users is also known as predictive analytics, which immensely impacts various domains [18]. For example in healthcare, predictive analytics can derive a potential mar-ket in a clinical trial after following insight patterns from the patient medical record [18]. Predictive analytics is also required in businesses to provide insights using data man-agement, infrastructure, and talent capability and thus trans-form companies into a competitive force [19]. In addition, predictive analytics on security log data benefits intelligent securities with a strategy to predict, prevent, and mitigate future cyber-attacks [20]. This important feature of big data analytics can help businesses uncover new opportunities. However, the feature is still in infancy and is open for future work.
The perspective for future studies provides researchers an opportunity to explore few familiar areas in big data analyt-ics, such as definite tools and existing analytics techniques. Katal et al.[21] discussed the issues and challenges in big data and suggested only two types of tools, namely, Hadoop and MapReduce for data analytics. They explained the impor-tance of big data in various projects and domains, but they insufficiently provided information about tools. Another liter-ature has discussed several big data analytics techniques, but coverage on tools is limited [22]. Gandomi and Haider [23] focused on geospatial analytics providing insufficient cover-age on the overall analytics techniques. To overcome the gap in the literature, the current study explores big data analytics techniques that have emerged in the 2014-2019, focusing on how data are analyzed and detailing popular tools and programming languages used by industries and businesses.
This research also discusses the popular implementation of the deep learning method in data analytics. We believe this study can help synthesize the general understanding of big data analytics, the suitability of tools and programming lan-guages, along with different big data analytics methods used in various domains.
The motivation for utilizing blending big data analyt-ics to discover intricate structure in high dimensional data can be viewed in various domains of science, business and government. Moreover, many studies have been conducted to solve big data problem, however, new researchers still struggling to find a suitable research topic for their study. So that, to broaden the point of view in this issue, motivate us to creates a simple taxonomy in big data sources and study cases as an example for each type that help to better understanding on how the data are processed and analyze. Especially nowadays, the blending of big data analytics in the various business domain becomes more competitive and complex.
Our main contributions are: i) we summarize current tools that are widely used in providing meaningful analysis of a large set of data, ii) we briefly discuss case studies in blending with big data sources that highlight how the analytics help scholars and companies leverage data sources with analytics for driving productivity, and iii) we also discuss case studies on analytics usage by the scholars for their projects which focuses on problem and solutions. In addition, the study aims to investigate and explore the big data analytics techniques used by industries by focusing on certain case studies in various domains. We describe the recent big data definition and its challenges in handling modern data. We also discuss the big data analytics categories, which focus on the six big data analytics techniques, namely, text, visual, voice, video, network, and geospatial analytics. These big data analytics techniques are summarized according to their aims, how the authors analyzed their data, and the preferred programming languages and platforms used for their analyses. Moreover, we highlight the justification behind the authors’ preference for certain programming languages when handling big data. To visualize analytics practice in many industry domains, we also discuss recent trends in blending deep learning tech-niques into data analytics for future enhancement in big data.
Section 2 discusses the state of the art in the big data stud-ies, including their latest perspectives, along with the recent definitions and the latest challenges in handling modern data. Section 3 reviews the categories of data analytics, together with their associated recent studies and programming lan-guages, the advantages, and the limitations. Section 4 summa-rizes the most recent trend of data analytics, particularly the emergence of new technologies, such as blending data ana-lytics with deep learning in the big data. Section 5 provides five latest case studies to illustrate the practical case of the recent data analytics in modern business. Finally, Section 6 draws the conclusion by pointing out the future direction of data analytics.
II. BIG DATA ANALYTICS
According to IBM [24], their big data analytics division defines big data as a term that applies to the size of a dataset that is beyond traditional databases. The dataset characteristic includes high volume, velocity, and variety and is gener-ated in large scales. The genergener-ated big data helps analysts, researchers, and businessmen make good decisions by using several techniques, namely, machine learning, predictive ana-lytics, data mining, statistics, text anaana-lytics, and deep learning analytics. The following subsections discuss the big data definition, challenges in big data, and challenges in handling modern data.
A. BIG DATA
Big data is a combination of various factors, such as time and data type. Big data consists of large volumes of high velocity, complex, and variable data, which need advanced methods and technologies to capture, store, distribute, manage, and analyze information [25]. Among the reviewed studies in the literature [23], [26]–[29] reported a nearly complete charac-terization of big data. Gandomi and Haider [23] defined big data volumes as various factors such as time and data type. The reason is that everything that may translate in what big data is today unfortunately undescribed the true definition in the future. In addition, Zhanget al.[30] mentioned that big data is unnecessarily referred to as simply a large volume of data when it has other features that increase its complexity and result in unique characteristics that differentiate big data from other data. Finally, the complete definition we consider is the six V’s and complexity [5]. The big data analytics aims to provide an alternative to a traditional solution on the basis of databases and data analyses. The solution also aims to analyze the raw big data to make sense of them and exploit their value. Based on these observations, the fundamental research on big data solution is critical for the future digital application.
B. BIG DATA CHALLENGES
Following the characteristics of the ‘‘Big Data’’ by Ganiet al.[5], the challenges in the big data of the six V’s are volume, velocity, value, variability, veracity, variety, and complexity. These characteristics have been exploited in their big data definition. All these characteristics are explained and discussed to visualize the big data challenges for big data techniques. They explained how their technique reveals different data formations and update speeds to observe their behavior. They stated that big data requires a technique applied to the big data characteristics in optimizing search performance with a good time–space index tradeoff. In our literature, we describe these big data characteristics as the indirect challenges in the implementation of big data ana-lytics. The six V’s and complexity big data challenges are defined below.
Volume: refers to the vast growth of applications and social media user addiction that lead to a huge volume of big data from unlimited sources, such as Facebook content, Google,
games, and Netflix. Hardware and software applications require the handling of such data, which become challenging to analyze and store [31].
Variety is related to the interdisciplinary type of data, which are typically collected from a different source, for-mat, and type. Such data are either from sensors, mobile devices, corporate documents, satellite images, or social net-works. These data are usually in the form of structured, semi-structured, and unstructured data [32]. These various types of data require the use of suitable tools or software for analyzing the data. Finding perfect tools or software is challenging for data scientists, analysts, or researchers due to certain constraints.
Veracity refers to the accuracy and truthfulness of the collected big data. For example, when we collect real-time data, data corruption or manipulation may occur. Therefore, data staging, which involves cleaning, transforming, filter-ing, or normalizing data, is necessary to discard any irrel-evant information. Data staging becomes challenging when data volume is large, thus cleaning the data also becomes difficult [21].
Velocity: refers to the generation of data and speed rate of the analysis process. Velocity plays a crucial part in stream-ing real-time data, in which data are generated by online transaction, social network, video audio, or map visualiza-tion. Thus, streaming and real-time analysis are challeng-ing enough because of big data’s current infrastructure and required use of a new learning algorithm for efficient and timely information extraction [7].
Value is an important aspect of big data in determin-ing whether the discovered data are meandetermin-ingful and useful for analysis. However, doing so is also a challenging task because data validation is already complex, given the abun-dant datasets on the line waiting to process [26].
Variability refers to the variation in the data flow that may occur when the flow is difficult to maintain. This data flow is also caused by the unstable increasing data load usage of social media [5].
Complexity: relates to the challenging task in processing the countless generated sources in big data. The process includes finding an interconnection among data from differ-ent sources [23].
C. DATA CHALLENGES
The advancement in the digital world produces unstructured big data in various forms and sizes. Such data come with several challenges in modern data handling. Hence, several existing challenges in handling modern data, such as storage model, privacy and data security, and analysis methods and applications, are discussed as follows.
1) STORAGE MODEL
Millions of new Internet of Things (IoT) devices are cur-rently connected to the Internet daily. As an explosive social media, Facebook itself is a great contributor to big data. Considering the huge demands of big data on networks, many
organizations switch from traditional storage and servers out-sourcing their data to cloud storage. However, data size is too big, thus uploading such data to the cloud storage in real time is challenging [21]. In addition, cloud remote sensing application demands real-time processing capacities, such as large-scale debris flow investigation, flood hazard manage-ment, and surveillance of large ocean oil spills. However, the big data derived from remote sensing is excessively large, and the resulting increase in the complexity of the data can cause the timely storage and processing of large volumes of multi-dimensional RS data data-intensive and computation-ally challenging [33].
2) PRIVACY AND DATA SECURITY
Although big data analytics has become popular in recent years, dealing with a large amount of data in terms of privacy remains an open issue. The reason is that data are decentral-ized as they come from variable sources, such as sensors, mobile devices, and IoT devices. Moreover, analyzing het-erogeneous data source has become a privacy and security problem due to the communication with other external sys-tems. Ensuring that the source is not compromised by any attacks is also necessary [8]. For example, in healthcare big data, smuggling recoverable data becomes a great concern in big data analytics. This case must be thoroughly mitigated to prevent another invasion of patient security and privacy. This incident urges the big data to rethink privacy for ana-lytics and developers with privacy agreements to keep the data confidential if changes in application or privacy regu-lation occur [34], [35]. In addition, General data protection regulation (GDPR) has the authority to control consumers personal data collected by businesses to maintain compliance with new data protection and privacy laws [36]. The GDPR effect on data ethics at large when companies require to anonymize their data unless identifying information is crucial to its worthiness. In a case of the predictive personalized profile, profiling technique can create a new knowledge that turns personal data into personal actions and behaviors. The profiling technique can affect people’s lives in a good and bad intention to steer social and technological process [37]. However, inappropriate use of personal data can damage a company’s brand, which happened with Facebook’s stock decreased over the US $100 billion following news coverage of data breach involving Cambridge Analytica [38].
3) ANALYSIS METHODS
Big data analysis is important to make a huge amount of data useful and meaningful. Big data analysis has two main points—to develop effective methods that can accurately make predictions and to gain insights into the relationship among features [39]. In handling inconsistent, uncertain, and complex data in big data, a true and suitable analysis method is required. Thus, finding suitable analysis methods and techniques that can handle inconsistent, uncertain, and complex data is another challenge facing by the data analysts and data scientists [28]. Moreover, several analytical methods
are available, such as inquisitive, predictive, prescriptive, and pre-emptive analytics. The potential of these analytical methods using big data is unlimited but restricted by the availability of existing technologies, tools, and skills for big data analytics [40].
4) APPLICATIONS
Several challenges exist in building an effective real-time big data application, including real-time event data transfer, sit-uation discovery, analytics, decision making, and responses. This application requires a deep understanding to create an effective and efficient approach to improve development as well as reduce risk and improve the quality of life [28]. In addition, traditional application suffers from the analysis processing constraint, high computational processing, mem-ory limitation, and existing algorithm miscoordination when dealing with these high dimensional data. Analyzing big data requires computational complexities, such as machine learning techniques with small memory requirement and fast processing time [41]. Hence, selecting a suitable big application depends on the purpose. However, selecting application becomes complicated because some applications are incompatible with certain features. For example, a busi-ness intelligence (BI) application has data mining and predic-tive analytics features. Other applications include streaming features.
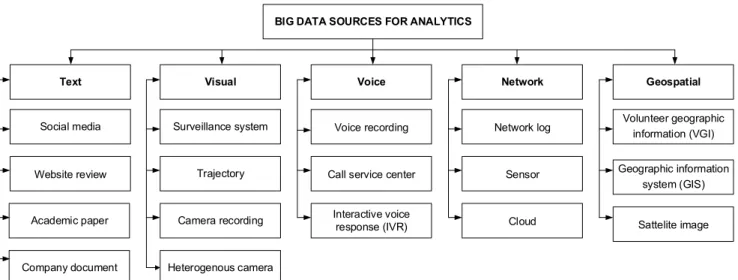
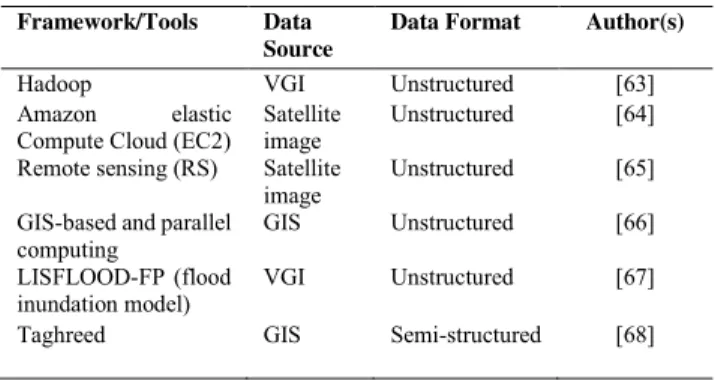
III. BLENDING BIG DATA SOURCES FOR ANALYTICS The exponential growth of big data has produced various types of datasets from different situations and places. These datasets pose many new challenges to conventional data analytics because of their large dimensionality, heterogene-ity, and complex features. New data analytics is needed to process and analyze data dynamically, given the chal-lenges in the conventional technique and owing to the three types of data, namely, structured data, unstructured data, and semi-structured data. The structured data refer to the well-organized data in a way very easy to read and find. In the spreadsheet Table 1, consistent fields, such as transaction data stored in relational databases, are defined. Unstructured data are essentially everything that is unspecific, and data become difficult as advance tools are required to access information. Unstructured data encompass text files, documents, emails, text messages, and social media posts. Semi-structured data are unorganized data, which are more difficult to retrieve, analyze, and store than structured data. Note that structured data require software, such as Hadoop (e.g., server or mobile application log files). Figure 1 provides the classification of blending big data sources for analytics techniques, namely, text, visual, voice, network, and geospatial analytics. The concept of big data analytics is to deal with dissimilar and complex raw data input that mainly consists of unsupervised data of different sizes and have limited supervised data [42]. This analytics is inspired by Gandomi and Haider [23] and excludes geospatial data. Hence, Table 1 describes the def-inition of big data analytics according to its categories.
TABLE 1. Various categories of data analytics.
FIGURE 1. Big data taxonomy on data source.
Then, the following subsections discuss several case studies according to the data sources.
A. CASE STUDIES WITH TEXT ANALYTICS
This section discusses various case studies related to text analytics in big data. Table 2 details the following five case studies, which explore the use of text analytics.
1) SOCIAL MEDIA: PRODUCT DEFECT DISCOVERY
The increasing number of consumers has urged companies to explore new ways in social media to find their brand testi-monial. Therefore, companies must discover product quality with text analytics. Abrahamset al.[43] proposed a frame-work called social media analytics using text, which detects a product defect from social media posting in the vehicle and consumer electrics domain. The ‘‘defect’’ described in the social media content is collected, and the features are
categorized into types, namely, context independent and con-text specific. Then, the classification accuracy is compared using first-order features. Abrahamset al.[43] improved the defect detection domain.
2) ACADEMIC PAPER: MAIN CONCEPT DISCOVERY
BI has drawn the attention of researchers in widely exploring academic papers. However, the large quantity of academic papers that are available online increase researchers’ diffi-culty in identifying the main concept surrounding BI within most of the relevant papers. Ishikiriyamaet al.[44] proposed text analytics to analyze the relevant academic papers using software R-project. They identified the main concepts sur-rounding BI in the top 35 samples out of 100,115 papers. The author broke single words to keywords and calculated the frequency of the keywords in the sample by word group. From the frequency number of keywords, [44] concluded that
TABLE 2. Summary of text analytics case studies.
analyzing words can bring information and knowledge about a certain subject.
3) SOCIAL MEDIA: SOCIAL MEDIA HEALTH MONITORING
Many consumers have shared information about their health condition and seek health information via social media. This shared information has given value to pharmaceutical com-panies to directly interact with patients without consulting a doctor. Such an information has also become worrisome. The interaction may lead to prescribing controlled medicine to consumers. To monitor this case in social media, a sys-tem to monitor activities regarding health in social media is proposed. Martínez et al. [45] proposed a system that collects information from Twitter and extracts texts. The MeaningCloud Language Identification API is utilized for Spanish text identification, which uses a statistical technique on the basis of n-grams. Then, the component of the text analytics process performs a calculation to display meaning-ful relationships and patterns of insights of texts using NLP. NLP can help manage relevant entities and relationships for automatic interpretation with accurate estimation. This work can process real-time user-generated content related to health and presents aggregated data about the different entities in several visualization timelines [45].
4) WEBSITE REVIEW: ONLINE SELLER REPUTATION EVALUATION
Secondhand e-commerce websites have become popular in online transactions. However, the lack of evaluation on seller reputation makes buyers have an unpleasant experience when receiving bad products. Hence, text analytics is considered to reduce buyer dissatisfaction while evaluating the rep-utation of secondhand sellers. Chen et al. [46] proposed a combined textual and numerical feature from the data to model seller reputation. This reputation is employed in machine learning to analyze seller reputation from Chinese secondhand online markets. Data from online markets, such as product descriptions, are extracted to obtain the tex-tual features through domain ontology and topic modeling results. The ontology-based method shows the effectiveness of most of the variables used in predicting secondhand sellers’ reputation [46].
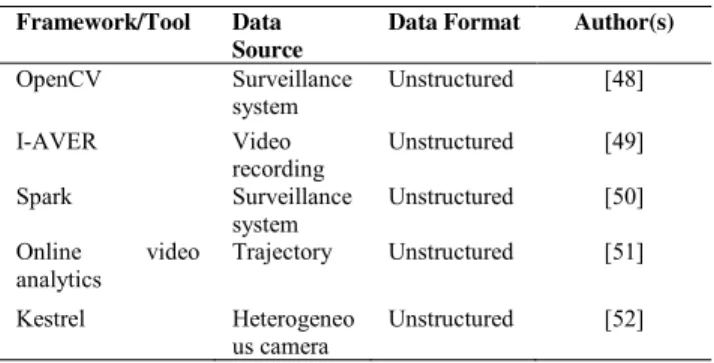
TABLE 3.Summary of video analytics case studies.
5) COMPANY DOCUMENT: INSURANCE FRAUD CLAIM DETECTION
The current rise of automobile owners has also increased the development of the insurance industry. Hence, automobile owners do fraudulent claims to receive compensation from insurance companies. To control the losses from fraudu-lent acts, insurance companies must crucially find solutions to detect whether claims are fraudulent without any bias decision. Insurance companies adopt text analytics to detect fraudulent claims then reduce them. Wang and Xu [47] pro-posed Latent Dirichlet allocation (LDA)-based text analytics method using deep learning technology with the combination of human experience and AI. Moreover, LDA combination method with deep learning technology can improve the per-formance in detection models. Furthermore, LDA can derive hidden topic information in large-scale documents [47].
B. CASE STUDIES WITH VISUAL ANALYTICS
This section explains various case studies related to visual analytics in big data. Table 3 displays the following five case studies, which explore the use of visual analytics.
1) SURVEILLANCE SYSTEM: AUTOMATED BIKE RIDER DETECTION
Two-wheeler transportation is the most popular means of transportation in populated areas, and governments have enforced rules on helmet wearing for riders. Riders who disobey rules face punishments from governments. However, observing the riders involving human with manual road traffic monitoring become difficult with several riders in the road at once. Singhet al.[48] proposed visual big data analytics to automatically detect bike riders without a helmet in the city. They gathered visual dataset with a surveillance system at India Institute of Technology Hyderabad campus then hired visual features for extraction. Singhet al.[48] compared three visual features, namely, a histogram of oriented gradient, scale-invariant feature transform, and local binary patterns for classification. Therefore, they selected the OpenCV platform to run the SVM classifier to categorize the extracted features. Singh et al. [48] successfully obtained high classification results, 98.88% and 93.80% for the detection of bike riders and violators, respectively.
2) CCTV: INTELLIGENT AUDIO-VISUAL EMOTION RECOGNITION
Many companies nowadays realize that customer satisfaction on services or products is the key to business success. Hence, various works increasingly use customer relationship man-agement (CRM) to emphasize customer relationships. How-ever, CRM usually provides the stand-alone audio mining technique to identify customer emotion through voice tone. Seng and Ang [49] claimed that providing further insights into customer emotion through voice tone only is inaccurate. Therefore, voice and visual emotion recognition must be combined. Customer satisfaction analysis is then performed using visual and audio analytics system for a contact cen-ter. The combination of audio and visual analytics for the emotion recognition module can recognize the six universal emotions (happy, angry, sad, disgusted, surprised, and afraid). The video recording captures the customers’ faces (visual data), and voice from speech (audio data), thereby allowing the transformation from emotion to customer satisfaction score [49].
3) SURVEILLANCE SYSTEM: TUNING HYPER-PARAMETER OPTIMIZATION
Many cameras are installed in various places in cities to track or allocate the person of interest. These cameras pro-duce videos and have consumed massive data, which are impossible for humans to manually process. Such data also lead to many hyperparameters. Selecting precise parameters is time consuming, and the possibility of an inaccurate result is high. Yaseenet al.[50] proposed hyper-parameter tuning through a mathematical model and optimized the parame-ters to achieve high object classification accuracy. They also adopted Spark for parallel and distributed training for object classification with the deep convolutional neural network (CNN). Several parameters are tracked during the training of deep CNN and are represented in the form of a graph multiple times to identify the pattern in the system. Then, the result generated by tuning the hyperparameter is ana-lyzed, and various values are obtained. Finally, parameters that can produce the best results are suggested. However, this technique works quickly for small networks only and per-fectly fits matrix computation scenarios, which usually occur in CNN [50].
4) DRONE TRAJECTORY: MODEL PREDICTIVE COMPRESSION
In remote areas or disaster zones, drones are deployed as a surveillance to collect site survey videos and detect and track multiple targets. However, the traditional method analyzes such videos in offline mode after drones fly because of the network bandwidth and limited computational capability. Current video analytics allows online analysis by video compression approach to minimize the network bandwidth and maximize the application utility. Hence, Chowdhery and Chiang [51] implemented the model
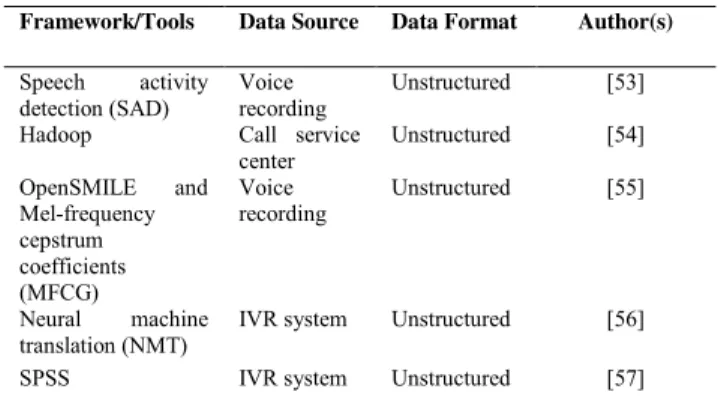
TABLE 4.Summary of voice analytics case studies.
predictive compression to estimate overlapped areas among subsequent image frames on the basis of drone trajectory. Selected compressed images are then transmitted to the ground station where images are processed using the machine vision pipeline. Doing so renders online video analytics and gives feedback to the compression module on drones [51].
5) HETEROGENEOUS CAMERA: MULTI-CAMERA VEHICLE TRACKING
In urban areas, multiple heterogeneous cameras are installed around cities. Hence, heterogeneous cameras add constraint to power and video cloud processing limitations. In addition, the commercial surveillance system does not support hetero-geneous camera processing because the system requires the centralized collection of videos. Therefore, Qiuet al. [52] contributed to Kestrel video analytics for vehicle tracking. Kestrel visual analytics provides captured vehicle images, and the system returns the sequence of cameras in which vehi-cles are seen. This analytics can quickly search for specific events or sequences of events with CNN [52].
C. CASE STUDIES FOR VOICE ANALYTICS
This section discusses various case studies related to voice analytics in big data. Table 4 details the following case stud-ies, which explore the adoption of text analytics.
1) VOICE RECORDING: AUTOMATED VOICE ASSESSMENT STUDENT COLLABORATION
Collaborative learning activities in classrooms usually contain information that is useful for analyzing simple behaviors when working with students. Collaboration is an important skill for student learning development. This skill can also help teachers monitor student collaborative activities in classes or small groups with many students. Bassiou et al. [53] used student speech activity to predict the non-lexical information quality of small group collabo-ration. They recorded student voices with individual noise-canceling microphones to the separated audio channel from each student. Then, speech activity detection identifies the dataset features on the high unweighted F1 measure esti-mated across a 10-fold cross-validation scheme using the
SVM classification method. Bassiou et al. [53] achieved promising features and good accuracy predictor results.
2) CALL SERVICE CENTER: CALL CENTER PERFORMANCE EVALUATION
CRM is a technology for managing all company relation-ships with customers. To measure the performance of cus-tomer service agents, managers must listen to the recorded calls from the CRM system. However, massive information today contains various forms such as customer emails, social media data, audio data, and video data, which need advanced analytics techniques. Karakus and Aydin [54] developed a method to evaluate call center performance in big data and text mining technique. They collected call center recorded calls and converted them to textual data using Google Speech API. Such textual data are tested in Hadoop and MapReduce to analyze call center conversations by providing quality criteria such as accuracy, completeness, and reliability for monitoring and performance management. Karakus & Aydin (2016) demanded for an automatic performance eval-uation system to reduce employee cost and time efficiency.
3) VOICE RECORDING: DEPRESSIVE DISORDER VOICE RECOGNITION
In the medical area, voice data contain various information on the diagnosis psychiatric symptom from patient talk session. Moreover, from this talk session, psychiatrists and psychol-ogists cannot easily understand what patients say because of their muffled speech. Taguchi et al. [55] investigated the relationship between mel-frequency cepstrum coefficient (MFCC) and depression for the biomarker for depression patients with OpenSMILE. The datasets are gathered from the voice recording of depression patients during the clin-ical interview session. The voice recording then undergoes acoustic feature extraction and is compared between patients and health control. Taguchiet al.[55] also argued that MFCC 2 corresponds to the low voice spectral energy in depression patients, contributing 80% of accuracy. However, their work needed many participants to gather additional samples of datasets to improve the reliability of results.
4) INTERACTIVE VOICE RESPONSE (IVR): MULTILINGUAL AUTOMATED DIALOG TRANSLATION
Many commercial and service customers come from dif-ferent locations and have various language proficiencies. Understanding the varying language is challenging due to the language barrier, which needs multilingual spoken dialog system to translate. However, many previous speech recog-nition technologies have created this kind of analysis, which requires human intervention or depends on intent analysts. Furthermore, Ruizet al.[56] proposed an automatic speech recognition (IVR) system, which minimizes the number of language proficient intent analysts necessary to support a production-scale multilingual dialog system in the absence of target language. They also evaluated their automatic speech recognition framework with machine learning classifier to
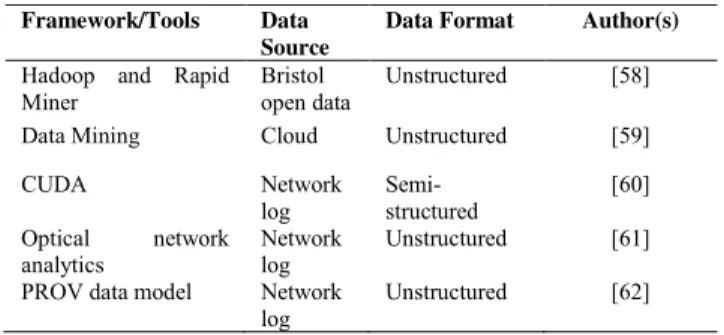
TABLE 5.Summary of network analytics case studies.
the training dataset, which consists of unique vocabulary words. The dataset is gathered from the IVR in the native Spanish language, which translates to native English model with neural machine translation sequence to encoder-decoder sequence.
5) IVR: OUTPATIENT TREATMENT WITH IVR ASSESSMENT ANALYSIS
IVR is an automated telephony menu system that is syn-onymous with the segmentation routing of callers to the appropriate recipients. This IVR assessment however imple-mented in the healthcare area for adolescent and young adult as treatment-as-usual procedure in outpatient treatment. The data gathered are used to monitor the clinical samples of patients with mental health problems. On the contrary, Anderssonet al. [57] investigated whether adolescents and young adults using the treatment can show reductions in summary feedback score measures for stress, depression, and anxiety symptoms. The dataset for analysis is collected from the IVR assessment, which is conducted twice a week during the three-month period to determine whether patients continued or discontinued treatment. All the statistical data are analyzed with the statistical software SPSS.
D. CASE STUDIES WITH NETWORK ANALYTICS
This section explains various case studies related to network analytics in big data. Table 5 presents the following five case studies, which investigates the use of network analytics.
1) CLOUD: CLOUD-BASED ANALYTICAL SERVICE
In the smart city, ICT advances in the presence of IoT and future Internet technologies. ICT tools usually deal with different domains, such as land use, transport, and energy, that are employed to provide an integrated information about socioeconomic growth. The great challenge is to obtain the real value from such data to gain new information because smart city-based data analytics is complex and fast evolv-ing. Khanet al. [58] proposed a prototype for cloud-based analytical service architecture and implementation for the analysis of selected case study data. They also developed two implementations using Hadoop and Spark to compare the suitability of such infrastructures for Bristol open data analytics. Such analytics can show correspondence between
different variables to predict and assign priority ranking about livable areas in Bristol in the future.
2) SENSOR: SMART AGRICULTURE MULTIDISCIPLINARY MODEL IN IoT WIRELESS SENSOR
Agriculture is the most important source to generate income for the human population in India. However, the techno-logical involvement in the agriculture sector is favorable. The increasing number of smartphone users in rural areas is encouraged to develop a portable sensor kit for sensing soil properties for the current requirement of fertilizers. Soil data are collected and sent to AgroCloud storage for further processing. Channeet al.[59] proposed a multidisciplinary model for smart agriculture; this model analyzes the fertilizer and market requirement, best crop sequences, total produc-tion, and current stock. The proposed model uses wireless IoT sensors to gather farming data in detail. The data are kept in the AgroCloud storage to be accessible in the pro-posed model. The model consists of five modules, namely, sensorKit module, mobile App module, AgroCloud module, big data mining analysis, and government and AgroBank UI. Thus, this proposed model is helpful in estimating the total production, meeting fertilizer requirement, controlling cost, and notifying farmers about the agriculture situation.
3) NETWORK LOG: NETWORK TRAFFIC ANALYSIS IN NETWORK PERFORMANCE
The drastic change of Internet users has brought major chal-lenges for telecommunication networks to manage network performance. However, many connected devices to the Inter-net require a powerful tool and method to increase Inter-network performance. Moreover, working with massive information from network traffic with traditional tools and methods is nearly impossible. Barrionuevoet al.[60] proposed a method using general purpose graphic processing units (GPGPUs) and programming to accelerate in the process of network performance. Barrionuevoet al.[60] aimed to analyze traf-fic through the network to determine behavior in real time or time interval. Therefore, the dataset was collected from network monitoring and then analyzed for recognition and classification according to the characteristics. Their finding indicated that GPGPU is a good alternative to improve net-work performance.
4) NETWORK LOG: MULTILAYER NETWORK ANALYTICS WITH SOFTWARE DEFINE NETWORKING (SDN)-BASED MONITORING
The emerging fifth generation networks rely on innovative optical access as well as metro and core networks for great flexibility in all parts of the networks. Network analytics is widely used for network management and monitoring. However, traditional network analytics lacks full network information, especially in the optical network, and becomes dynamic to support various network services. Yanet al.[61] proposed a novel SDN-based monitoring analytics frame-work for multilayer netframe-work analytics in coverage packet
TABLE 6.Summary of geospatial analytics case studies.
and optical networks. This framework collects multilayer monitoring information to facilitate network operations, then diagnoses and analyzes optical networks for further network re-planning and optimization. The experimental results reveal that this framework helps the control plane to efficiently configure the network in hardware and network reliability.
5) NETWORK LOG: DATA ANALYSIS USING PROVENANCE DATA
Provenance data contain a piece of information that can expose how information flows in the system and help users decide if the information is trusted. The typical appli-cation cannot easily interpret their information manually because provenance graphs rapidly grow and are complex. Huynhet al.[62] proposed the provenance network analytics approach, which combines network analysis and machine learning technique that can automatically generate prove-nance information from logs and applications. They adopted the PROV data model for data analysis to identify document owners. Huynhet al.[62] also argued that their provenance graph can describe the origin of data and reveal the interaction of agents in connected activities.
E. CASE STUDIES WITH GEOSPATIAL ANALYTICS
This section discusses various case studies related to geospa-tial analytics in big data. Table 6 details the following six case studies that explore the use of geospatial analytics.
1) VOLUNTEERED GEOGRAPHIC INFORMATION (VGI): CROWDSOURCED GAZETTEER ANALYSIS
VGI has recently dominated social media and produces huge geotagged information. Such an information includes pub-lic place names, place descriptions, and diverse comments according to experience. VGI contributes information that can construct gazetteers for mapping. Gazetteers are dic-tionaries of georeferenced place names, which are impor-tant in geographic IR. However, processing data mining and harvesting is computationally intensive for existing tools. Gao et al. [63] introduced a novel approach to harvesting crowdsourced gazetteer entries from social media and per-forming spatial analysis in a cloud computing environment.
They also designed and implemented scalable distributed platform on the basis of Hadoop for processing Big Geo-Data and facilitating the development of crowdsourced gazetteers.
2) SATELLITE IMAGE: DEPTH COVER IN PIPELINE INFRASTRUCTURE MONITORING
In many countries, many pipeline infrastructures are deeply buried under the ground. To discover the measurement of these pipelines, a visual inspection with a combination of human eye and photogrammetric techniques is employed. However, this technique is prone to occlusion failure because it requires clear tree cover over the buried pipelines and demands huge storage resources in real scenarios. Hornaceket al.[64] proposed the geospatial analytics system scalability afforded by the cloud to monitor the depth of cover in scale to solve the issues. They also adopted Elastic Com-pute Cloud service by Amazon Web Services, thus providing two storage areas—relational database management system for structured data and file storage for unstructured data. The pipeline depth cover is estimated using vegetation-free digital terrain model in the case of ALS or digital surface model in the case of photogrammetry [64].
3) SATELLITE IMAGE: DISCOVER POTENTIAL LOCATION FOR WATER HARVESTING
Water plays an important role in human life. Insufficient water in certain places has a huge impact on agriculture and people’s routine. The rapid climate change and global warming can cause less rainwater harvesting and doughtiness than usual. This situation can result in vulnerability in the farm sector, in which many people depend on farming for socioeconomic purpose and food chain. However, due to the imprecise weather prediction of meteorological offices, a new approach is crucially necessary. Gupta et al. [65] proposed strategy solution to explore potential locations for water harvesting to tackle socioeconomic factors. They gath-ered geospatial and environmental data by capturing satellite images that consist of normalized difference water and veg-etation indices. Guptaet al.[65] also performed a feasibility analysis of statistical models to generate the most relevant geospatial analytics and thus explore potential water harvest-ing locations.
4) GEOGRAPHIC INFORMATION SYSTEM (GIS): GLOBAL MANGROVE BIOMASS AND CARBON ESTIMATION
A mangrove is a group of trees that lives in the coastal intertidal zone. Mangrove plays an important role in regu-lating carbon cycling and can affect global change. Estimat-ing mangrove and carbon stock is important to identify the losses of mangroves and terrestrial carbon cycling. However, the common approach in estimating mangrove biomass and carbon stock is limited on the local scale and is typically based on scaling approach. Tanget al.[66] proposed a frame-work, which integrates GIS-based geospatial analysis and high-performance parallel computing for the estimation at the global level. The framework comprises five major steps,
namely, selection of SRTM tiles, extraction of mangrove canopy height, calculation of mangrove area, estimation of biomass and carbon in mangrove forest, and parallel com-puting for accelerating the spatially explicit estimation. Par-allel computing allows the decomposition of large datasets into small computation with high-performance computing resources.
5) VGI: FLOOD INUNDATION VALIDATION
Flooding is one of the most dangerous global situations. Flooding can cause huge economic losses, and recovering from this situation is difficult. Hence, new methods or pre-dictive models are necessary to observe and understand flood events. However, Rollason et al. [67] proposed a statisti-cal method of comparison against observed data to provide information on the flooding process from VGI. They demon-strated the models by reconstructing in detail a severe flood situation to validate the outputs of the 2D flood inundation model of the event. The output validation can reflect the diverse nature of data. Their study involves modern numer-ical modeling to further stimulate complex river-floodplain interaction [67].
6) GEOGRAPHIC INFORMATION SYSTEM (GIS): VISUALIZING GEOTAGGED MICROBLOGS
The popularity of online social media usage growing a mass microblogs form a stream data including geotagged and real-time event with high arrival rates. Geotagged microblogs can help users find a wide variety of location-specific informa-tion from a device. However, there is limited applicainforma-tions that can support arbitrary queries on multiple attributes (spa-tial, temporal, and keyword) and interactive visualization. Magdyet al.[68] present Taghreed a full-fledged system for efficient and scalable querying, analyzing, and visualizing geotagged microblogs. They introduced the system with four main components such as indexer, query engine, recovery manager and visualizer. This system provides effective prun-ing for the microblogs search space and support queries on real-time microblogs [68].
F. TOOLS
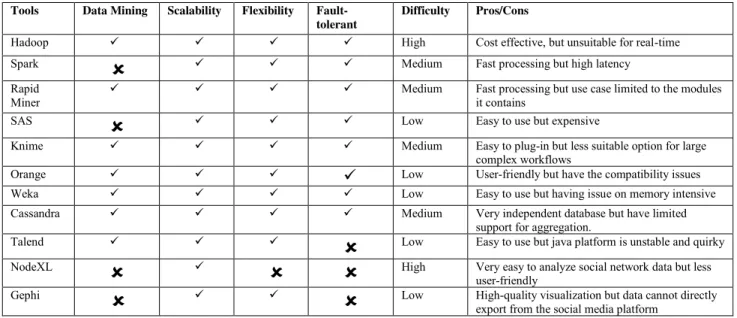
Most researchers face challenges in selecting suitable tools to process huge datasets. The reason is that unsuitable tools may cause certain issues to rise. For example, 32% of tools lack in database analytics, 23% have a scalability problem, 22% are slow in processing, and 21% load data too slowly [4]. Singh and Reddy [69] suggested several factors that must be considered in the selection of tools that are suitable for big data analytics, namely, data size, processing speed, and model development. Thus, selecting the perfect tools for datasets is crucial. In this section, we provide an example from recent studies on platforms used and their characteristics. Table 7 summarizes the big data analytics platform with data mining, scalability, flexibility, fault toler-ance, difficulty, and pros/cons
TABLE 7. Big data analytics platform.
Hadoop:is an open-source software that essentially mod-ules the design for big data analytics. Hadoop can quickly store and process any kind of massive data with data vol-umes and varieties that constantly increase, especially from a mobile and an IoT device [70]. Hadoop is popular for its fault tolerance and scalability to process huge volumes of data. Hadoop also offers high throughput access, such as HDFS and MapReduce modules, for parallel processing with large datasets.
MapReduce: is a programming model and framework used in Hadoop to enable the processing of large data in parallel computing clusters. MapReduce serves two essential functions mapping, which sorts and filters a given dataset and reducing, in which resulting information is calculated. How-ever, MapReduce is inefficient in iterative algorithms and is undesignated for iterative processes. Thus, MapReduce is an effective and efficient tool for large-scale fault tolerant data analysis [71].
Spark: is an open-source big data processing frame-work, which can use Java, Scala, Python, and R algo-rithms. Spark is reported to work up to 100 times faster than Hadoop in a certain classification [72]. This frame-work can also handle advanced data and perform streaming analytics [73].
Storm:is an open-source tool suitable for real-time pro-cessing data. This tool, which was developed by Storm, started as a BackType for social media analytics [74]. Storm is currently used in many cases such as real-time analytics, online machine learning, continuous computation, and dis-tributed RPC.
RapidMiner:is open-source tool for data mining and for analyzing data in the memory. This tool, which was devel-oped by RapidMiner Studio, is a powerful GUI that enables
users to create, deliver, and maintain predictive analytics. RapidMiner is a suitable solution for unstructured data such as text files, log traffic, or images [75].
Knime:is an open-source tool built for the analytics plat-form to discover potential inplat-formation insight data. This tool is fast to deploy, easy to scale, and intuitive to learn [76]. Knime can also provide a graphical workbench for visual-ization [77]
Orange:is an open-source machine learning and data visu-alization [78]. This tool has an interactive data analysis with a large toolbox and supports the remote execution of analysis and visualization for advanced spatial analysis features and models [79].
Weka: stands for Waikato environment for knowledge analysis [80]. This tool contains many machine learning algo-rithms for data mining. Weka is also useful for evaluating the performance of different learning models, data analyses, and predictive models [81].
Cassandra:is a NoSQL wide column-oriented database management system under the Apache project. Cassandra is a scalable database that is easy to configure and is designated to manage enormous datasets [82]. This tool can handle several concurrent users across the data center.
Talend:is an open-source tool that can easily run analytics using Hadoop technologies, such as HDFS, HBase, Hive, and Pig and Sqoop [83]. However, Talend is still in beta and lacks any support for cross-origin data [84].
NodeXL:is an add-in content analysis in Microsoft Office Excel and is divided into two types (free and commercial). This tool can import data from the social media API and visualize, report, and analyze network graph [85].
Gephi:is an open-source tool that is popular with visual-ization and exploration for graph and network analyses [86].
TABLE 8. Summary of case studies from the industry.
Gephi is interactive and can run several algorithms at the same time in a separate workspace without blocking user interface [87].
IV. CASES OF DATA ANALYTICS USAGE
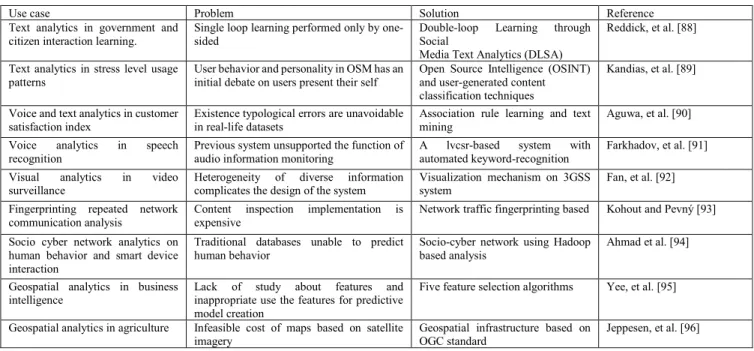
The following case studies discuss how scholars employ data analytics for their projects. Table 8 details the nine case report studies that explore the problems and solutions in data analytics.
A social media text analytics framework for double-loop learning for citizen-centric public services: A case study of a local government Facebook use
Local governments use Facebook to learn social media interaction with citizens to determine the impact of social media pages on public service. Public service focuses on citizens who participate in social service and organizational learning for enhancement. Citizen interaction in a public service page on Facebook is observed, and unstructured textual data are analyzed with qualitative approach. Thus, Reddick et al. [88] proposed a two-stage text analyt-ics framework that generates insights from G-posts and C-posts on the Facebook page. They revealed the pub-lic interest with potential information for pubpub-lic service management [88].
Stress level detection via online social network (OSN) usage pattern and chronicity analysis: An OSINT threat intelligence module
Text analytics is used to detect stress level by the social media usage pattern through posting a questionnaire on Face-book. Then, feedback is received from Facebook users. This work focuses on psychology studies to reveal the actual per-sonality rather than self-idealization. To reveal perper-sonality,
IBM APSS Statistics tool is employed to analyze the data and examine potential common user characteristics while performing unsupervised learning. Thus, text analytics is a perfect way to reveal the insight into unstructured data toward meaningful information [89].
Modeling of fuzzy-based voice of customer (VOC) for business decision analytics
Aguwa et al. [90] revealed that customer feedback and voice data can determine customer satisfaction. They con-verted VOC to textual context to identify client satisfac-tion. Aguwa, et al. [90] also developed a fuzzy-based VOC analysis model and combined the model with text mining technique to map out Integrated Customer Satisfaction Index. This technique can improve customer expectations and can further interpret customer needs.
Application of speech analytics in information space monitoring systems
The voice analytics in the study of Farkhadovet al.[91] is different from the previous work. The system used by Farkhadov et al. [91] is built to analyze telephone quality speech in real-world application. To analyze quality speech, they applied large-vocabulary continuous speech recognition to recognize keywords from speech. They also build a system using CMU Sphinx tool to train an acoustic model to enable predefined linguistic rules. Although this technique has an irremovable drawback, Farkhadovet al. [91] claimed that voice analytics can help businesses further manage their daily routine and enhance their operation.
Heterogeneous information fusion and visualization for a large-scale intelligent video surveillance system
Regarding the management of daily routine, the intelli-gent video analytics proposed by Fan et al. [92] with a
video surveillance system can detect alerts and events without manual monitoring. This proposed event-driven visualiza-tion and data fusion process has four subsystems, namely, intelligent visualization, sensor tasking, communication, and video streaming and storage. However, during the six-month experiment period, the system failed to detect three anomalies from 33 formal test runs. Moreover, the system triggered alerts by attention task working on stationary cameras. Sub-sequently, the visualization agent assumed the responsibility of capturing close-up images of human faces by controlling a collaborative PTZ camera.
Network traffic fingerprinting based on approximated kernel two-sample test
In a constant growth of network traffic volume, Kohout and Pevný [93] suggested that content inspection is prohibitively expensive because detection systems should work in real time. Therefore, they proposed a framework that can be used in different analyses, that is, a framework for fingerprinting repeated communication over a network. This fingerprint approximates maximum mean discrepancy to efficiently estimate from a small number of observa-tions and to compare the joint distribution of features with-out explicitly estimating their probability density function. Kohout and Pevný [93] demonstrated that the running time is lower than that of the prior art.
Socio-cyber network: Potential of cyber-physical sys-tem to define human behaviors using big data analytics
Ahmad et al. [94] believed that human behavior can be derived from the interaction between a smart device and its owner. This work is also motivated by expanding net-work volume. Therefore, the ‘‘socio-cyber netnet-work’’ analyt-ics is proposed to provide an insight knowledge of big data that is generated when the smart device is connected to its owner. From the data generated, Ahmadet al.[94] proposed analytics that can be integrated with a different applica-tion under the same domain, which provides the generalized framework that can help in case of security, healthcare, and transportation.
Geospatial analytics in retail site selection and sales prediction
Geospatial analytics is not only referred to location ana-lytics but is also perceived as an intersection between BI and geographic analysis. Tinget al.[95] believed that site selec-tion and sales predicselec-tion can estimate through a geographic information system. They suggested five feature selection algorithms and four different similarity measurement meth-ods to obtain precision location prediction.
Open geospatial infrastructure for data management and analytics in interdisciplinary research
Jeppesen et al. [96] adopted geospatial data analytics to investigate categorized fields on the web interface of GeoNode. Doing so identifies possible intra-field variations, which are then inspected. Jeppesenet al.[96] also maximized the identification field for agriculture use cases and trans-ferred the data from a machine to cloud storage. Such data can provide user-friendly web applications.
V. FUTURE OF BIG DATA ANALYTICS
Big data analytics and deep learning technique are new devel-oping research areas that appeal to data scientists, scholars, and researchers to further examine various fields. The big data mentioned in SectionII-Arefers to the exponential growth and wide availability of digital data, which are difficult to manage and analyze using traditional tools and technologies. Thus, big data analytics is a process of analyzing and acquir-ing intelligence from big data to make data worth seeacquir-ing and meaningful [22]. Big data analytics also contains multi-source big data collecting, distributed big data storing, and intra/inter big data processing [8].
With the great potential and revolutionary from big data, the development of advanced technologies and interdisci-plinary teams can work as one. Data analytics is motivated by the exponential growth of data. Deep learning technique is also motivated by the growth and complexity of cellular platforms, which provide end user immediate access to oper-ational data and apply analytics to business processes and net-work management [97]. This process is challenging due to the increasing data traffic that leads to big data, thereby decreas-ing revenue per user and user growth expectation for service quality. However, deep learning services are important for communication service providers because they are involved in a digital network. Moreover, big data analytics utilizes deep learning algorithms to extract high level, complex abstrac-tions as data representaabstrac-tions through the hierarchical learning process [7]. The sole objective of deep learning technique is to learn complex and abstract data representation hierarchically, although they pass through multiple data transformation layers [98].
Blasting OSNs have recently dominated people around the world in their daily life. According to the statistical social network survey conducted by Chaffey [99], over 1.870 mil-lion active Facebook users exist around the world as of January 2017. Facebook, which collects and analyzes mas-sive data on a daily basis, is aggresmas-sively pushing forward deep learning technique-related projects [100]. The excessive growth of OSNs has attracted much attention from data sci-entists and researchers to investigate this big data category to the next level.
Big data analytics serves as a good opportunity for mobile cellular networks with performance improvement. The data accumulated from the excessive growth of mobile sensing applications can exceed the server processing capability. Therefore, big data analytics is the technique suitable to use for processing large-scale data. However, big data in the net-work also causes a bottleneck for real-time data, such as video surveillance, visual maps, video games, and other integrated mobile sensors. Thus, the fifth generation network standards are proposed and bring the network speed 10 times faster than before [101]. Moreover, in today’s generation usage of smartphones, computing the complex features of deep learn-ing technique is important. The reason is that deep networks within the deep learning method can develop a complex hierarchy of concepts. Moreover, when unsupervised data are
FIGURE 2. Decision making process in big data analytics.
collected, and machine learning is executed, such data are manually labeled with human effort. This process is time consuming and expensive. Therefore, employing the deep learning technique is introduced as it can identify specific data.
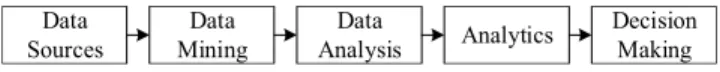
In the meantime, big data analytics has changed the requirement in the decision making process to make a strate-gic, tactical and operational decision [102]. The role of big data in decision making leading companies into their main-stream business practice that helps them to predict future outcomes, optimize the supply chain and developed real-time decision making [103]. Figure 2 describes the process of successful decision making in big data analytics. Starting from developing variety of data sources that correlate with business model, then discovering patterns in large datasets for query and analysis purpose, follow by developing a team of analytics professional with great skills to get insight the data and develop model using algorithm or tool to extract the information by three types of analytics (descriptive, pre-dictive and prescriptive). Lastly, companies can improve the ability of managers to make better business decisions from the available information.
VI. CONCLUSIONS
In this study, we provide an overview of big data defini-tion from several recent studies, in which big data only refers to three V’s (volume, variety, and velocity). Other researchers have later added three other V’s (value, variabil-ity, and veracity) and complexity to picture the meaning of big data. We also discuss the challenges that arise from big data according to the six V’s and complexity factor. In addition, we focus on big data analytics and its benefits, and a few cases are described to indicate the real benefits of big data analytics, which is characterized according to five categories, namely, text, voice, video, network, and geospatial analytics. Many studies have witnessed that emerging analytics in big data is significant on effectiveness and the reliable analysis process. Big data analytics can also bring positive changes in many fields, such as education, military, healthcare, poli-tics, business, agriculture, banking, and marketing. Moreover, we report the challenges brought by big data. Furthermore, we provide industrial cases that adopt analytics in their work Finally, future research would focus on finding a new tech-nique that can solve the existing challenges and create a powerful tool that able to analyse blending data sources. Another future research line is to find out how to leverage the personal data while retaining their unique data advantages to protect the data privacy issues. Thus, data analytics are also important in a development successful decision making as it has the ability to perform descriptive, predictive and
prescriptive analysis. Our main objectives are to further understand big data analytics and identify the possible meth-ods, tools, and domains used in such analytics. Although our study does not completely resolve the problems involved in this topic, our objectives are addressed to a certain degree. Moreover, our research provides useful knowledge for researchers.
REFERENCES
[1] Cisco. (2017). Cisco Visual Networking Index: Global Mobile Data Traffic Forecast Update, 2015–2020. [Online]. Available: https://www. cisco.com/c/dam/m/en_in/innovation/enterprise/assets/mobile-white-paper-c11-520862.pdf
[2] S. Mackey, ‘‘How unstructured data fuels big data analytics,’’ ADLIB, Burlington, ON, Canada, Feb. 2018.
[3] J. Rizkallah, ‘‘The big (unstructured) data problem,’’ Forbes, Jun. 2017. [4] P. Russom, ‘‘Big data analytics,’’ TDWI, Washington, DC, USA,
Sep. 2011.
[5] A. Gani, A. Siddiqa, S. Shamshirband, and F. Hanum, ‘‘A survey on indexing techniques for big data: Taxonomy and performance evalua-tion,’’Knowl. Inf. Syst., vol. 46, no. 2, pp. 241–284, 2016.
[6] F. Halper, ‘‘Operationalizing and embedding analytics for action,’’ TDWI, Washington, DC, USA, Jan. 2016.
[7] M. M. Najafabadi, F. Villanustre, T. M. Khoshgoftaar, N. Seliya, R. Wald, and E. Muharemagic, ‘‘Deep learning applications and chal-lenges in big data analytics,’’J. Big Data, vol. 2, no. 1, p. 1, Feb. 2015. [8] C.-W. Tsai, C.-F. Lai, H.-C. Chao, and A. V. Vasilakos, ‘‘Big data
analyt-ics: A survey,’’J. Big Data, vol. 2, no. 1, p. 21, 2015.
[9] A. Oussous, F.-Z. Benjelloun, A. A. Lahcen, and S. Belfkih, ‘‘Big data technologies: A survey,’’J. King Saud Univ.-Comput. Inf. Sci., vol. 30, no. 4, pp. 431–448, 2018.
[10] M. M. Rathore, A. Ahmad, A. Paul, and S. Rho, ‘‘Urban planning and building smart cities based on the Internet of Things using big data analytics,’’Comput. Netw., vol. 101, no. 4, pp. 63–80, Jun. 2016. [11] J. Sun and C. K. Reddy, ‘‘Big data analytics for healthcare,’’ inProc. 19th
ACM SIGKDD Int. Conf. Knowl. Discovery Data Mining, 2013, p. 1525. [12] J. Klein, R. Buglak, D. Blockow, T. Wuttke, and B. Cooper, ‘‘A reference architecture for big data systems in the national security domain,’’ pre-sented at the 2nd Int. Workshop Big Data Softw. Eng., Austin, TX, USA, May 2016.
[13] T.-M. Choi, H. K. Chan, and X. Yue, ‘‘Recent development in big data analytics for business operations and risk management,’’IEEE Trans. Cybern., vol. 47, no. 1, pp. 81–92, Jan. 2017.
[14] K. Sin and L. Muthu, ‘‘Application of big data in education data mining and learning analytics—A literature review,’’ICTACT J. Soft Comput., vol. 5, no. 4, pp. 1035–1049, 2015.
[15] E. Fumeo, L. Oneto, and D. Anguita, ‘‘Condition based maintenance in railway transportation systems based on big data streaming analysis,’’
Procedia Comput. Sci., vol. 53, pp. 437–446, Jan. 2015.
[16] A.-L. Beall, ‘‘Hadoop survey results reveal use cases, needs and trends,’’ SAS, Cary, NC, USA, 2018.
[17] A. Gonçalves, F. Portela, M. F. Santos, and F. Rua, ‘‘Towards of a real-time big data architecture to intensive care,’’Procedia Comput. Sci., vol. 113, pp. 585–590, 2017.
[18] Y. Wang, L. Kung, and T. A. Byrd, ‘‘Big data analytics: Understanding its capabilities and potential benefits for healthcare organizations,’’Technol. Forecasting Social Change, vol. 126, pp. 3–13, Jan. 2018.
[19] S. Akter, S. F. Wamba, A. Gunasekaran, R. Dubey, and S. J. Childe, ‘‘How to improve firm performance using big data analytics capabil-ity and business strategy alignment?’’Int. J. Prod. Econ., vol. 182, pp. 113–131, Dec. 2016.
[20] K. Kambatla, G. Kollias, V. Kumar, and A. Grama, ‘‘Trends in big data analytics,’’J. Parallel Distrib. Comput., vol. 74, no. 7, pp. 2561–2573, 2014.
[21] A. Katal, M. Wazid, and R. H. Goudar, ‘‘Big data: Issues, challenges, tools and good practices,’’ inProc. 6th Int. Conf. Contemp. Comput. (IC3), Aug. 2013, pp. 404–409.
[22] P. Vashisht and V. Gupta, ‘‘Big data analytics techniques: A survey,’’ in
Proc. Int. Conf. Green Comput. Internet Things (ICGCIoT), Oct. 2015, pp. 264–269.