© 2014. V. Jyothsna & V. V. Rama Prasad. This is a research/review paper, distributed under the terms of the Creative Commons
Global Journal of Computer Science and Technology:
ENetwork, Web & Security
Volume 14 Issue 7 Version 1.0 Year 2014
Type: Double Blind Peer Reviewed International Research Journal Publisher: Global Journals Inc. (USA)
Online ISSN: 0975-4172 & Print ISSN: 0975-4350
A Comparative Study on Performance Evaluation of Intrusion
Detection System through Feature Reduction for High Speed
Networks
By V. Jyothsna & V. V. Rama Prasad
JNTUH University, India
Abstract-
The rapid growth in the usage of the internet had led to many serious security issues in the
network. The intrusion detection system (IDS) is one of the sophisticated defensive systems used to
detect the malicious activities happening in the network services across the world.Hence, more
advanced IDS are been developed in past few years. To improve the performance of the IDS, the
system has to be trained effectively to increase the efficiency and decrease the false alarm rate. To
train the system the attributes selection plays the major role.This paper evaluates and compares the
performance of the intrusion detection systems for different feature reduction techniques in high
speed networks.
GJCST-E Classification : C.2.1 C.2.3
AComparativeStudyonPerformanceEvaluation ofIntrusionDetectionSystemthroughFeatureReductionfor HighSpeedNetworks
A Comparative Study on Performance
Evaluation of Intrusion Detection System
through Feature Reduction for High Speed
Networks
V. Jyothsna α& V. V. Rama Prasad σ Abstract- The rapid growth in the usage of the internet had led
to many serious security issues in the network. The intrusion detection system (IDS) is one of the sophisticated defensive systems used to detect the malicious activities happening in the network services across the world. Hence, more advanced IDS are been developed in past few years. To improve the performance of the IDS, the system has to be trained effectively to increase the efficiency and decrease the false alarm rate. To train the system the attributes selection plays the major role. This paper evaluates and compares the performance of the intrusion detection systems for different feature reduction techniques in high speed networks.
I.
Introduction
nternet is a global public network. In today’s world, with the rapid increase in the potentials of the Internet, business model adopted in the organizations has subsequent change. Every day the people connecting to the Internet are also drastically increased. Today’s a
very critical business model popularly used is E-Business.
With the internet, business organizations are having incredible approach of reaching the end users. But in the internet there will be both harmless and harmful users that may lead to lots of risk to the business organizations. The information availability to the end users is one of the main services adopted by every organization. At the same time the information becomes available to the malicious users also. Malicious users or hackers will use different techniques on organization’s internal systems to exploit vulnerabilities and compromise the system to access the sensitive information available in the system [1].
Every organization needs to adopt a security measure to overcome the accessing of data from the hackers. Many organizations across the world deployed firewalls to protect their private network from the Public network. Firewall protects the internal system by controlling the incoming and outgoing network traffic based on rule set. As the business organizations needs Author α: Research Scholar, Department of CSE, JNTUH, Hyderabad
Authorσ: Professor, Department of CSE, Sree Vidyanikethan Engineering College, Tirupati.
some kind of access permissions to the internal systems for the Internet users. These permissions may cause some vulnerabilities in the Private network through which the malicious users will have a change to get in to the system. So, the firewalls will not provide the 100% guarantee of the organization in securing the sensitive data present in the system.
One of the remedy to defence against the attacks in the network is intrusion detection system (IDS) [2]. An intrusion detection system (IDS) is used to monitor suspicious activities in the network traffic and alerts the system or network administrator. In some cases the IDS is not only used to detect the anomalous or maliceousstraffic but also for taking action such as blocking the user or source IP address from accessing the network.
Initially, Intrusion Detection Systems [3, 4] were implemented to run on individual hosts or network devices to monitor the inbound and outbound packets from the device and alert the user or administrator about suspicious activity. This sort of detection is called host based (HIDS) intrusion detection systems. But the gradual evolution of the network led to focus on network based (NIDS) intrusion detection systems which is used to monitor traffic to and from all devices in the network by scanning all inbound and outbound traffic that would affect the overall speed of the network.
Depending upon the type of analysis used to detect the anomalies, IDS are classified as Signature based and Anomaly based detection systems [5]. Signature based detection system also called misuse detection will monitor the network packets and check the availability of signatures in the database. If the pattern matches it specifies as attack. It is similar to the most antivirus software. The main limitation is it will only detect the attack whose attack patterns are already present in the database i.e., known malicious threats. It is unable to predict the new attacks. But the other type of analysis technique so called Anomaly based detection system will analyse the behaviour of the network and establish the baseline. If the activities in the network deviate from the baseline it will consider as malicious threat.
I
Global Journal of Computer Science and Technology Volume XIV Issue VII Version I
39 Year 2014 (DDDDDDDD ) E e-mail: [email protected].
The benchmark dataset usually adopted by the research community of intrusion detection is KDD99 [6]. Each record in the dataset is labelled as normal or attack. Each record in the dataset will consist of 41 features. The features are categorized into four clusters. They are Basic Features, Content Features, Time-based Traffic Features and Host-based Traffic Features. The data records labelled as attack falls in one of the following four types:
• DoS: It denotes the denial of service attack. By denial of service attack, the legitimate user will not be able to access the services for which he has the access permissions. Some of the categories of DoS attack are Apache2, Back, Land, Mail bomb, etc.
• U2R: U2R means user to root attack. In this class of attack user subscribe the service as normal user and then slowly tries to exploiting various vulnerabilities of the system. Some of the types of U2R are Eject, Ffbconfig, Fdformat, Load module, etc.
• R2L: R2L is remote to local attack. In this kind of attack a remote user gains access of the local user account through network communication and tries to access the sensitive information in the system. Some of the kinds of R2L attacks are Sendmail, Xlock, Xsnoop, etc.
• Probe: A Probe attack is used to scans the network to find the vulnerabilities of the system through which the hacker or attacker can peep into the system for further attacks.
In this paper the performance of IDS is evaluated by comparing different feature reduction techniques such as Correlation-based feature reduction (CFS), Gain ratio (GR), Information gain (IR), Principal component analysis (PCA), Gini Index (GI) and Optimized Least Significant Particle based Quantitative Particle Swarm Optimization (OLSP-QPSO). Rest of the paper is organised as follows: Section 2 provides the various feature selection techniques applied for IDS. Section 3 presents the comparison of feature selection techniques. Section 4 focuses on the Performance Evaluation by different feature selection techniques. Finally, Section 4 concludes and provides suggestions for future scope.
II.
Feature selection techniques
Feature selection also called attribute selection or variable subset selection. It is used to select the subset of relevant features needed for the model. The data set used in the constructed model will consists of relevant, redundant or irrelevant features [7]. So, the key assumption used in the feature selection technique is removing the data which are redundant or irrelevant. The attribute or feature which does not provide any more information than the currently selected features then such type of features are called as Redundant and if the
feature does not consist of useful information in any context then they are called as irrelevant features. Feature selection is also useful as part of the data analysis process, as it shows which features are important for prediction, and how these features are related [8, 9].
A feature selection technique provides the following benefits for analytical models:
• Improves the performance of the system.
• Increases the accuracy of prediction
• Need short time for training through which overall time of execution can be reduced.
The performance of the system will depend on detection rate and the false alarm rate also called as false positive rate. The detection rate is defined as the number of malicious packets detected by the system (True Positive) divided by the total number of malicious packets present in the data set. False Alarm Rate is defined as the number of normal packets detected as malicious packets (False Positive) divided by the total number of normal packets. Normally the IDS need to have high detection rate and low false alarm rate. To retrieve have high detection rate and low false alarm rate training the system plays a vital role. To train and improve the performance of the system all the parameters of the packet is not needed. So, an appropriate feature selection technique has to be used to select the relevant features by removing the redundant and irrelevant features through which overall performance of the system can be increased by decreasing the training time and increasing the accuracy of detecting the attacks in the network [10,11].
a) Correlation-based feature reduction (CFS)
The Correlation Feature Selection (CFS) [12, 13] is a simple filter algorithm for evaluating and ranks subset of features based on correlation evaluation function. By observing the ranks for the attributes we can predict the correlation of the features. The features with high correlation will be considered as relevant features and low correlation can be ignored as Irrelevant features.
The following equation gives the correlation of features consisting k features:
r
k r
k
k
k
r
zc zi ii=
+ −
(
−
1
)
Whererzc = Correlation between the features.
k = Number of features.
r
zi = Average of the correlations between all features.r
ii= Average inter-correlation between features.A Comparative Study on Performance Evaluation of Intrusion Detection System through Feature Reduction for High Speed Networks
Global Journal of Computer Science and Technology Volume XIV Issue VII Version I
40 Year 2014 (DDDDDDDD ) E
b) Information gain (IR)
Information gain [14, 15] determines the importance of the attribute in the total training dataset by analysing the information content of attributes. It is also used to predict the ordering of the nodes in the decision tree where nodes are considered as attributes. The highest information gain attribute is chosen as the splitting attribute for node N. This attribute minimizes the information needed to classify the list of attributes in the resulting partitions. By this approach, the needed expected number of tests can be minimized to classify a given list of attributes and guarantees that a simple tree is found.
The information gain of the each attribute is calculated as follows:
Gain (A) = Info (D) – InfoA (D)
Where, AAttribute
Info (D) Information content of the total dataset InfoA(D) Information content of the Attribute A
Information content of the total dataset is calculated as 𝐼𝐼𝐼𝐼𝐼𝐼𝐼𝐼(𝐷𝐷) = − �P 𝑖𝑖log2(P𝑖𝑖) m i=1 Where, D Total dataset
i Total number of class labels in the data set Pi Probability of class label i in the data set
Information content of the Attribute A in the total dataset is calculated as 𝐼𝐼𝐼𝐼𝐼𝐼𝐼𝐼 𝐴𝐴(𝐷𝐷) = � |𝐷𝐷𝑗𝑗| |𝐷𝐷| ×𝐼𝐼𝐼𝐼𝐼𝐼𝐼𝐼(𝐷𝐷𝑗𝑗) 𝑣𝑣 𝑗𝑗=1 Where,
A Attribute in the dataset D
j Total number of different category values present in the attribute A
|Dj| Total number of jth category values in the
attribute A
|D| Total number of records in the dataset D
Info (Dj) Information content of jth category values of
the attribute A
c) Gain ratio (GR)
Gain ratio [16, 17] is also a method which is used to define the importance of the attributes. It is a modified version of the information gain that reduces its bias on high-branch attributes. The values of the Gain ratio will be Large when data is evenly spread and it is small when all data belongs to one branch. It will take
Gain ratio takes into account the number and size of branches when choosing an attribute. It has modified the information gain by taking into account the essential information of a split. It is based on how much information is needed to tell which branch an instance belongs to.
Gain ratio is calculated as follows
Gain Ratio (A) = Gain (A) / SplitInfo (A) Where,
Gain (A) The information gain of the attribute A Split Info (A) The splitting information of the attribute A
The splitting information is calculated as follows 𝑆𝑆𝑆𝑆𝑆𝑆𝑖𝑖𝑆𝑆𝐼𝐼𝐼𝐼𝐼𝐼𝐼𝐼 𝐴𝐴(𝐷𝐷) = − � |𝐷𝐷𝑗𝑗| |𝐷𝐷| × log2( |𝐷𝐷𝑗𝑗| |𝐷𝐷| ) 𝑣𝑣 𝑗𝑗=1 Where,
A Attribute in the dataset D
j Total number of different category values present in the attribute A
|Dj| Total number of jth category values in the
attribute A
|D| Total number of records in the dataset D
d) Principal component analysis (PCA)
Principal components analysis (PCA) [18] also known as the Karhunen-Loeve or K-L method is a useful statistical technique which is used to reduce the number of attributes or dimensions in the dataset without much loss in the information needed to analyse the data. The basic procedure is as follows [19, 20]:
1. Select the dataset for which the attributes or dimensions has to be reduced.
2. The dataset is normalized such that each attribute falls within the same range.
3. Initially calculate the covariance between one attribute with the other and derive the covariance matrix. Covariance is calculated as 𝑐𝑐𝑣𝑣(𝑋𝑋,𝑌𝑌) = ∑𝐼𝐼𝑖𝑖=1(𝑋𝑋𝑖𝑖 −𝐼𝐼 −𝑋𝑋�)(1𝑌𝑌𝑖𝑖 − 𝑌𝑌�) Where, X Independent variable Y Dependent variable
n Number of attributes in the dataset
𝑋𝑋𝑖𝑖Mean of the independent variable X
𝑌𝑌𝑖𝑖Mean of the dependent variable Y
Covariance matrix (for example X, Y, Z are the 3-dimensional dataset) is derived as
Global Journal of Computer Science and Technology Volume XIV Issue VII Version I
41 Year 2014 (DDDDDDDD ) E
C max=
𝑐𝑐𝑣𝑣(𝑋𝑋,𝑋𝑋) 𝑐𝑐𝑣𝑣(𝑋𝑋,𝑌𝑌) 𝑐𝑐𝑣𝑣(𝑋𝑋,𝑍𝑍) 𝑐𝑐𝑣𝑣(𝑌𝑌,𝑋𝑋) 𝑐𝑐𝑣𝑣(𝑌𝑌,𝑌𝑌) 𝑐𝑐𝑣𝑣(𝑌𝑌,𝑍𝑍) 𝑐𝑐𝑣𝑣(𝑍𝑍,𝑋𝑋) 𝑐𝑐𝑣𝑣(𝑍𝑍,𝑌𝑌) 𝑐𝑐𝑣𝑣(𝑍𝑍,𝑍𝑍)
4. Calculate the Eigenvalues(λ) and for the λvalues derive the Eigenvectors from the covariance matrix 5. Choosing components and forming a feature vector
After calculating the eigenvectors of the covariance matrix, then order the eigen values by highest to lowest. These values give the importance of the attributes. The attributes with lesser eigenvalues can be ignored and higher eigenvalues will be considered. The attributes after leaving out the lesser Eigen values is considered as feature vector.
6. Derive the final data set
Final dataset = Row feature vector * Row data adjust Where,
Row feature vector The transposed eigenvectors matrix with most important features at the top.
Row data adjust The transposed mean-adjusted matrix (Attribute values in each column, with each row holding a separate dimension).
e) Gini index (GI)
The Gini index [21] is used to extract the attributes mainly needed to analyse the data set to detect the attacks. It measures the impurity of data set D. The attribute with highest gini index is treated as the unimportant attributes and the lowest gini index is treated as important attributes to detect the attacks. Gini index for the attribute A is calculated as
Gini (A) = Gini (D) − GiniA (D)
Where,
Gini (D) impurity of the total dataset GiniA (D) impurity of the Attribute A
Impurity of the total dataset is calculated as
Gini(D) = 1− �P 𝑖𝑖 m i=1 2 Where, D Total dataset
iTotal number of class labels in the data set PiProbability of class label i in the data set
Impurity of the Attribute A in the total dataset is calculated as 𝐺𝐺𝑖𝑖𝐼𝐼𝑖𝑖 𝐴𝐴(𝐷𝐷) = |𝐷𝐷 1| |𝐷𝐷| ×𝐺𝐺𝑖𝑖𝐼𝐼𝑖𝑖(𝐷𝐷1) + |𝐷𝐷 2| |𝐷𝐷| ×𝐺𝐺𝑖𝑖𝐼𝐼𝑖𝑖(𝐷𝐷2) Where,
A Attribute in the dataset D
|D| Total number of records in the dataset D
|D1| Total number of subset pair category values of
attribute A
|D2| Total number of another subset category values
of attribute A
Gini (D1) Impurity of subset pair category values of
the attribute A
Gini (D2) Impurity of another subset category values
of the attribute A
f) Optimized Least Significant Particle based Quantitative Particle Swarm Optimization (OLSP-QPSO)
OLSP-QPSO [22] is an optimizing technique used to replace the QPSO. This technique is used to calculate the best swarm particles by applying a quadratic polynomial model. This process is an iterative process until the best swarm particles are been identified to analyse the attacks. The procedure for optimized QPSO algorithm is as follows
1. Swarm is initialized. 2. mbest is calculated
3. Update the position of the attributes 4. Estimate the fitness value for each attribute
5. If the present fitness value is better than the best fitness value in past, then update the existing fitness value by the current fitness value.
6. Update global best 7. Find the new attribute
8. If the new attribute is better than the worst attribute in the swarm, then replace the worst attribute by the new attribute
9. Repeat step 2 until maximum iterations is reached.
III.
Comparison between the different
feature selection techniques
Feature selection plays a major role for achieving the high performance intrusion detection system. Many feature selection techniques were proposed to select the relevant attributes from the data set. Some of the feature selection techniques mainly used was discussed in the previous section. The standard data set mainly used to experiment the intrusion detection system is KDD cup 1999. The KDD cup 1999 [23] consists of approximately 5 million training set records and 3 million test set records. The records are classified as normal or anomaly. The anomalies are broadly classified as four categories such as DoS, U2R, R2L and Probe. Only 19.86 % of the total training records are normal traffic and remaining are the attack traffic. Among the test set, 19.45 % is normal traffic and remaining is attack traffic. Each record in the data set will consists of 41 features. All the attributes in the data set is not needed to analyse the attacks in the network. So, appropriate technique has to be chosen to reduce the features for the data set. Selected feature reduction should not affect the performance of the system. The selected technique should increase the detection rate and decrease the false positives [24].
A Comparative Study on Performance Evaluation of Intrusion Detection System through Feature Reduction for High Speed Networks
Global Journal of Computer Science and Technology Volume XIV Issue VII Version I
42 Year 2014 (DDDDDDDD ) E
In this study, all the records in the training and test data set are considered. The number of attributes considered for each record in the training set is 41. The following table shows the comparison between the different feature selection technique and the number of attributes obtained after applying the technique.
Table 1 : The number of attributes selected for each feature selection techniques
Feature selection
methods Number of attributes selected
Correlation-based feature
reduction (CFS) 10
Gain ratio (GR) 14
Information gain (IR) 20 Principal component
analysis (PCA) 12
Gini Index (GI) 18
Optimized Least Significant Particle based Quantitative
Particle Swarm Optimization (OLSP-QPSO)
8
From the above table it is observed that among the specified feature selection techniques more number of attributes is reduced using the Optimized Least Significant Particle based Quantitative Particle Swarm Optimization (OLSP-QPSO).
Figure 1 : Number of attributes selected
IV.
Performance Evaluation by
different feature selection
techniques
The performance of the system will depend on detection rate and the false alarm rate [25]. The detection rate is defined as the number of malicious packets detected by the system (True Positive) divided by the total number of malicious packets present in the data set. False Alarm Rate also called as false positive rate is defined as the number of normal packets detected as malicious packets (False Positive) divided by the total number of normal packets. Normally the IDS
need to have high detection rate and low false alarm rate. This can be done by selecting the appropriate features needed to detect the attacks.
The general formulae used for detection rate and false alarm rate is calculated as follows
Detection rate = 𝑇𝑇𝐼𝐼𝑆𝑆𝑇𝑇𝑆𝑆 −𝑇𝑇𝐼𝐼𝐼𝐼𝑎𝑎𝑇𝑇𝑆𝑆𝑖𝑖𝑎𝑎𝑎𝑎 −𝑑𝑑𝑎𝑎𝑆𝑆𝑎𝑎𝑐𝑐𝑆𝑆𝑎𝑎𝑑𝑑
𝑇𝑇𝐼𝐼𝑆𝑆𝑇𝑇𝑆𝑆 −𝑇𝑇𝑆𝑆𝑆𝑆𝑇𝑇𝑐𝑐𝑎𝑎𝑎𝑎 ∗100
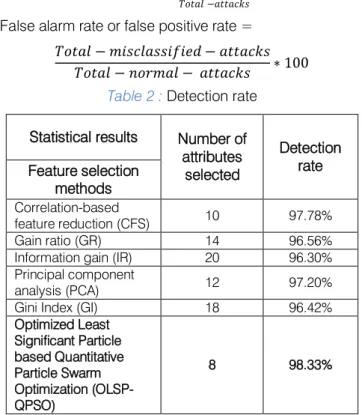
False alarm rate or false positive rate =
𝑇𝑇𝐼𝐼𝑆𝑆𝑇𝑇𝑆𝑆 − 𝑎𝑎𝑖𝑖𝑎𝑎𝑐𝑐𝑆𝑆𝑇𝑇𝑎𝑎𝑎𝑎𝑖𝑖𝐼𝐼𝑖𝑖𝑎𝑎𝑑𝑑 − 𝑇𝑇𝑆𝑆𝑆𝑆𝑇𝑇𝑐𝑐𝑎𝑎𝑎𝑎 𝑇𝑇𝐼𝐼𝑆𝑆𝑇𝑇𝑆𝑆 − 𝐼𝐼𝐼𝐼𝑛𝑛𝑎𝑎𝑇𝑇𝑆𝑆 − 𝑇𝑇𝑆𝑆𝑆𝑆𝑇𝑇𝑐𝑐𝑎𝑎𝑎𝑎 ∗100
Table 2 : Detection rate Statistical results Number of
attributes selected Detection rate Feature selection methods Correlation-based feature reduction (CFS) 10 97.78% Gain ratio (GR) 14 96.56%
Information gain (IR) 20 96.30% Principal component
analysis (PCA) 12 97.20%
Gini Index (GI) 18 96.42%
Optimized Least Significant Particle based Quantitative Particle Swarm Optimization (OLSP-QPSO) 8 98.33% 0 5 10 15 20 25 number of attributes selected
Global Journal of Computer Science and Technology Volume XIV Issue VII Version I
43 Year 2014 (DDDDDDDD ) E
Figure 2 :Detection Rate
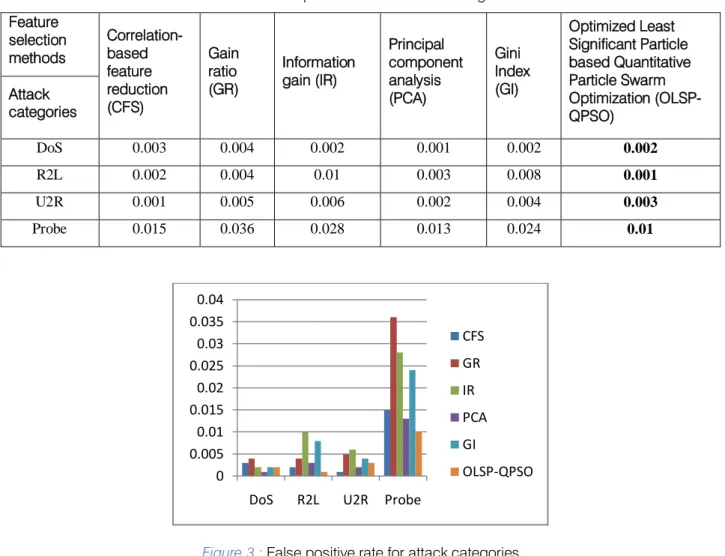
Table 3 :False positive rate for attack categories Feature selection methods Correlation-based feature reduction (CFS) Gain ratio (GR) Information gain (IR) Principal component analysis (PCA) Gini Index (GI) Optimized Least Significant Particle based Quantitative Particle Swarm Optimization (OLSP-QPSO) Attack categories DoS 0.003 0.004 0.002 0.001 0.002 0.002 R2L 0.002 0.004 0.01 0.003 0.008 0.001 U2R 0.001 0.005 0.006 0.002 0.004 0.003 Probe 0.015 0.036 0.028 0.013 0.024 0.01
Figure 3 : False positive rate for attack categories
V.
Conclusion and future work
This paper mainly focuses on the different feature selection techniques used to detect the attacks
in the network. Feature selection techniques will decreased the training time of the network. By training the system by the appropriate feature selection technique will increases the performance of the system.
95 95.5 96 96.5 97 97.5 98 98.5 detection rate 0 0.005 0.01 0.015 0.02 0.025 0.03 0.035 0.04
DoS R2L U2R Probe
CFS GR IR PCA GI OLSP-QPSO
A Comparative Study on Performance Evaluation of Intrusion Detection System through Feature Reduction for High Speed Networks
Global Journal of Computer Science and Technology Volume XIV Issue VII Version I
44 Year 2014 (DDDDDDDD ) E
The detection rate can be increased and the false alarm rate can be decreased. The above results shows that the Optimized Least Significant Particle based Quantitative Particle Swarm Optimization (OLSP-QPSO) techniques has more number of attribute reduction and high detection rate and low false alarm rate when comparing with the remaining feature selection techniques. In the above categories of attacks the detection rate of probe is high when compare to Dos, R2L and U2R. In future, the feature selection techniques are more refined to decrease the false alarm rate of the Probe attack.
References Références Referencias
1. Kendall, K, “A Database of Computer Attacks for the Evaluation of Intrusion Detection Systems”, Master's Thesis, Massachusetts Institute of Technology, 1998.
2. V. Jyothsna, V. V. Rama Prasad, “A Review of Anomaly based Intrusion Detection Systems”, International Journal of Computer Applications (0975 – 8887) Volume 28– No.7, August 2011, pp. 26 – 35.
3. Debar, H., Dacier, M., and Wespi, A., “A Revised taxonomy for intrusion detection systems”, Annales des Telecommunications, Vol. 55, No. 7–8, 361– 378, 2000.
4. Mukkamala, S., Sung, AH,”A Comparative Study of Techniques for Intrusion Detection”, Proceedings of 15th IEEE International Conference on Tools with Artificial Intelligence, IEEE Computer Society Press; (2003) 570-579.
5. P. García-Teodoro , J. Díaz-Verdejo , G. Maciá-Fernández , E. Vázquez , “Anomaly-based network intrusion detection: Techniques, systems and challenges”, Elsevier Computers & Security, Volume 28, Issues 2, March 2009, Pages 18–28.
6. Xin Xu, “Adaptive Intrusion Detection Based on Machine Learning: Feature Extraction, Classifier Construction and Sequential Pattern Prediction”, International Journal of Web Services Practices, Vol.2, No.1-2, 2006, pp. 49-58.
7. Isabelle Guyon, Andre Elisseeff, “An Introduction to Variable and Feature Selection”, Journal of Machine Learning Research, March 2003.
8. H. Sung, S. Mukkamala.,” The Feature Selection and Intrusion Detection Problems”, in Proceedings of the 9th Asian Computing Science Conference, Lecture Notes in Computer Science, Springer 2004. 9. S Zaman, F Karray, “Features selection for intrusion
detection systems based on support vector machines”, CCNC'09 Proceedings of the 6th IEEE Conference on Consumer Communications and Networking Conference 2009.
10. S Chebrolu, A Abraham, J P. Thomas, “Feature deduction and ensemble design of intrusion
detection systems”, Computers & Security, Volume 24, Issue 4, June 2005, Pages 295-307.
11. T. S. Chou, K. K. Yen, and J. Luo “Network Intrusion Detection Design Using Feature Selection of Soft Computing Paradigms”, International Journal of Computational Intelligence, 2008.
12. H Nguyen, K Franke, S Petrovic, “Improving Effectiveness of Intrusion Detection by Correlation Feature Selection”, International Conference on Availability, Reliability and Security, IEEE 2010, Pages-17-24.
13. Mark A. Hall, Correlation-based Feature Selection for Machine Learning, Dept of Computer Science, University of Waikato. http:// www.cs. waikato.ac.nz/ ~mhall/thesis.pdf.
14. Jasmina Novakovic, “Using Information Gain Attribute Evaluation to Classify Sonar Targets“, 17th Telecommunications forum TELFOR 2009 Serbia, Belgrade, November 24-26, 2009.
15. B. Azhagusundari, Antony Selvadoss Thanamani, “Feature Selection based on Information Gain “, International Journal of Innovative Technology and Exploring Engineering (IJITEE) ISSN: 2278-3075, Volume-2, Issue-2, January 2013.
16. R. Puttini, Z. marrakchi, and L. Me, "Bayesian classification model for Real time intrusion detection”, Proc. of 22nd. International workshop on Bayesian inference and maximum entropy methods in science and engineering, 2002.
17. Hesham Altwaijry, Saeed Algarny, “Basesian based intrusion detection system”, Journal of King Saud University – Computer and Information Sciences, 2012, pp. 1–6.
18. Xin Xu, X.N. Wang, “Adaptive network intrusion detection method based on PCA and support vector machines”, Lecture Notes in Artificial Intelligence, ADMA 2005, LNAI 3584, pp. 696 – 703, 2005. 19. Lindsay I Smith, “A tutorial on Principal Components
Analysis”, February 26, 2002.
20. I Ahmad, A B Abdulah, A S Alghamdi, K Alnfajan, M Hussain, “Feature Subset Selection for Network Intrusion Detection Mechanism Using Genetic Eigen Vectors” , Proc .of CSIT vol.5, 2011
21. Jiawei Han, Micheline Kamber, “Data mining: Concepts and Techniques”, Morgan Kauffmann Publishers, 2006.
22. V. Jyothsna, V. V. Rama Prasad, “HFO-ANID: Hierarchical Feature Optimization for Anomaly based Network Intrusion Detection” Third International Conference on Computing Communication & Networking Technologies (ICCCNT), July 2012 Published in IEEE Xplore digital library, pp 1-11.
23. Tavallaee M, Bagheri E, Lu W and Ghorbani AA., “A detailed analysis of the KDD Cup datasets”, in proceedings of IEEE Symposium on computational
Global Journal of Computer Science and Technology Volume XIV Issue VII Version I
45 Year 2014 (DDDDDDDD ) E
intelligence in security and defence applications, 2009.
24. Saman M. Abdulla, Najla B. Al-Dabagh, Omar Zakaria, “Identify Features and Parameters to Devise an Accurate Intrusion Detection System Using Artificial Neural Network”, World Academy of Science, Engineering and Technology 2010.
25. Dr. Saurabh Mukherjeea, Neelam Sharmaa, “Intrusion Detection using Naive Bayes Classifier with Feature Reduction”, Published by Elsevier Procedia Technology,2012, pp. 119 – 128.
26. NSL-KDD dataset for network –based intrusion detection systems” available on http://iscx.info/NSL-KDD/
A Comparative Study on Performance Evaluation of Intrusion Detection System through Feature Reduction for High Speed Networks
Global Journal of Computer Science and Technology Volume XIV Issue VII Version I
46 Year 2014 (DDDDDDDD ) E