Multiclass Cancer Classification by Using Fuzzy Support Vector
Machine and Binary Decision Tree With Gene Selection
(Article begins on next page)
The Harvard community has made this article openly available.
Please share
how this access benefits you. Your story matters.
Citation
Mao, Yong, Xiaobo Zhou, Daoying Pi, Youxian Sun, and
Stephen T. C. Wong. 2005. Multiclass Cancer Classification by
Using Fuzzy Support Vector Machine and Binary Decision Tree
With Gene Selection. Journal of Biomedicine and Biotechnology
2005(2): 160-171.
Published Version
doi://10.1155/JBB.2005.160
Accessed
February 19, 2015 7:35:31 AM EST
Citable Link
http://nrs.harvard.edu/urn-3:HUL.InstRepos:8350336
Terms of Use
This article was downloaded from Harvard University's DASH
repository, and is made available under the terms and conditions
applicable to Other Posted Material, as set forth at
http://nrs.harvard.edu/urn-3:HUL.InstRepos:dash.current.terms-of-use#LAA
©2005 Hindawi Publishing Corporation
RESEARCH ARTICLE
Multiclass Cancer Classification by Using Fuzzy
Support Vector Machine and Binary Decision
Tree With Gene Selection
Yong Mao,1Xiaobo Zhou,2Daoying Pi,1 Youxian Sun,1 and Stephen T. C. Wong2
1National Laboratory of Industrial Control Technology,
Institute of Modern Control Engineering and College of Information Science and Engineering, Zhejiang University, Hangzhou 310027, China
2Harvard Center for Neurodegeneration & Repair and Brigham and Women’s Hospital,
Harvard Medical School, Harvard University, Boston, MA 02115, USA
Received 3 June 2004; revised 2 November 2004; accepted 4 November 2004
We investigate the problems of multiclass cancer classification with gene selection from gene expression data. Two different con-structed multiclass classifiers with gene selection are proposed, which are fuzzy support vector machine (FSVM) with gene selection and binary classification tree based on SVM with gene selection. Using F test and recursive feature elimination based on SVM as gene selection methods, binary classification tree based on SVM with F test, binary classification tree based on SVM with recursive feature elimination based on SVM, and FSVM with recursive feature elimination based on SVM are tested in our experiments. To accelerate computation, preselecting the strongest genes is also used. The proposed techniques are applied to analyze breast cancer data, small round blue-cell tumors, and acute leukemia data. Compared to existing multiclass cancer classifiers and binary classifi-cation tree based on SVM with F test or binary classificlassifi-cation tree based on SVM with recursive feature elimination based on SVM mentioned in this paper, FSVM based on recursive feature elimination based on SVM can find most important genes that affect certain types of cancer with high recognition accuracy.
INTRODUCTION
By comparing gene expressions in normal and dis-eased cells, microarrays are used to identify disdis-eased genes and targets for therapeutic drugs. However, the huge amount of data provided by cDNA microarray measure-ments must be explored in order to answer fundamen-tal questions about gene functions and their interdepen-dence [1], and hopefully to provide answers to questions like what is the type of the disease affecting the cells or which genes have strong influence on this disease. Ques-tions like this lead to the study of gene classification prob-lems.
Many factors may affect the results of the analysis. One of them is the huge number of genes included in the
Correspondence and reprint requests to Stephen T. C. Wong, Harvard Center for Neurodegeneration & Repair and Brigham and Women’s Hospital, Harvard Medical School, Harvard Univer-sity, Boston, MA 02115, USA; stephen [email protected] This is an open access article distributed under the Creative Commons Attribution License which permits unrestricted use, distribution, and reproduction in any medium, provided the original work is properly cited.
original dataset. Key issues that need to be addressed un-der such circumstances are the efficient selection of good predictive gene groups from datasets that are inherently noisy, and the development of new methodologies that can enhance the successful classification of these complex datasets.
For multiclass cancer classification and discovery, the performance of different discrimination methods includ-ing nearest-neighbor classifiers, linear discriminant anal-ysis, classification trees, and bagging and boosting learn-ing methods are compared in [2]. Moreover, this prob-lem has been studied by using partial least squares [3], Bayesian probit regression [4], and iterative classification trees [5]. But multiclass cancer classification, combined with gene selection, has not been investigated intensively. In the process of multiclass classification with gene selec-tion, where there is an operation of classificaselec-tion, there is an operation of gene selection, which is the focus in this paper.
In the past decade, a number of variable (or gene) selection methods used in two-class classification have been proposed, notably, the support vector machine (SVM) method [6], perceptron method [7], mutual-information-based selection method [8], Bayesian vari-able selection [2, 9, 10, 11, 12], minimum description
length principle for model selection [13], voting tech-nique [14], and so on. In [6], gene selection using re-cursive feature elimination based on SVM (SVM-RFE) is proposed. When used in two-class circumstances, it is demonstrated experimentally that the genes selected by these techniques yield better classification perfor-mance and are biologically relevant to cancer than the other methods mentioned in [6], such as feature rank-ing with correlation coefficients or sensitivity analysis. But its application in multiclass gene selection has not been seen for its expensive calculation burden. Thus, gene preselection is adopted to get over this shortcom-ing; SVM-RFE is a key gene selection method used in our study.
As a two-class classification method, SVMs’ remark-able robust performance with respect to sparse and noisy data makes them first choice in a number of applications. Its application in cancer diagnosis using gene profiles is referred to in [15,16]. In the recent years, the binary SVM has been used as a component in many multiclass classi-fication algorithms, such as binary classiclassi-fication tree and fuzzy SVM (FSVM). Certainly, these multiclass classifica-tion methods all have excellent performance, which bene-fit from their root in binary SVM and their own construc-tions. Accordingly, we propose two different constructed multiclass classifiers with gene selection: one is to use bi-nary classification tree based on SVM (BCT-SVM) with gene selection while the other is FSVM with gene selec-tion. In this paper, F test and SVM-RFE are used as our gene selection methods. Three groups of experiments are done, respectively, by using FSVM with SVM-RFE, BCT-SVM with BCT-SVM-RFE, and BCT-BCT-SVM with F test. Com-pared to the methods in [2,3,5], our proposed methods can find out which genes are the most important genes to affect certain types of cancer. In these experiments, with most of the strongest genes selected, the prediction error rate of our algorithms is extremely low, and FSVM with SVM-RFE shows the best performance of all.
The paper is organized as follows. Problem statement is given in “problem statement.” BCT-SVM with gene se-lection is outlined in “binary classification tree based on SVM with gene” selection. FSVM with gene selection is described in “FSVM with gene selection.” Experimental results on breast cancer data, small round blue-cell tu-mors data, and acute leukemia data are reported in “ex-perimental results.” Analysis and discussion are presented in “analysis and discussion.” “Conclusion” concludes the paper.
PROBLEM STATEMENT
Assume there are K classes of cancers. Let w =
[w1, . . . , wm] denote the class labels ofmsamples, where wi = k indicates the sample i being cancer k, where k=1, . . . , K. Assumex1, . . . , xnarengenes. Letxijbe the measurement of the expression level of the jth gene for theith sample, wherej=1,2, . . . , n,X=[xij]m,n, denotes
the expression levels of all genes, that is,
X=
Gene 1 Gene 2 · · · Genen x11 x12 · · · x1n x12 x22 · · · x2n .. . ... . .. ... xm1 xm2 · · · xmn . (1)
In the two proposed methods, every sample is parti-tioned by a series of optimal hyperplanes. The optimal hy-perplane means training data is maximally distant from the hyperplane itself, and the lowest classification error rate will be achieved when using this hyperplane to clas-sify current training set. These hyperplanes can be mod-eled as
ωstXiT+bst=0 (2) and the classification functions are defined as fst(XiT) = ωstXiT +bst, whereXidenotes theith row of matrixX;s andtmean two partitions which are separated by an opti-mal hyperplane, and what these partitions mean lies on the construction of multiclass classification algorithms; for example, if we use binary classification tree,sandt mean two halves separated in an internal node, which may be the root node or a common internal node; if we use FSVM,sandtmean two arbitrary classes inKclasses.ωst is ann-dimensional weight vector;bstis a bias term.
SVM algorithm is used to determinate these optimal hyperplanes. SVM is a learning algorithm originally in-troduced by Vapnik [17,18] and successively extended by many other researchers. SVMs can work in combination with the technique of “kernels” that automatically do a nonlinear mapping to a feature space so that SVM can settle the nonlinear separation problems. In SVM, a con-vex quadratic programming problem is solved and, finally, optimal solutions ofωst andbstare given. Detailed solu-tion procedures are found in [17,18].
Along with each binary classification using SVM, one operation of gene selection is done in advance. Specific gene selection methods used in our paper are described briefly in “experimental results.” Here, gene selection is done before SVM trained means that when an SVM is trained or used for prediction, dimensionality reduction will be done on input data,Xi, referred to as the strongest genes selected. We use functionYi=I(βstXiT) to represent this procedure, whereβstis ann×nmatrix, in which only diagonal elements may be equal to 1 or 0; and all other el-ements are equal to 0; genes corresponding to the nonzero diagonal elements are important.βstis gotten by specific gene selection methods; functionI(·) means to select all nonzero elements in the input vector to construct a new vector , for example,I([1 0 2])T=[1 2T]. So (2) is rewrit-ten as
and the classification functions are rewritten as fst(XiT)=
βstXiT+bstaccordingly.
In order to accelerate calculation rate, preselect-ing genes before the trainpreselect-ing of multiclass classifiers is adopted. Based on all above, we propose two different constructed multiclass classifiers with gene selection: (1) binary classification tree based on SVM with gene selec-tion, and (2) FSVM with gene selection.
BINARY CLASSIFICATION TREE BASED ON SVM WITH GENE SELECTION
Binary classification tree is an important class of machine-learning algorithms for multiclass classification. We construct binary classification tree with SVM; for short, we call it BCT-SVM. In BCT-SVM, there areK−1 internal nodes andKterminal nodes. When building the tree, the solution of (3) is searched by SVM at each in-ternal node to separate the data in the current node into the left children node and right children node with ap-pointed gene selection method, which is mentioned in “experimental results”. Which class or classes should be partitioned into the left (or right) children node is decided at each internal node by impurity reduction [19], which is used to find the optimal construction of the classifier. The partition scheme with largest impurity reduction (IR) is optimal. Here, we use Gini index as our IR measurement criterion, which is also used in classification and regres-sion trees (CARTs) [20] as a measurement of class diver-sity. Denote asMthe training dataset at the current node, asMLandMRthe training datasets at the left and right children nodes, asMisample set of classiin the training set, asMR·iandML·isample sets of classiof the training dataset at the left and right children nodes; and we useλΘ
to denote the number of samples in datasetΘ; the cur-rent IR can be calculated as follows, in whichcmeans the number of classes in the current node:
IR(M)=λ 1 MλML c i=1 λML·i 2 + 1 λMλMR c i=1 λMR·i 2 − 1 λM2 c i=1 λMi 2 . (4)
When the maximum of IR(M) is found out based on all potential combinations of classes in the current internal node, which part of data should be partitioned into the left children node is decided. For the details to construct the standard binary decision tree, we refer to [19,20].
After this problem is solved, samples partitioned into the left children node are labeled with−1, and the oth-ers are labeled with 1, based on these measures, a binary SVM classifier with gene selection is trained using the data of the two current children nodes. As to gene selection, it is necessary because the cancer classification is a typ-ical problem with small sample and large variables, and
it will cause overfitting if we directly train the classifier with all genes; here, all gene selection methods based on two-class classfication could be used to constructβst in (3). The process of building a whole tree is recursive, as seen inFigure 1.
When the training data at a node cannot be split any further, that node is identified as a terminal node and what we get from decision function corresponds to the la-bel for a particular class. Once the tree is built, we could predict the results of the samples with genes selected by this tree; trained SVM will bring them to a terminal node, which has its own label. In the process of building BCT-SVM, there areK−1 operations of gene selection done. This is due to the construction of BCT-SVM, in which there areK−1 SVMs.
FSVM WITH GENE SELECTION
Other than BCT-SVM, FSVM has a pairwise construc-tion, which means every hyperplane between two arbi-trary classes should be searched using SVM with gene se-lection. These processes are modeled by (3).
FSVM is a new method firstly proposed by Abe and Inoue in [21,22]. It was proposed to deal with unclassi-fiable regions when using one versus the rest or pairwise classification method based on binary SVM forn(> 2)-class problems. FSVM is an improved pairwise 2)- classifi-cation method with SVM; a fuzzy membership function is introduced into the decision function based on pair-wise classification. For the data in the classifiable regions, FSVM gives out the same classification results as pair-wise classification with SVM method and for the data in the unclassifiable regions, FSVM generates better classi-fication results than the pairwise classiclassi-fication with SVM method. In the process of being trained, FSVM is the same as the pairwise classification method with SVM that is re-ferred to in [23].
In order to describe our proposed algorithm clearly, we denote four input variables: the sample matrixX0 =
{x1,x2, . . . ,xk, . . . ,xm}T, that is,X0is a matrix composed of some columns of original training datasetX, which cor-responds to preselected important genes; the class-label vectory= {y1, y2, . . . , yk, . . . , ym}T; the number of classes in training setν; and the number of important genes used in gene selectionκ. With these four input variables, the training process of FSVM with gene selection is expressed in (Algorithm 1).
In Algorithm 1, υ = GeneSelection(µ, φ, κ) is real-ization of a specific binary gene selection algorithm, υ denotes the genes important for two specific draw-out classes and is used to constructβstin (3),SV MTrain(·) is realization of binary SVM algorithm,αis a Lagrange mul-tiplier vector, andis a bias term.γ,alpha, andbiasare the output matrixes.γis made up of all important genes selected, in which each row corresponds to a list of im-portant genes selected between two specific classes.alpha is a matrix with each row corresponding to Lagrange
Build tree
Training data for the current node
Single class? Yes Left node (terminal node)
Class label for the left node No
Find a binary classification scheme by maximum impurity
reduction (IR)
Feature (or gene) selection
Find an optimal hyperplane with SVM using features
(or genes) selected
Split the current node
Build left subtree Build right subtree
Figure1. Binary classification tree based on SVM with gene selection.
multiplier vector by an SVM classifier trained between two specific classes, andbiasis the vector made up of bias terms of these SVM classifiers.
In this process, we may see there areK(K−1)/2 SVMs trained and K(K −1)/2 gene selections executed. This means that many important genes relative to two specific classes of samples will be selected.
Based on theK(K−1)/2 optimal hyperplanes and the strongest genes selected, decision function is constructed based on (3). Define fst(Xi)= −fts(Xi),(s=t); the fuzzy membership functionmst(Xi) is introduced on the direc-tions orthogonal to fst(Xi)=0 as mstXi= 1 for fstXi≥1, fstXi otherwise. (5)
Using mst(Xi)(s = t, s = 1, . . . , n), the class i membership function of Xi is defined as ms(Xi) = mint=1,...,nmst(Xi), which is equivalent to ms(Xi) = min(1,mins=t,t=1,...,nfst(Xi)); now an unknown sampleXi is classified byargmaxs=1,...,nms(Xi).
EXPERIMENTAL RESULTS
F test and SVM-RFE are gene selection methods used in our experiments. In F test, the ratio R(j) =
m
i=1(Kk=11Ωi=k)(xk j − xj)2/
m
i=1(Kk=11Ωi=k)(xij −
xk j)2,1 ≤ j ≤ n, is used to select genes, in whichxj denotes the average expression level of gene j across all samples and xk j denotes the average expression level of gene jacross the samples belonging to classkwhere class k corresponds to{Ωi = k}; and the indicator function
1Ω is equal to one if eventΩis true and zero otherwise. Genes with biggerR(j) are selected. From the expression ofR(j) , it can be seen F test could select genes among l(>3) classes [14]. As to SVM-RFE, it is recursive feature elimination based on SVM. It is a circulation procedure for eliminating features combined with training an SVM classifier and, for each elimination operation, it consists of three steps: (1) train the SVM classifier, (2) compute the ranking criteria for all features, and (3) remove the feature with the smallest ranking scores, in which all ranking criteria are relative to the decision function of SVM. As a linear kernel SVM is used as a classifier
Inputs:
Sample matrixX0= {x1,x2, . . . ,xk, . . . ,xm}T, class-label vectory= {y1, y2, . . . , yk, . . . , ym}T,
number of classes in training setν=K, and number of important genes we needκ=z
Initialize:
Setγ,alpha, andbiasas empty matrixes.γwill be used to contain index number of ranked features; alphaandbiaswill be used to contain parameters of FSVM
Training:
fori∈ {1, . . . ,ν−1} forj∈ {i−1, . . . ,ν}
Initializeµas an empty matrix for containing draw-out samples andφas an empty vector for contain-ing new-built class labels of classiand classj
fork∈ {1, . . . , m} ifyk=i or j
AddX0’ykth row toµasµ’s last row
ifyk=i, add element -1 toφasφ’s last element
else, add element 1 toφasφ’s last element end
end
Gene selection
Initializeυas an empty vector for containing important gene index number Get important genes between classiand classj
υ=GeneSelection(µ,φ, κ)
Put the results of gene selection into ranked feature matrix Addυtoγasγ’s last row
Train binary SVM using the row of genes selected right now
Initializeτas an empty matrix for containing training data corresponding to the genes selected; Build the new matrix; Copy every column ofµthatυindicates intoτas its column; Train the classifier
{α} =SVMTrain(τ,φ) AddαTtoalphaasalpha’s last row Addtobiasasbias’s last element end
end
Outputs:
Ranked feature matrixγ
Two parameter matrixes of FSVM,alphaandbias
Algorithm1. The FSVM with gene selection training algorithm.
between two specific classessandt, the square of every element of weight vectorωst in (2) is used as a score to evaluate the contribution of the corresponding genes. The genes with the smallest scores are eliminated. Details are referred to in [6]. To speed up the calculation, gene preselection is generally used. On every dataset we use the first important 200 genes are selected by F test before multiclass classifiers with gene selection are trained. Note
that F test requires normality of the data to be efficient which is not always the case for gene expression data. That is the exact reason why we cannot only use F test to select genes. Since thePvalues of important genes are relatively low, that means the F test scores of important genes should be relatively high. Considering that the number of important genes is often among tens of genes, we preselect the number of genes as 200 according to our
experience in order to avoid losing some important genes. In the next experiments, we will show this procedure works effectively.
Combining these two specific gene selection meth-ods with the multiclass classification methmeth-ods, we pro-pose three algorithms: (1) SVM with F test, (2) BCT-SVM with BCT-SVM-RFE, and (3) FBCT-SVM with BCT-SVM-RFE. As mentioned in [4,9], every algorithm is tested with cross-validation (leave-one-out) method based on top 5, top 10, and top 20 genes selected by their own gene selection methods.
Breast cancer dataset
In our first experiment, we will focus on hereditary breast cancer data, which can be downloaded from the web page for the original paper [24]. In [24], cDNA mi-croarrays are used in conjunction with classification algo-rithms to show the feasibility of using differences in global gene expression profiles to separate BRCA1 and BRCA2 mutation-positive breast cancers. Twenty-two breast tu-mor samples from 21 patients were examined: 7 BRCA1, 8 BRCA2, and 7 sporadic. There are 3226 genes for each tumor sample. We use our methods to classify BRCA1, BRCA2, and sporadic. The ratio data is truncated from below at 0.1 and above at 20.
Table 1lists the top 20 strongest genes selected by us-ing our methods. (For readus-ing purpose, sometimes in-stead of clone ID, we use the gene index number in the database [24].) The clone ID and the gene description of a typical column of the top 20 genes selected by SVM-RFE are listed inTable 2; more information about all se-lected genes corresponding to the list inTable 1could be found at http://www.sensornet.cn/fxia/top 20 genes.zip. It is seen that gene 1008 (keratin 8) is selected by all the three methods. This gene is also an important gene listed in [4,7,9]. Keratin 8 is a member of the cytokeratin fam-ily of genes. Cytokeratins are frequently used to identify breast cancer metastases by immunohistochemistry [24]. Gene 10 (phosphofructokinase, platelet) and gene 336 (transducer of ERBB2, 1) are also important genes listed in [7]. Gene 336 is selected by FSVM with SVM-RFE and BCT-SVM with SVM-RFE; gene 10 is selected by FSVM with SVM-RFE.
Using the top 5, 10, and 20 genes each for these three methods, the recognition accuracy is shown inTable 3. When using top 5 genes for classification, there is one er-ror for BCT-SVM with F test and no erer-ror for the other two methods. When using top 10 and 20 genes, there is no error for all the three methods. Note that the perfor-mance of our methods is similar to that in [4], where the authors diagnosed the tumor types by using multinomial probit regression model with Bayesian gene selection. Us-ing top 10 genes, they also got zero misclassification.
Small round blue-cell tumors
In this experiment, we consider the small round blue-cell tumors (SRBCTs) of childhood, which include
neuroblastoma (NB), rhabdomyosarcoma (RMS), non-Hodgkin lymphoma (NHL), and the Ewing sarcoma (EWS) in [25]. The dataset of the four cancers is com-posed of 2308 genes and 63 samples, where the NB has 12 samples; the RMS has 23 samples; the NHL has 8 sam-ples, and the EMS has 20 samples. We use our methods to classify the four cancers. The ratio data is truncated from below at 0.01.
Table 4lists the top 20 strongest genes selected by us-ing our methods. The clone ID and the gene description of a typical column of the top 20 genes selected by SVM-RFE are listed inTable 5; more information about all se-lected genes corresponding to the list inTable 4could be found at http://www.sensornet.cn/fxia/top 20 genes.zip. It is seen that gene 244 (clone ID 377461), gene 2050 (clone ID 295985), and gene 1389 (clone ID 770394) are selected by all the three methods, and these genes are also important genes listed in [25]. Gene 255 (clone ID 325182), gene 107 (clone ID 365826), and gene 1 (clone ID 21652, (catenin alpha 1)) selected by BCT-SVM with SVM-RFE and FSVM with SVM-RFE are also listed in [25] as important genes.
Using the top 5, 10, and 20 genes for these three meth-ods each, the recognition accuracy is shown inTable 6. When using top 5 genes for classification, there is one er-ror for BCT-SVM with F test and no erer-ror for the other two methods. When using top 10 and 20 genes, there is no error for all the three methods.
In [26], Yeo et al appliedknearest neighbor (kNN), weighted voting, and linear SVM in one-versus-rest fashion to this four-class problem and compared the per-formances of these methods when they are combined with several feature selection methods for each binary classification problem. Using top 5 genes, top 10 genes, or top 20 genes, kNN, weighted voting, or SVM com-bined with all the three feature selection methods, re-spectively, without rejection all have errors greater than or equal to 2. In [27], Lee et al used multicategory SVM with gene selection. Using top 20 genes, their recognition accuracy is also zero misclassification num-ber.
Acute leukemia data
We have also applied the proposed methods to the leukemia data of [14], which is available at http://www. sensornet.cn/fxia/top 20 genes.zip. The microarray data contains 7129 human genes, sampled from 72 cases of cancer, of which 38 are of type B cell ALL, 9 are of type T cell ALL, and 25 of type AML. The data is preprocessed as recommended in [2]: gene values are truncated from be-low at 100 and from above at 16 000; genes having the ra-tio of the maximum over the minimum less than 5 or the difference between the maximum and the minimum less than 500 are excluded; and finally the base-10 logarithm is applied to the 3571 remaining genes. Here we study the 38 samples in training set, which is composed of 19 B-cell ALL, 8 T-cell ALL, and 11 AML.
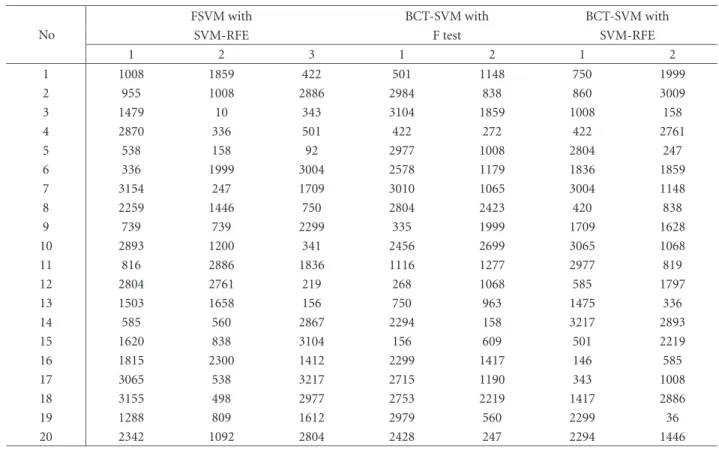
Table1. The index no of the strongest genes selected in hereditary breast cancer dataset.
No
FSVM with BCT-SVM with BCT-SVM with
SVM-RFE F test SVM-RFE
1 2 3 1 2 1 2 1 1008 1859 422 501 1148 750 1999 2 955 1008 2886 2984 838 860 3009 3 1479 10 343 3104 1859 1008 158 4 2870 336 501 422 272 422 2761 5 538 158 92 2977 1008 2804 247 6 336 1999 3004 2578 1179 1836 1859 7 3154 247 1709 3010 1065 3004 1148 8 2259 1446 750 2804 2423 420 838 9 739 739 2299 335 1999 1709 1628 10 2893 1200 341 2456 2699 3065 1068 11 816 2886 1836 1116 1277 2977 819 12 2804 2761 219 268 1068 585 1797 13 1503 1658 156 750 963 1475 336 14 585 560 2867 2294 158 3217 2893 15 1620 838 3104 156 609 501 2219 16 1815 2300 1412 2299 1417 146 585 17 3065 538 3217 2715 1190 343 1008 18 3155 498 2977 2753 2219 1417 2886 19 1288 809 1612 2979 560 2299 36 20 2342 1092 2804 2428 247 2294 1446
Table2. A part of the strongest genes selected in hereditary breast cancer dataset (the first row of genes inTable 1).
Rank Index no Clone ID Gene description
1 1008 897781 Keratin 8
2 955 950682 Phosphofructokinase, platelet
3 1479 841641 Cyclin D1 (PRAD1: parathyroid adenomatosis 1)
4 2870 82991 Phosphodiesterase I/nucleotide pyrophosphatase 1(homologous to mouse Ly-41 antigen)
5 538 563598 Human GABA-A receptorπsubunit mRNA, complete cds
6 336 823940 Transducer of ERBB2, 1
7 3154 135118 GATA-binding protein 3
8 2259 814270 Polymyositis/scleroderma autoantigen 1 (75kd)
9 739 214068 GATA-binding protein 3
10 2893 32790 mutS (E coli) homolog 2 (colon cancer, nonpolyposis type 1)
11 816 123926 Cathepsin K (pycnodysostosis)
12 2804 51209 Protein phosphatase 1, catalytic subunit, beta isoform
13 1503 838568 Cytochrome c oxidase subunit VIc
14 585 293104 Phytanoyl-CoA hydroxylase (Refsum disease)
15 1620 137638 ESTs
16 1815 141959 Homo sapiens(from clone DKFZp566J2446)mRNA; cDNA DKFZp566J2446
17 3065 199381 ESTs
18 3155 136769 TATA box binding protein (TBP)-associated factor,RNA polymerase II, A, 250kd
19 1288 564803 Forkhead (drosophila)-like 16
Table3. Classifiers’ performance on hereditary breast cancer dataset by cross-validation (number of wrong classified samples in leave-one-out test).
Classification method Top 5 Top 10 Top 20
FSVM with SVM-RFE 0 0 0
BCT-SVM with F test 1 0 0
BCT-SVM with SVM-RFE 0 0 0
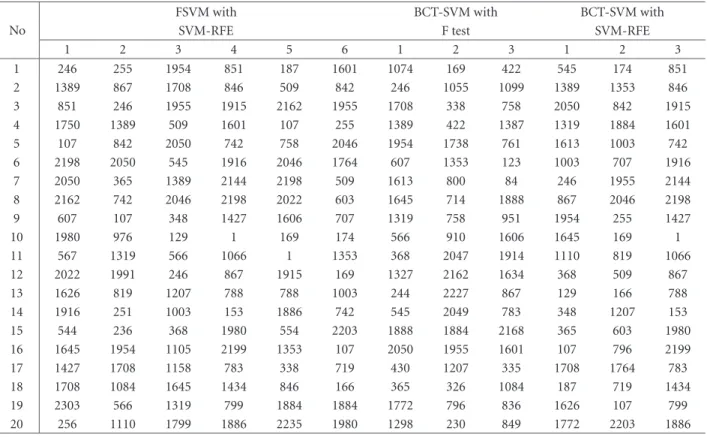
Table4. The index no of the strongest genes selected in small round blue-cell tumors dataset.
No
FSVM with BCT-SVM with BCT-SVM with
SVM-RFE F test SVM-RFE
1 2 3 4 5 6 1 2 3 1 2 3 1 246 255 1954 851 187 1601 1074 169 422 545 174 851 2 1389 867 1708 846 509 842 246 1055 1099 1389 1353 846 3 851 246 1955 1915 2162 1955 1708 338 758 2050 842 1915 4 1750 1389 509 1601 107 255 1389 422 1387 1319 1884 1601 5 107 842 2050 742 758 2046 1954 1738 761 1613 1003 742 6 2198 2050 545 1916 2046 1764 607 1353 123 1003 707 1916 7 2050 365 1389 2144 2198 509 1613 800 84 246 1955 2144 8 2162 742 2046 2198 2022 603 1645 714 1888 867 2046 2198 9 607 107 348 1427 1606 707 1319 758 951 1954 255 1427 10 1980 976 129 1 169 174 566 910 1606 1645 169 1 11 567 1319 566 1066 1 1353 368 2047 1914 1110 819 1066 12 2022 1991 246 867 1915 169 1327 2162 1634 368 509 867 13 1626 819 1207 788 788 1003 244 2227 867 129 166 788 14 1916 251 1003 153 1886 742 545 2049 783 348 1207 153 15 544 236 368 1980 554 2203 1888 1884 2168 365 603 1980 16 1645 1954 1105 2199 1353 107 2050 1955 1601 107 796 2199 17 1427 1708 1158 783 338 719 430 1207 335 1708 1764 783 18 1708 1084 1645 1434 846 166 365 326 1084 187 719 1434 19 2303 566 1319 799 1884 1884 1772 796 836 1626 107 799 20 256 1110 1799 1886 2235 1980 1298 230 849 1772 2203 1886
Table 7lists the top 20 strongest genes selected by us-ing our methods. The clone ID and the gene description of a typical column of the top 20 genes selected by SVM-RFE are listed inTable 8; more information about all se-lected genes corresponding to the list inTable 7could be found at http://www.sensornet.cn/fxia/top 20 genes.zip. It is seen that gene 1882 (CST3 cystatin C (amyloid an-giopathy and cerebral hemorrhage)), gene 4847 (zyxin), and gene 4342 (TCF7 transcription factor 7 (T cell spe-cific)) are selected by all the three methods. In the three genes, the first two are the most important genes listed in many literatures. Gene 2288 (DF D component of com-plement (adipsin)) is another important gene having bio-logical significance, which is selected by FSVM with SVM-RFE.
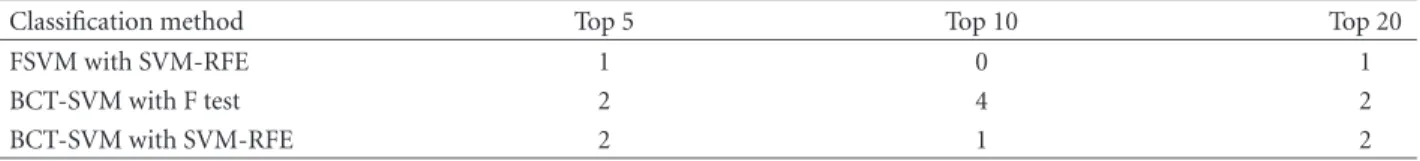
Using the top 5, 10, and 20 genes for these three meth-ods each, the recognition accuracy is shown inTable 9. When using top 5 genes for classification, there is one er-ror for FSVM with SVM-RFE, two erer-rors for BCT-SVM
with SVM-RFE and BCT-SVM with F test, respectively. When using top 10 genes for classification, there is no er-ror for FSVM with SVM-RFE, two erer-rors for BCT-SVM with SVM-RFE and four errors for BCT-SVM with F test. When using top 20 genes for classification, there is one er-ror for FSVM with SVM-RFE, two erer-rors for BCT-SVM with SVM-RFE and two errors for BCT-SVM with F test. Again note that the performance of our methods is simi-lar to that in [4], where the authors diagnosed the tumor types by using multinomial probit regression model with Bayesian gene selection. Using top 10 genes, they also got zero misclassification.
ANALYSIS AND DISCUSSION
According to Tables1–9, there are many important genes selected by these three multiclass classification algo-rithms with gene selection. Based on these selected genes, the prediction error rate of these three algorithms is low.
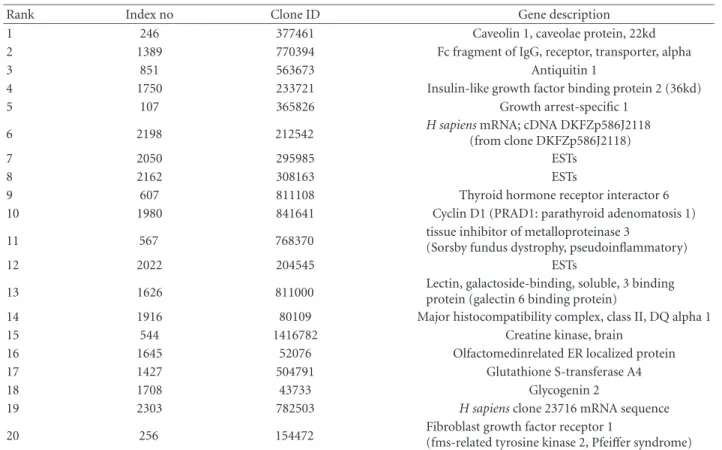
Table5. A part of the strongest genes selected in small round blue-cell tumors dataset (the first row of genes inTable 4).
Rank Index no Clone ID Gene description
1 246 377461 Caveolin 1, caveolae protein, 22kd
2 1389 770394 Fc fragment of IgG, receptor, transporter, alpha
3 851 563673 Antiquitin 1
4 1750 233721 Insulin-like growth factor binding protein 2 (36kd)
5 107 365826 Growth arrest-specific 1
6 2198 212542 H sapiens(from clone DKFZp586J2118)mRNA; cDNA DKFZp586J2118
7 2050 295985 ESTs
8 2162 308163 ESTs
9 607 811108 Thyroid hormone receptor interactor 6
10 1980 841641 Cyclin D1 (PRAD1: parathyroid adenomatosis 1)
11 567 768370 tissue inhibitor of metalloproteinase 3(Sorsby fundus dystrophy, pseudoinflammatory)
12 2022 204545 ESTs
13 1626 811000 Lectin, galactoside-binding, soluble, 3 bindingprotein (galectin 6 binding protein)
14 1916 80109 Major histocompatibility complex, class II, DQ alpha 1
15 544 1416782 Creatine kinase, brain
16 1645 52076 Olfactomedinrelated ER localized protein
17 1427 504791 Glutathione S-transferase A4
18 1708 43733 Glycogenin 2
19 2303 782503 H sapiensclone 23716 mRNA sequence
20 256 154472 Fibroblast growth factor receptor 1(fms-related tyrosine kinase 2, Pfeiffer syndrome)
Table6. Classifiers’ performance on small round blue-cell tumors dataset by cross-validation (number of wrong classified samples in leave-one-out test).
Classification method Top 5 Top 10 Top 20
FSVM with SVM-RFE 0 0 0
BCT-SVM with F test 1 0 0
BCT-SVM with SVM-RFE 0 0 0
By comparing the results of these three algorithms, we consider that FSVM with SVM-RFE algorithm generates the best results. BCT-SVM with SVM-RFE and BCT-SVM with F test have the same multiclass classification struc-ture. The results of BCT-SVM with SVM-RFE are better than those of BCT-SVM with F test, because their gene selection methods are different; a better gene selection method combined with the same multiclass classification method will perform better. It means SVM-RFE is better than F test combined with multiclass classification meth-ods; the results are similar to what is mentioned in [6], in which the two gene selection methods are combined with two-class classification methods.
FSVM with RFE and BCT-SVM with SVM-RFE have the same gene selection methods. The results of FSVM with SVM-RFE are better than those of BCT-SVM with BCT-SVM-RFE whether in gene selection or in recognition accuracy, because the constructions of their multiclass classification methods are different, which is
explained in two aspects. (1) The genes selected by FSVM with SVM-RFE are more than those of BCT-SVM with SVM-REF. In FSVM there areK(K−1)/2 operations of gene selection, but in BCT-SVM there are only K −1 operations of gene selection. An operation of gene se-lection between every two classes is done in FSVM with SVM-RFE; (2) FSVM is an improved pairwise classifica-tion method, in which the unclassifiable regions being in BCT-SVM are classified by FSVM’s fuzzy membership function [21,22]. So, FSVM with SVM-RFE is considered as the best of the three.
CONCLUSION
In this paper, we have studied the problem of mul-ticlass cancer classification with gene selection from gene expression data. We proposed two different new constructed classifiers with gene selection, which are FSVM with gene selection and BCT-SVM with gene
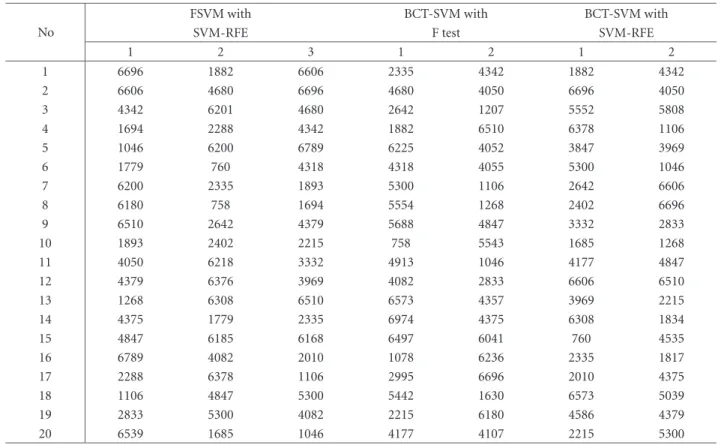
Table7. The index no of the strongest genes selected in acute leukemia dataset.
No
FSVM with BCT-SVM with BCT-SVM with
SVM-RFE F test SVM-RFE
1 2 3 1 2 1 2 1 6696 1882 6606 2335 4342 1882 4342 2 6606 4680 6696 4680 4050 6696 4050 3 4342 6201 4680 2642 1207 5552 5808 4 1694 2288 4342 1882 6510 6378 1106 5 1046 6200 6789 6225 4052 3847 3969 6 1779 760 4318 4318 4055 5300 1046 7 6200 2335 1893 5300 1106 2642 6606 8 6180 758 1694 5554 1268 2402 6696 9 6510 2642 4379 5688 4847 3332 2833 10 1893 2402 2215 758 5543 1685 1268 11 4050 6218 3332 4913 1046 4177 4847 12 4379 6376 3969 4082 2833 6606 6510 13 1268 6308 6510 6573 4357 3969 2215 14 4375 1779 2335 6974 4375 6308 1834 15 4847 6185 6168 6497 6041 760 4535 16 6789 4082 2010 1078 6236 2335 1817 17 2288 6378 1106 2995 6696 2010 4375 18 1106 4847 5300 5442 1630 6573 5039 19 2833 5300 4082 2215 6180 4586 4379 20 6539 1685 1046 4177 4107 2215 5300
Table8. A part of the strongest genes selected in small round blue-cell tumors dataset (the second row of genes inTable 4).
Rank Index no Gene accession number Gene description
1 1882 M27891 at CST3 cystatin C (amyloid angiopathy and cerebral hemorrhage) 2 4680 X82240 rna1 at TCL1 gene (T-cell leukemia) extracted frommRNA for T-cell leukemia/lymphoma 1 H sapiens
3 6201 Y00787 s at Interleukin-8 precursor
4 2288 M84526 at DF D component of complement (adipsin)
5 6200 M28130 rna1 s at Interleukin-8 (IL-8) gene
6 760 D88422 at Cystatin A
7 2335 M89957 at IGB immunoglobulin-associated beta (B29)
8 758 D88270 at GB DEF=(lambda) DNA for immunoglobin light chain
9 2642 U05259 rna1 at MEF2C MADS box transcription enhancer factor 2,polypeptide C (myocyte enhancer factor 2C)
10 2402 M96326 rna1 at Azurocidin gene
11 6218 M27783 s at ELA2 Elastatse 2, neutrophil
12 6376 M83652 s at PFC properdin P factor, complement
13 6308 M57731 s at GRO2 GRO2 oncogene
14 1779 M19507 at MPO myeloperoxidase
15 6185 X64072 s at SELL leukocyte adhesion protein beta subunit
16 4082 X05908 at ANX1 annexin I (lipocortin I)
17 6378 M83667 rna1 s at NF-IL6-beta protein mRNA
18 4847 X95735 at Zyxin
19 5300 L08895 at MEF2C MADS box transcription enhancer factor 2,polypeptide C (myocyte enhancer factor 2C)
Table9. Classifiers’ performance on acute leukemia dataset by cross-validation (number of wrong classified samples in leave-one-out test).
Classification method Top 5 Top 10 Top 20
FSVM with SVM-RFE 1 0 1
BCT-SVM with F test 2 4 2
BCT-SVM with SVM-RFE 2 1 2
selection. F test and SVM-RFE are used as our gene se-lection methods combined with multiclass classification methods. In our experiments, three algorithms (FSVM with SVM-RFE, SVM with SVM-RFE, and BCT-SVM with F test) are tested on three datasets (the real breast cancer data, the small round blue-cell tumors, and the acute leukemia data). The results of these three groups of experiments show that more important genes are lected by FSVM with SVM-RFE, and by these genes se-lected it shows higher prediction accuracy than the other two algorithms. Compared to some existing multiclass cancer classifiers with gene selection, FSVM based on SVM-RFE also performs very well. Finally, an explanation is provided on the experimental results of this study.
ACKNOWLEDGMENT
This work is supported by China 973 Program under Grant no 2002CB312200 and Center of Bioinformatics Program grant of Harvard Center of Neurodegeneration and Repair, Harvard University, Boston, USA.
REFERENCES
[1] Zhou X, Wang X, Pal R, Ivanov I, Bittner M, Dougherty ER. A Bayesian connectivity-based ap-proach to constructing probabilistic gene regulatory networks.Bioinformatics.2004;20(17):2918–2927. [2] Dudoit S, Fridlyand J, Speed TP. Comparison of
dis-crimination methods for the classification of tumors using gene expression data.Journal of the American
Statistical Association.2002;97(457):77–87.
[3] Nguyen DV, Rocke DM. Multi-class cancer classifi-cation via partial least squares with gene expression profiles.Bioinformatics.2002;18(9):1216–1226. [4] Zhou X, Wang X, Dougherty ER. Multi-class
can-cer classification using multinomial probit regres-sion with Bayesian variable selection.IEE Proc of
Sys-tem Biology. In press.
[5] Zhang HP, Yu CY, Singer B, Xiong M. Recursive partitioning for tumor classification with gene ex-pression microarray data. Proc Natl Acad Sci USA.
2001;98(12):6730–6735.
[6] Guyon I, Weston J, Barnhill S, Vapnik V. Gene se-lection for cancer classification using support vec-tor machines.Machine Learning.2002;46(1–3):389– 422.
[7] Kim S, Dougherty ER, Barrera J, Chen Y, Bittner ML, Trent JM. Strong feature sets from small samples.J
Comput Biol.2002;9(1):127–146.
[8] Zhou X, Wang X, Dougherty ER. Nonlinear-probit gene classification using mutual-information and wavelet based feature selection. Biological Systems.
2004;12(3):371–386.
[9] Lee KE, Sha N, Dougherty ER, Vannucci M, Mallick BK. Gene selection: a Bayesian variable selection ap-proach.Bioinformatics.2003;19(1):90–97.
[10] Zhou X, Wang X, Dougherty ER. Gene selection us-ing logistic regression based on AIC, BIC and MDL criteria.New Mathematics and Natural Computation.
2005;1(1):129–145.
[11] Zhou X, Wang X, Dougherty ER. A Bayesian ap-proach to nonlinear probit gene selection and classi-fication.Franklin Institute.2004;341(1-2):137–156. [12] Zhou X, Wang X, Dougherty ER. Missing-value
estimation using linear and non-linear regres-sion with Bayesian gene selection. Bioinformatics.
2003;19(17):2302–2307.
[13] Jornsten R, Yu B. Simultaneous gene clustering and subset selection for sample classification via MDL.
Bioinformatics.2003;19(9):1100–1109.
[14] Golub TR, Slonim DK, Tamayo P, et al. Molecu-lar classification of cancer: class discovery and class prediction by gene expression monitoring. Science.
1999;286(5439):531–537.
[15] Furey TS, Cristianini N, Duffy N, Bednarski DW, Schummer M, Haussler D. Support vector machine classification and validation of cancer tissue sam-ples using microarray expression data. Bioinformat-ics.2000;16(10):906–914.
[16] Mukherjee S, Tamayo P, Mesirov JP, Slonim D, Verri A, Poggio T. Support Vector Machine Classifica-tion of Microarray Data. Cambridge, Mass: Mas-sachusetts Institute of Technology; 1999. CBCL Pa-per 182/AI Memo 1676.
[17] Vapnik VN.Statistical Learning Theory. New York, NY: John Wiley & Sons; 1998.
[18] Vapnik VN.The Nature of Statistical Learning The-ory.2nd ed. New York, NY: Springer; 2000.
[19] Duda RO, Hart PE, Stork DG.Pattern Classification.
2nd ed. New York, NY: John Wiley & Sons; 2001. [20] Breiman L, Friedman JH, Olshen RA, Stone
CJ. Classification and Regression Trees. Belmont,
[21] Abe S, Inoue T. Fuzzy support vector machines for multiclass problems. In:European Symposium on
Ar-tificial Neural Networks Bruges.Belgium; 2002:113–
118.
[22] Inoue T, Abe S. Fuzzy support vector machines for pattern classification. In:Proceeding of International
Joint Conference on Neural Networks. Washington
DC; 2001:1449–1454.
[23] Kreßel UH-G. Pairwise classification and support vector machines. In: Sch¨olkopf B, Burges CJC, Smola AJ, eds.Advances in Kernel Methods—Support Vector
Learning. Cambridge, Mass:MIT Press; 1999:255–
268.
[24] Hedenfalk I, Duggan D, Chen Y, et al. Gene-expression profiles in hereditary breast cancer. N
Engl J Med.2001;344(8):539–548.
[25] Khan J, Wei JS, Ringner M, et al. Classification and diagnostic prediction of cancers using gene expres-sion profiling and artificial neural networks. Nat Med.2001;7(6):673–679.
[26] Yeo G, Poggio T.Multiclass Classification of SRBCTs. Cambridge, Mass: Massachusetts Institute of Tech-nology; 2001. CBLC Paper 206/AI Memo 2001-018. [27] Lee Y, Lin Y, Wahba G. Multicategory support
vec-tor machines: theory and application to the classifi-cation of microarray data and satellite radiance data.
American Statistical Association. 2004;99(465):67–