ScholarWorks @ Georgia State University
ScholarWorks @ Georgia State University
Computer Science Dissertations Department of Computer Science
Summer 8-11-2020
Deep Functional Mapping For Predicting Cancer Outcome
Deep Functional Mapping For Predicting Cancer Outcome
A.K.M. Kamrul Islam
Follow this and additional works at: https://scholarworks.gsu.edu/cs_diss
Recommended Citation Recommended Citation
Islam, A.K.M. Kamrul, "Deep Functional Mapping For Predicting Cancer Outcome." Dissertation, Georgia State University, 2020.
https://scholarworks.gsu.edu/cs_diss/160
This Dissertation is brought to you for free and open access by the Department of Computer Science at
ScholarWorks @ Georgia State University. It has been accepted for inclusion in Computer Science Dissertations by an authorized administrator of ScholarWorks @ Georgia State University. For more information, please contact [email protected].
by
A.K.M. KAMRUL ISLAM
Under the Direction of Saeid Belkasim, PhD
ABSTRACT
The effective understanding of the biological behavior and prognosis of cancer subtypes is becoming very important in-patient administration. Cancer is a diverse disorder in which a significant medical progression and diagnosis for each subtype can be observed and characterized. Computer-aided diagnosis for early detection and diagnosis of many kinds of diseases has evolved in the last decade. In this research, we address challenges associated with multi-organ disease diagnosis and recommend numerous models for enhanced analysis. We concentrate on evaluating the Magnetic Resonance Imaging (MRI), Computed Tomography (CT), and Positron Emission Tomography (PET) for brain, lung, and breast scans to detect, segment, and classify types of cancer from biomedical images. Moreover, histopathological, and genomic classification of cancer prognosis has been considered for multi-organ disease diagnosis and biomarker recommendation.
implementing deep learning technique based on Convolutional Neural Network and Generative Adversarial Network.
In our proposed research we plan to demonstrate ways to increase the performance of the disease diagnosis by focusing on a combined diagnosis of histology, image processing, and genomics. It has been observed that the combination of medical imaging and gene expression can effectively handle the cancer detection situation with higher diagnostic rate rather than considering the individual disease diagnosis. This research puts forward a blockchain-based system that facilitates interpretations and enhancements pertaining to automated biomedical systems. In this scheme, a secured sharing of the biomedical images and gene expression has been established. To maintain the secured sharing of the biomedical contents in a distributed system or among the hospitals, a blockchain based algorithm is considered that generate a secure sequence to identity a hash key. This adaptive feature enables the algorithm to use multiple data types and combines various biomedical images and text records. All data related to patients, including identity, pathological records are encrypted using a private key cryptography based on blockchain architecture to maintain data privacy and secured sharing of the biomedical contents.
INDEX WORDS: Medical Imaging, Machine Learning, Deep Learning, CT Scans, Histology Image, Microarray Gene Expression, Convolutional Neural Network, Generative Adversarial Networks, Computer-aided-diagnosis, Blockchain. .
by
A.K.M. KAMRUL ISLAM
A Dissertation Submitted in Partial Fulfillment of the Requirements for the Degree of Doctor of Philosophy
in the College of Arts and Sciences Georgia State University
Copyright by A.K.M. Kamrul Islam
by
A.K.M. KAMRUL ISLAM
Committee Chair: Saeid Belkasim
Committee: Yanqing Zhang Pavel Skums Marina Arav
Electronic Version Approved:
Office of Graduate Services College of Arts and Sciences Georgia State University August 2020
DEDICATION
To my beloved brother Ifte Rubel who passed away during my PhD study and whom I like more than my life.
ACKNOWLEDGEMENTS
Writing acknowledgements to all who have contributed to this work is practically impossible. But I would like to explicitly thank a few of the people who helped me along the way. First and foremost, my appreciation and heartfelt gratitude to my thesis supervisor and mentor, Dr. Saeid Belkasim, Georgia State University, for his constant endeavour, step by step guidance and the time he devoted for this research work.
I would also like to express my deepest gratitude to the Computer Science department for their funding of this project in Georgia State University, as without this it is unlikely that a successful progress of this project would have been achieved. In addition, I would like to thank Prof. Yanqing Zhang, Dr. Pavel Skums and Dr. Marina Arav for their continuous guidance and help throughout.
I am very thankful to the Dean, Faculty of Arts & Sciences, for the facilities and the work environment provided to me. These facilities enable me to enrich my knowledge and carry out my research. Many thanks go to all the staff at Georgia State University, my friends and colleagues who have helped me with this research project.
In addition, I am indebted to my dearest parents for their endless love.
A.K.M. Kamrul Islam August 2020
TABLE OF CONTENTS
ACKNOWLEDGEMENTS ... V LIST OF TABLES ... XII LIST OF FIGURES ... XIV LIST OF ABBREVIATIONS ... XVI
1 INTRODUCTION ... 1
Background and Motivations ... 1
Aims ... 3
Objectives ... 4
Challenges ... 5
Contribution ... 5
Outline of the Whole Report ... 6
2 RELETED WORK ... 8
Biomedical Imaging ... 8
Biomedical Image Modalities ... 9
Magnetic Resonance Image (MRI) ... 10
Computed Tomography (CT) ... 10
Histological Images ... 10
Medical Image Classification ... 11
Gene Expression Profiling ... 14
Learning Algorithms ... 15
Artificial Neural Network ... 15
Machine Learning ... 17
Deep Learning ... 17
Convolutional Neural Network ... 18
Performance Evaluation Metrics ... 20
Blockchain ... 21
3 LUNG CANCER DETECTION AND CLASSIFICATION IN CT IMAGERY USING HYDRA-NET WITH FEATURE FUSION ... 24
Introduction ... 24 Datasets ... 25 Methodology ... 27 Pre-processing ... 27 Lung Segmentation ... 27 Z-Score Nomrmalization ... 27 Nodule Detection ... 28
Convolutinal Autoencoder Approach ... 29
Autoencoder ... 30
Flattening ... 31
3D DenseNet Approach ... 31
Hydra Net Approach ... 32
Experimental Results ... 33
Summary ... 36
4 MICROSCOPIC IMAGE CLASSIFICATION USING ENSEMBLE OF DEEP CONVOLUTIONAL NEURAL NETWORK ... 37
Introduction ... 37
Methodology ... 38
The Proposed Ensemble Model ... 41
Datasets ... 42
Data Augmentation ... 44
Results and Experiments ... 45
Summary ... 48
5 MULTI-ORGAN IMAGE SEGMENTATION BASED ON DEFORMABLE CASCADED W-NET ... 50
Introduction ... 50
Problem Statement ... 51
Methodology ... 52
Retinal Blood Vessel Dataset ... 55
Skin Cancer Dataset ... 55
Lung Cancer Dataset ... 55
Results and Experiments ... 56
Retinal Blood Vessel Segmentaiton Results ... 57
Skin Cancer Lesion Segmentation Results ... 58
Lung Cancer Segmentation Results ... 59
Summary ... 61
6 ENSEMBLE METHOD FOR PREDICTION OF CANCER METASTASIS USING MICROARRY GENE EXPRESSION DATA THROUGH MACHINE LEARNING ... 62 Introduction ... 62 Problem Statement ... 66 6.3 Methodology ... 67 6.3.1 Dataset ... 67 6.3.2 Proposed Method ... 69 6.4 Experimental Results ... 70 6.5 Summary ... 82
7 INTEGRATIVE ANALYSIS OF HISTOLOGY, IMAGING, AND GENOMICS FOR PREDICTING CANCER OUTCOME ... 83
Introduction ... 83
Methodology ... 84
Datasets ... 87
Results and Experiments ... 87
Summary ... 89
8 INTERNET OF MEDICAL THINGS (IOMT) BASED BLOCKCHAIN FRAMEWORK FOR ELECTRONIC HEALTH RECORD MANAGEMENT ... 90
Background and Motivations ... 92
Problem Statement ... 94
Challenges ... 95
Methodology ... 97
Summary ... 101
9 CONCLUSION AND FUTURE WORK ... 102
Synopsis of the Research ... 102
Future Work ... 104
Analysis of the Proposed Classification and Segmentation Model for Disease Diagnosis ... 105
Association of Radio-Genomics, Histo-Genomics, and Biomolecular-Genome Analysis ... 105
LIST OF TABLES
Table 3.1 Hardware and Software Description ... 34
Table 3.2 Model Comparison ... 35
Table 3.3 Comparison with the State-of-the-art Method ... 35
Table 4.1 Number of Patients with Magnification Factor for BreaKHis dataset. ... 43
Table 4.2 Hardware and Software Description ... 45
Table 4.3 CNN Model Configuration ... 45
Table 4.4 Comparative Study of Different CNN Model Breast Cancer ... 46
Table 4.5 Comparative Study of Different CNN Model for Cervical Cancer ... 47
Table 4.6 Accuracy Comparison of Breast Cancer ... 47
Table 4.7 Accuracy Comparison of Cervical Cancer ... 48
Table 5.1 Hardware and Software Description ... 56
Table 5.2 Blood Vessel Segmentation Model Comparison ... 58
Table 5.3 Skin Cancer Segmentation Model Comparison ... 59
Table 5.4 Lung Cancer Segmentation Model Comparison ... 61
Table 6.1 Microarray Colorectal Cancer Dataset with 16385 Features and Limited Samples ... 68
Table 6.2 Microarray Dataset with Instances and Classes ... 69
Table 6.3 Confusion Matrix ... 71
Table 6.4 Machine Learning Models with Dimensionality Reduction for Colorectal Cancer ... 72
Table 6.5 Machine Learning Models with Dimensionality Reduction for Breast Cancer... 76
Table 6.6 Number of Selected Genes using Feature Selection ... 77
Table 6.7 Machine Learning Models with Feature Selection for Colorectal Cancer ... 77
Table 6.9 Machine Learning Models with Feature Selection for Breast Cancer ... 79
Table 6.10 MLP with Number of Layers for Breast Cancer ... 80
Table 6.11 Clustering Methods for all Genes with Accuracy Measurement ... 80
Table 6.12 Ensemble Method Accuracy Comparison ... 80
Table 6.13 Ensemble Method Accuracy Comparison with Other Models ... 81
Table 7.1 Hardware and Software Description ... 87
Table 7.2 Accuracy Comparison of the Metagenes based on CT Scan Features ... 88
LIST OF FIGURES
Figure 2.1 Image Pixels, Voxels, and Resolution ... 8
Figure 2.2 Brain MRI Image of NSCLC database ... 10
Figure 2.3 NSCLC Scan Dataset ... 11
Figure 2.4 Breast Histology Image of BreKHis Dataset... 11
Figure 2.5 Supervised Classification ... 12
Figure 2.6 The Region of Interest (Lung Cancer) in a CT image ... 14
Figure 2.7 W-net for Image Segmentation ... 14
Figure 2.8 Single Layer Neuron... 16
Figure 2.9 CNN with Convolution Layers.. ... 20
Figure 2.10 Healthcare Related Blockchain Project ... 23
Figure 3.1 Kaggle CT Scan Image ... 26
Figure 3.2 LUNA16 CT Scan Image ... 26
Figure 3.3 LIDC-IDRI CT Scan Image ... 26
Figure 3.4 U-net structure is used for nodule detection ... 28
Figure 3.5 The Quantity of Nodules Identified for a Patient Label Zero ... 29
Figure 3.6 The Quantity of Nodules Identified for a Patient Label One ... 29
Figure 3.7 Convolutional Autoencoder... 30
Figure 3.8 Local Binary Pattern for an Image Patch ... 31
Figure 3.9 3D used in this Approach. ... 32
Figure 3.10 Hydra Net ... 33
Figure 4.1 Pre-trained Xception ... 39
Figure 4.3 Pre-trained Inception-ResNet-v2 ... 40
Figure 4.4 Ensemble Model Breast Histology Image Classification ... 41
Figure 4.5 BreaKHis Dataset for Histopathological Images ... 42
Figure 4.6 Cervical Cancer 2D-Hela Dataset ... 43
Figure 4.7 Cervical Cancer PAP-smear Dataset ... 43
Figure 4.8 Data Augmentation Techniques including Rotating, Cropping, Flipping, Resizing. . 44
Figure 4.9 Accuracy Comparison Breast Cancer Image ... 47
Figure 4.10 Accuracy comparison Cervical Cancer Image ... 48
Figure 5.1 W-net Architecture ... 53
Figure 5.2 Proposed Deformable Cascaded W-net for Segmentation ... 54
Figure 5.3 Retinal Blood Vessel Segmenation Results ... 57
Figure 5.4 Skin Cancer Lesions Segmenation Results ... 59
Figure 5.5 Lung Cancer Segmenation Results ... 60
Figure 6.1 Metastasis Spreads from Organs to Lymph Nodes ... 63
Figure 6.2 Microarray Data Processing. ... 68
Figure 6.3 Block Diagram of Cancer Classification with Dimensionality Reduction. ... 69
Figure 6.4 Block Diagram of Cancer Classification with Feature Selection ... 70
Figure 6.5 Colorectal Cancer Accuracy Comparison ... 73
Figure 6.6 PCA to Reduce the Number of Dimensions Colorectal Cancer ... 73
Figure 6.7 ICA to Reduce the Number of Dimensions Colorectal Cancer ... 74
Figure 6.8 t-SNE to Reduce the Number of Dimensions Colorectal Cancer ... 74
Figure 6.9 Factor Analysis to Reduce the Number of Dimensions Colorectal Cancer ... 75
Figure 6.11 Breast Cancer Accuracy Comparison ... 76
Figure 6.12 Feature Selection Method Accuracy Comparison for Colorectal Cancer ... 78
Figure 6.13 Feature Selection Method Accuracy Comparison for Breast Cancer ... 79
Figure 6.14 Ensemble Method Accuracy Comparison ... 81
Figure 7.1 Proposed Integrated Framework for Biomarker Detection ... 85
Figure 7.2 Non-Small Cell Lung Cancer Segmentation ... 86
Figure 7.3 Plot Diagram of Metagenes Performances ... 89
Figure 8.1 Blockchain Information system types ... 91
Figure 8.2 Blocks in a Blockchain ... 93
Figure 8.3 Proposed Model ... 98
Figure 8.4 IoMT with embedded system with different sensors ... 99
LIST OF ABBREVIATIONS
SVM ... Support Vector Machine
SGD ... Stochastic Gradient Descent
ANN ... Artificial Neural Network
DNN ... Deep Neural Network
MLP ... Multi-Layer Perceptron
CNN ... Convolutional Neural Network
Resnet ... Residual Neural Network
FCN ... Fully Convolutional Neural Network
FCRN ... Fully Convolutional Regression Network
STN ... Spatial Transformer Network
RNN ... Recurrent Neural Network
LSTM ... Long-Short Term Memory
GRU ... Gated Recurrent Unit
CT ... Computed Tomography
1 Introduction
In this chapter, we introduce complete outline to this thesis intended to permit a quick assessment of its focus, objectives, contributions, challenges, and structure.
Background and Motivations
Cancer is a heterogeneous cluster of disorders exemplified by unrestrained expansion of the cells. Cancers are mostly categorized by the nature of cells or tissue considering their origination. Since malignant expansion can arise in almost all locations of the body, around 100 distinct categories of cancers are obvious. Cancer is an enormously complicated and varied disease. Those characteristics, known as traits of cancer, are an integrated set of skills gained during tumor genesis.
In 2012, 14.1 million individuals identified as cancer and 8.2 million people died of that in the world. World Health Organization (WHO) estimated that, around 21.7 million people will be detected as cancer patient and 13 million individuals will die due to cancer by 2030 [1]. Recently, cancer has turn out to be the second prominent source of fatality in the earth. The developing countries are facing the large number expansion of cancer due to several factors like heavy smoking, poor diet, physical inactivity, and environmental pollutions. Now-a-days, commonly identified cancer occurred worldwide are ten different categories. These are lung (13%), breast (11.9%), colorectum (9.7%), prostate (7.9%), stomach (6.8%), liver (5.6%), cervix uteri (3.7%), and bladder (3.1%) [2].
Advances in cancer research have been obvious last a few years, but still remarkable gaps can be observed in this field due to the existence of several subtypes of cancer in the world. Understanding and knowledge gathering would be essential steps to identify and diagnosis of the cancer disease. Researchers now focusing on several distinct subtypes that exist in cancer with
distinct roots, various threat aspects, unique genomic alterations, unusual biological activities, and dissimilar predictions, and scenarios need to be discovered. Early detection, therapy, and supervision of cancers can reduce the risk of the disease [3]. However, failure to detect the cancer effectively would occur high chances of mortality. Several key factors that distract the accurate identification of the disease is given below:
Absence of robust research on precise disease subtypes.
Lack of knowledge of genomic probability factors.
Scarcity of effective and automated disease detection tools.
Inadequate indication-based customized medicine tactics designed to the disease subtypes and tumor attributes.
Lack of awareness given to research on supportive issues for long term care of patients to observe the disease progression
Machine Learning (ML) has yielded significant improvement in modern years. ML is overly used now-a-days in different sectors to achieve incredible performance with high accuracy rate in every steps of work. ML models can analyse different types of data like text, image, audio, video, etc. to extract information from the data and helps to predict the data sequence if new sets of data appear [4]. In this thesis, we aim to use machine learning and deep learning models for solving various problems related to biomedical imaging and genome sequencing in terms of giving a robust disease diagnostic method.
In recent years, computer-aided diagnosis (CAD) have been overly used for disease diagnosis as it is tedious task for human beings to identify disease instantly from the tons of biomedical images and gene expression sequence. Machine learning especially deep learning
models can play a great role for disease diagnosis by accurately identifying the abnormal regions from the medical contents. CAD systems considers those deep learning models reduced the time and task of human being with better disease diagnosis. Moreover, vast amount of data can be handled smoothly and in a faster way comparing to human being.
Aims
The research work aims to develop more accurate and effective cancer detection model by comparing to current disease diagnosis model with the purpose of achieving better performance. Therefore, the research approach has followed by involving five main steps
1. Understanding the existing individual, hybrid disease detection model and their applications in different domain
2. To identify the key issues that can enhance the performance and accuracy of the model 3. Design and implementation of a new feature extraction technique and incorporate it into
the model that can be evaluated through performance measurement methods
4. Investigating a set of deep learning model and consider how the models can be extended and which characteristics are necessary to achieve better accuracy
5. To understand the medical contents collected from internet of medical things (IoMT) devices and sharing technique in a distributed environment using blockchain technique. Performance analysis of the medical data access, sharing, modification in a centralized or distributed system.
This research aims to address the following questions:
1. Can deep learning techniques outperform conventional machine learning algorithms in detecting and classifying cancer from biomedical images as well as genome sequences?
2. How effective the feature extraction techniques in terms of attaining beneficial biomarkers from both image and genome perspective?
3. How can deep learning methods perform finest in terms of limited biomedical data? Which deep neural network architecture is appropriate for disease diagnosis?
4. How to supply security and police investigation for patient medical health records? How clinicians/physicians will access the stored data?
Objectives
The objective of this study is-
1. To develop a computer-aided diagnosis (CAD) system that can process the data effectively in terms of identifying abnormality in the medical contents.
2. To evaluate the performance of the proposed deep learning models with existing real-life datasets.
3. To develop an effective deep learning model for disease diagnosis by considering feature extraction technique, segmentation technique, data augmentation technique etc. and compare the performance to the state-of-the-art method.
4. To propose an ensemble classification model for cancer detection. Pre-trained transfer learning models can be considered if the dataset is of limited size.
5. To develop a model with two stage association study of the medical contents from biomedical images and genome expression for better identifying the disease.
6. To protect the personal details of a patient and to produce confidentiality to patient medical records victimization using “Blockchain Technology”.
Challenges
The central focus of this research is to classify and segment biomedical images for detecting cancer biomarker from different human organs like lung, breast, eye, etc. Moreover, the gene expression analysis using microarray gene expression data of different organs is considered for prediction of metastasis. The association study is also a key part for multiway analysis for detecting cancer outcome. The main challenges that we faced in this research are as follows: a) Biomedical dataset for detecting cancer biomarker is limited in size as the dataset is confidential and patient’s personal information. Moreover, the publicly available dataset is limited in sizes and samples. We applied augmentation technique to enhance the dataset to fed it into the deep neural network. b) Due to limited size overfitting issue can come in biomedical image analysis. Transfer learning with fine tuning would be an answer but sometimes there has some performance issues that we cannot rely on. c) CNN model is overly used for image classification, but the performance is not satisfactory, therefore, ensemble model could be a good choice for cancer biomarker detection. d) In terms of microarray gene expression data analysis, there are huge number of features to deal with. Extracting and selecting significant feature would be a great challenge for analyzing the data for predicting metastasis. e) Research showed that association study of radiological data, histological data, and genome sequences provide significant performances for disease diagnosis. It is challenging to collect biomedical image, genome sequence, histology image dataset for the same sample. f) Secured sharing of image and genomic information in a distributed system is a great challenge when analyzing the confidential patient data. Blockchain technology with privacy preserving technique can be applied.
Contribution
1. An investigation of existing techniques for cancer detection and classification from biomedical images and genome sequences.
2. A novel automatic segmentation and classification method using deep learning. Transfer learning approach is used when the limited biomedical dataset attained.
3. Performance measurement techniques applied to show the robustness of the model comparing state-of-the-art methods.
Outline of the Whole Report
The rest of the thesis is structured as follows:
Chapter 1 discusses the thesis objectives and highlights the research contributions and challenges.
Chapter 2 provides a brief study of biomedical imaging modalities, classification, segmentation, and gene expression analysis with blockchain technology.
Chapter 3 introduces a fusion based approach for lung nodule identification and classification.
Chapter 4 proposes an ensemble of convolutional neural network for microscopic image classification based on breast histological image and cervical cancer image.
Chapter 5 establishes a segmentation method using deformable convolutional w-net based on three different datasets.
Chapter 6 presents an ensemble approach for microarray gene expression classification for breast and colorectal cancer.
Chapter 7 proposes an association study for radio-genomics and histo-genomics analysis for predicting disease biomarkers.
Chapter 8 describes the blockchain based framework for secured sharing of biomedical contents in a distributed environment.
Chapter 9 recapitulates the research findings and delivers the objectives of future research with concluding remarks.
2 RELETED WORK
In this chapter, we contemplate an outline of certain background notions of the subsequent segments of this thesis. We provide a summary of medical imaging techniques with the theoretical background are vital for diagnosis of cancer.
Biomedical Imaging
Biomedical imaging plays an essential role for the diagnosis of cancer stages and hence it is very crucial in healthcare system now-a-days. Medical images can be obtained from different imaging modalities (or techniques) which provide a reliable and non-invasive assessment of diverse cancers [5]. Medical image analysis can extract the meaningful information about the different aspects of diseases conditions. The images are a collection of numerical values as the picture elements known as pixels. In an image, each dimension consists of the number of pixels define the resolution. In an image, 8,294,400 number of pixels are in a resolution of 8.3 megapixels that consists of 3840 × 2160 pixels. Volumetric image of a medical image is the sampled 2D images form 3D image in three dimensions lengthways [6]-[7]. The voxels refer as a 3D volumetric image that translate the three-dimensional associations among 3D pixels. Using image processing techniques both 2D and 3D images encoded information can be extracted and interpreted.
Contrast resolution is a set of concentration colors of red, green, and blue (RGB) that is possible to separable in both colored and greyscale image. In Figure 2.1 shows a 2D and 3D volumetric image. Pixel and voxel are pictured in two dimension and three-dimension arrays of grid.
Biomedical Image Modalities
Different types of imaging modalities are used by modern healthcare for cancer diagnostic and for treatment by attaining different features of a human body. These techniques are split into two classes based on approaches and process in for visualizing diverse features of disease. These are Anatomical and Physiological imaging. Normally Anatomical image captures and pictures the structures of anatomy of the range of interest (ROI) in two or three dimensions [8]. These images assist doctors to understand and assess conditions of disease for diagnosis. These images also assist to identify the response for a specific treatment evolution. For capturing the metabolic condition of the ROI is responsible for the functional imaging. This will help the physicians to evaluate the physiological conditions of patients to recognize the structural anomalies like tumors.
Normally an anatomical clinical modality uses X-ray image, computed tomography (CT) and magnetic resonance imaging (MRI). Single-photon emission computed tomography (SPECT) and positron emission tomography (PET) are included in functional imaging [9]. These imaging techniques generate a single image or generate image volumes. This called single-modality medical imaging.
Now a day for cancer diagnosis multi-modality imaging like PET/CT and SPECT/CT becomes popular diagnosis procedure in clinical studies and in medical research.
Magnetic Resonance Image (MRI)
This is the most used imaging technique in cancer segmentation, diagnosis, and prediction in modern clinical conditions. MRI uses blend of several X-ray to create tomographic images. In the Figure 2.2 shows a CT image of the brain.
Figure 2.2 Brain MRI Image of NSCLC Dataset
Computed Tomography (CT)
It is one of the most exploited imaging modalities for detecting cancer, diagnosis, and prediction. It makes also use blend of numerous X-ray to generate tomographic images. Figure 2.3 shows CT image of the lung field of Non-Small Cell Lung Cancer (NSCLC).
Figure 2.3 NSCLC CT Scan Dataset
Histological Images
Histopathological imaging is the golden measurement for diagnosis cancer. This is the result from biopsies of tumor tissue. The samples of tumor tissue are marked, then collected and then mounted onto glass slides for graphical examination. This assist to picturing the cellular
structures ROIs of tumor. This also gives information on types of mutated cell and therapeutic insights.
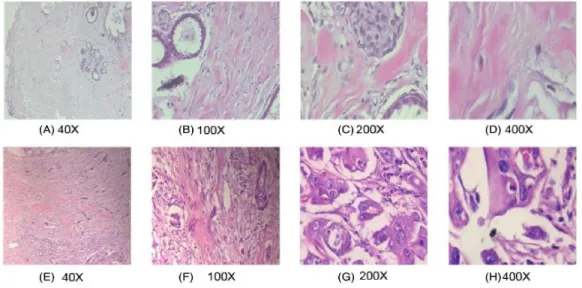
Figure 2.4 Breast Histology Image of BreKHis Dataset
High-resolution whole-slide-imaging (WSI) in histopathology that facilitated the numerical evaluation of tumor histomorphometry as well as its involvement with clinical methods for cancer diagnosis [10, 11]. Similar to CT images, digital WSI enables medical image analysis techniques to be applied to extract image features of abnormal cells. Image traits can then be exploited to correlate to genetic profiles of the tumor. Figure 2.4 shows the presence of sentinel lymph node in breast cancer metastases.
Medical Image Classification
This part represents different methods of medical image classification that shows the authentication of our claims. It is shown here that the existing automated image classification approaches to associate with the manual image classification to assist the experts and reflect their distinct advantages.
Image classification is said to be the most essential phase of digital image processing. It is appealing for a "pretty picture" or an image with the magnitude of coolers signifying numerous
features. It is surely useless without knowing the colors meaning. The main two classification approaches are Supervised Classification and Unsupervised Classification.
Supervised classification is responsible in identifying the classes of Information in the image. They are called "training sites". For every classification class, to develop a statistical characterization the image processing software is used. It is known as "signature analysis". For each information class the statistical characterization is created. Then the image is classified through reflection of examine for each pixel. It helps to make verdict about the signatures that look like most.
Figure 2.5 Supervised Classification [10]
In Unsupervised classification method a huge number of unidentified pixels are examined. All the pixels are divided into several classed and these are depending on the natural groupings, that is depending on values of the pixel. This kind of classification does not rely on analyst quantified training data as supervised classification. The pixels within a given region type should not be diverse to each other in the same dimension. However, different classes’ data should be separated well.
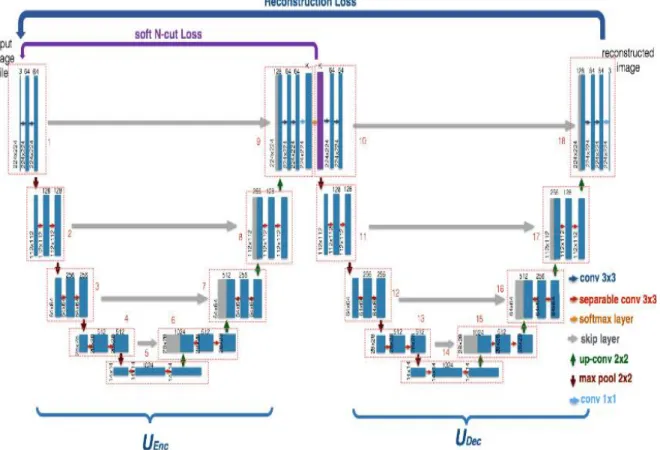
Medical Image Segmentation
This part describes different methods for segmentation of medical image. In the area of medical imagine, segmentation is a process of image dividing. It separates an image in different part where it holds a group of pixels that collectedly signify an ROI. It eliminates unconnected image areas, thus lessen the complexity.
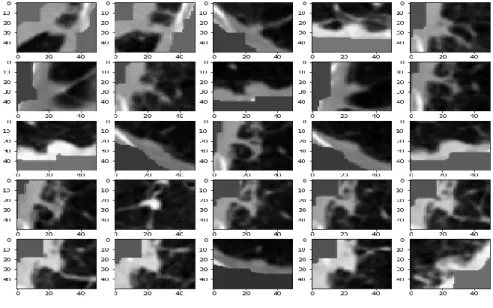
In maximum medical applications, segmentation of a medical image is described by an expert physician is count as golden standard. For cancer patients medical image segmentation are trusts upon the visual examination of images and the manual description of tumor ROI. Figure 2.6 gives the ROIs in different section of medical image modalities. These are defined by qualified physicians.
Figure 2.6 Region of Interest (Lung Cancer) in a CT image
Automated segmentation of medical images helps practitioner immensely to identify lesion in medical images by gathering useful information that may lead to take necessary action. Several architectures have been proposed for medical image lesion detection and segmentation tasks. Semantic segmentation has been overly used last couple of years that incorporating various structure like U-net, V-net, Y-net, and W-net. Figure 2.7 depicted a diagram on W-net for medical image segmentation and analysis tasks.
Figure 2-7 W-net for Image Segmentation [11]
Gene Expression Profiling
The visual examination is measured only the diagnosis scheme of tumor histopathology. But sometimes the diagnosis error is found in tumor classification due to graphical unclear morphological properties. A quantitative perception can be obtained as Gene expression profiling facilitates tumor identification and predicting for the future clinical diagnosis for the cancer [12]. This subsection is mainly designed for genes core concept, its expressions and application in medical studies.
A definite region of the deoxyribonucleic acid (DNA) strands for a gene. It can achieve ribonucleic acid (RNA) using genetic codes through transcription. Synthesizing proteins is the characteristics of RNAs to encode biological functions through translation. DNA change or damage is very common as the genetic codes allow mutation and permanent alteration of genetic
elements. However, the change in DNA, mutations could be resulted in changes in functions and behavior of genes. The multiple prognosis of cancer genes is the result of mutation according to the evidence of Clinical studies. Gene expression profiling is responsible for the patient’s genetic information and the application of individual precision medicine.
Gene expression profiling depends on the invasive surgical procedures. So, the use of gene expression profiling is controlled although its significance in the diagnosis and prediction of cancer patients. Unfortunately, strong phenotypic and genetic heterogeneity is seemed to allow the cancer growth for an individual manifesting at multiple sites. The different characteristics of treatment depends on the varieties in gene expressions across multiple sites.
Learning Algorithms
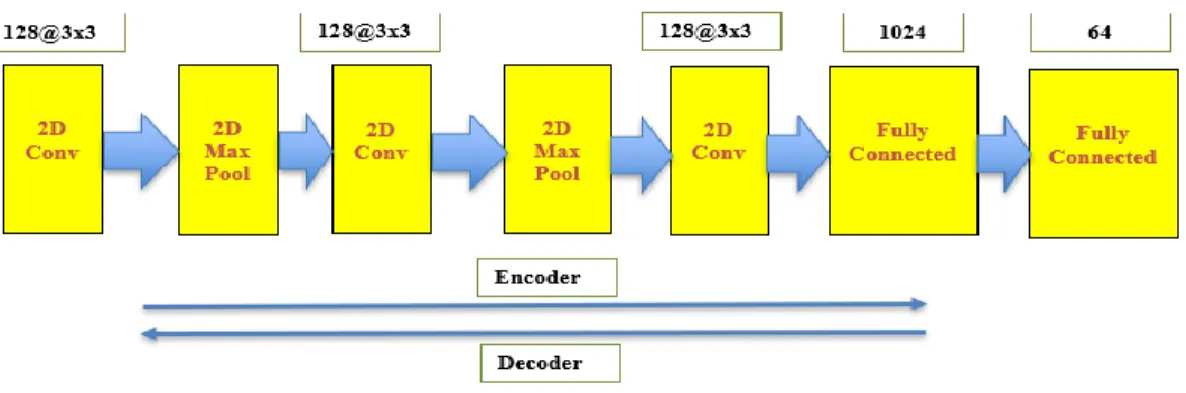
In medical image processing the machine learning has added a great vale. The Machine learning techniques increase the ability to develop the automated algorithm in clinical studies. To develop any computer aided system the expertise in this field is the demand of time. One of the subbranch of machine learning the class of Deep learning which requires to train multiple train data level. For example, the convolutional neural network is the implementation of deep layers which can extract the potential image feature [13]. This section emphasizes the principles of deep learning models especially the CNNs architecture because they present the current sophisticated image in recognition of the object of the image. The relevant architecture of CNN model is given bellow.
Artificial Neural Network
ANN introduces the machine according to the biological principle of human brain structure [14]. It forms nodes said as "artificial neurons" and builds a graph structure of neural network. The machine learning uses to extract the nonlinear relationship of experiment data by ANN. The
artificial neuron processes and transmits signals using the network of ANN as same as biological synapse. ANN needs to achieve an optimal architecture to harmonize network weights and bias to get the appropriate outcome.
In ANNs the basic building blocks are the neuron. Using Figure 2.8 it is clear how the neuron takes multiple input values and produce a single output value. Here the input vector is X of
n elements, the weight vector is W for the same number of elements, equation 2.3.1 summarizes the whole scenarios:
L (𝑊, 𝑋) = Σ 𝑋=0 𝑛𝑓 (𝑥𝑖, 𝑤𝑖) + bias (2.1)
Figure 2.8 Single Layer Neuron [12]
In single model of neuron depicted in Figure 2.8 contains ANN training processes. To transmit the component of training data it uses the form of feature vector. The classification is conducted in two parts; each neuron is multiplied by its internal weight, then performs on the input vector whether it is above or below the threshold value.
Machine Learning
The modern healthcare system depends much of the principle of machine learning. Main principle of machine learning is to recognize the pattern using intelligence mathematical model. The goal is achieved by classification and retrieval of image, in tumor image section. The basic machine learning techniques as ruled-based system is developed the models of artificial intelligence. It is essential to "teach" to identify the distinctive features of patterns in machine learning for the data in order to produce outputs of money. Typically, learning methods are divided as: supervised, unsupervised and reinforcement learning.
While multiple disciplines of observable and reinforcement learning demonstrate strong potential. The marked medical imaging data is used to discover region-specific genetic associations. Since the outcome to this work are primarily related to supervisory methods, we only need them here.
Training Data: is the repository of data to train a model used in machine learning. The training data presentation and its future relationship is obtained by machine learning model.
Validity data: is a distinct data set to monitor the training process. This data set is made compare the output data with the predicted one by the training data labels. The performance of unseen data is approximate by the model parameter.
Test data: is a collection of recorded data to measure the accuracy of the model after the training process is completed. The test data shows the effectiveness of the trained model. Test data is not including in the process of training.
Deep Learning
In-depth learning is classified as a section of machine learning techniques; this allows multiple processing-level calculation models to learn multiple levels of abstraction from the
internal representation of input data. It performs a limited task of traditional thematic machine learning method to process ordinary data in its raw form depth. Deep learning solves this problem by solving abstract representations from high-level understanding of input datasets, to low-level learning and interpreting multiple processing levels. This is accomplished by continuously giving raw information through a continuous multilayer architecture, where the deeper layers have learned abstract representations from the representations of the previous layers.
The multilayer model for teaching under the supervision of in-depth teaching strategies employs error propagation or "backpropagation" for training [15]. Back proposition calculates the gradient of the ANN's weight-related error function and moves the gradient backwards through the neural network. The backflow of error gradients allows for efficient calculation of gradients for ANNs.
GPUs are used to advance the effectiveness of the training process from 10 to 20 times compared to usual therapeutic training methods in standard CPUs through the application of deep learning techniques.
2.9.3.1 Convolutional Neural Networks
It is a special type of ANN that is designed to work with input data in multidimensional arrays form, such as color two dimension that contain 2D arrays for each RGB channel. CNN training is easier and generalized. It is organized in different phases, and each phase has a special layer with unique functions. CNN's building blocks have three specialized layers: convoluted, pooling, and activation.
The convoluted layers contain units that organized in feature maps’ form. Its each unit is linked to local patches via a set of weights from the previous layer referred to as the filter bank shown in Figure 2.9. The sum of the results of the local filter bank is conveyed over a linear
activation layer. Having same kind of feature map is shared with the same filter bank. This value allows evolutionary layers to identify local combinations of local properties from the preceding layer. Because of highly connected probability of local values and swap locations at the input of an image.
Pooling layers are for merging features in three-dimensional closeness that has semantic similarities. The principle behind the pooling layers is to locate the themes which are usually formed by highly connected features through a thick granular method.
CNNs are stimulated by the transmission of biological signals over cells with various complexities and different functions in visual neuroscience. CNNs use compositional orders in ordinary signal processing.
The high-level features output from a combination of low-level features. In the images, objects combine edges, motifs, and parts. CNN has made great strides in the sophisticated industry in multiple branches. CNN has been used mainly in medical image examination to perform multiple tasks. These include image segmentation, classification, and identification of diseases.
Google net, a deep CNN architecture submitted in 2014 as part of the ImageNet Large-Scale Visual Recognition Challenge 2014 (ILSVRC14). It has 22 levels. Google Net is created to performance as a classifier for images of nature.
Figure 2.9 CNN with Convolution Layers [15].
It included the fundamental concept of increasing width and depth. Between this work it is keeping calculation costs constant. In the sophisticated region of time, Google net showed significant improvements.
Performance Evaluation Metrics
In image retrieval and classification, performance evaluation can be measured with a variety of metric accuracy and retrieval metrics commonly used in these domains. In image retrieval, accuracy refers to the percentage of true positive images and this percentage of true positive images regained in all relevant images in the datasets. This describe as below:
𝑃𝑟𝑒𝑐𝑖𝑠𝑖𝑜𝑛 = 𝑡𝑝 / 𝑡𝑝 + 𝑓𝑝 (2.2)
𝑅𝑒𝑐𝑎𝑙𝑙 = 𝑡𝑝/ 𝑡𝑝 + 𝑓𝑛 (2.3) Where true is the number of positive or relevant retrieved images, false positive or irrelevant retrieved images and false negative or relevant retrieved images. Therefore, the accuracy measures the accuracy of the recovery, where the recovery measures the ability to recover relevant items from the database. Another metric that can be used for evaluation purposes is the F-score
metric, which is matched with accuracy and can vary in varying degrees depending on the use score:
𝐹𝑠𝑐𝑜𝑟𝑒 = (1 + 𝑠𝑐𝑜𝑟𝑒2) 𝑃𝑟𝑒𝑐𝑖𝑠𝑖𝑜𝑛 . 𝑅𝑒𝑐𝑎𝑙𝑙 / 𝑠𝑐𝑜𝑟𝑒2 . 𝑃𝑟𝑒𝑐𝑖𝑠𝑖𝑜𝑛 + 𝑅𝑒𝑐𝑎𝑙𝑙 (2.4)
Therefore, increasing the score may increase the weight of the recall metric from accuracy and vice versa. In the image classification, the accuracy of a classifier at the test stage is a true positive number compared to the total classified examples.
Blockchain
During this age of digitalization, the health care sector needs to more secure way to transfer data between different stakeholders. The number of health care data is also is big enough to handle with great sensitiveness. Medical data has different types of formatting and representation. These data include health records, images, sensor data, genome sequences, bills, and payments and many more. Collecting and combining all these data can help to get run machine learning and different analysis to get inside information. This information will be very valuable for different sector from medical center to patient and between them many other actors.
Making a common intelligent system for medical information management, it is very important to bring all format of data in a common format that they can understand each other. This system data is increasing every second. So, volume of the dataset also a big challenge to handle in this system.
The GDPR and HIPAA are two regulations in Europe and United states as advocate patient's privacy. This describe the law about the rights of a patients to give access to their medical data [16]. It is given the data protection of a patient. To build a total electronic health care system,
it is crucial to keep information confidential from different level of stakeholders according to the permission of the patient. In the electronic health care system, maintaining the data, giving permission to different stakeholders, formatting the data for all platform, all these increase the system complexity and through a big challenge.
Health care eco system ensuring the security of the health record and share this data in secure way to national and international wide. For this need a common architecture for share with different actors in the system.
Figure 2.10 Healthcare Related Blockchain Project [16]
Blockchain could be a game changer in this filed with high security and in the distributed form. This technology gets the attention of both academia and industry. This technology employs complete control to a single user with giving fully controlled from a central point. For sharing health care, this technology enhances the privacy-preserving data. In the scenario of chronic diseases, data need to share between different physician to get multiple medication. For getting better treatment of chronic diseases, may need to go different places for different types of
medication. Using blockchain technology the data could share in a secure way. This technic optimized the supply chain process. It is now crucial to implement the blockchain in the medical information eco system to share the information in secure process and give patient a optimized solution for his/her treatment.
3 LUNG CANCER DETECTION AND CLASSIFICATION IN CT IMAGERY USING HYDRA-NET WITH FEATURE FUSION
In this chapter, we contemplate an outline of certain background notions of the subsequent segments of this thesis. We provide a summary of medical imaging techniques with the theoretical background that are crucial for cancer diagnosis.
Introduction
Deep learning is a new branch of machine learning techniques that involve with high level data abstractions by considering a series of non-linear transformations. The complex model architectures followed by these algorithms to achieve better performances from large-scale unlabelled data and it passes through several hidden layers to identify and extract the complex features that finally produce an output. The deep learning uses previous layer computations in terms of identifying features and that is a power of the technique [17]. In recent years, deep learning has great impact on medical data processing, like lung cancer detection, skin cancer detection, etc. Lung cancer is the most dangerous cancer for a human being that increasing in an alarming rate with $12 billion in health care costs yearly in the US. Doctors are fully depending on the CT scans but could not be able to identify the disease. Therefore, computer aided support is needed for the doctors to make their job easy and that can reduce the death rate due to lung cancer. There are several machine learning classification approaches used in past few years by the researchers like SVM, RNN etc [18]. However, to effectively handle the complex structure SVM, KNN techniques are not good enough. Therefore, Deep learning technique is a good one to handle the complex situation without considering a huge number of nodes that is used in traditional machine learning technique like SVM and KNN [19]. It is now growing rapidly in different health sectors like bioinformatics, brain image analysis, retinal image analysis etc.
In this research, two deep learning approaches has been applied to identify the lung cancer from CT scan images. Firstly, an autoencoder approach is used with data pre-processing with u-net architecture is used for nodule detection. Secondly, a 3D Descent is used for lung nodule detection and classification. Finally, a hydra net is used for feature fusion of the two afore-mentioned model. The proposed hydra model shows significant performance comparing with state-of-the-art methods. Several machine learning and statistical techniques was used to detect lung cancer nodules with better accuracy rate. The rest of the paper is organized as follows: section 3.2 considered the datasets. Section 3.3 considered the pre-processing, 3.4 considered the methodology and, 3.5 described the experimental results. Finally, the whole paper terminates with a summary in section 3.6.
Datasets
In this research, Kaggle datasets used first that enclosed with CT scan images of different patients labeled with no cancer and cancer. For the training set, CT scan images from 1397 number of patients has been taken and 198 patients CT scan images is considered as test set. Moreover, the images are gray scale of size 512 x 512 that is very large, and the images are already labeled. Though each patient’s datasets are already labeled, there is no information about the location of the nodules.
Figure 3.1 Kaggle CT Scan Image
Figure 3.2 LUNA16 CT Scan Image
Figure 3.3 LIDC-IDRI CT Scan Image
In terms of LUNA16 datasets [2][4], the CT scan images of the patients is considered with labeled datasets. Moreover, there are some annotations that make it more useful to identify the location and classification of nodules. Kaggle dataset contained 25000 gray scale CT scan images and the LUNA16 contained 888 CT scan images. Moreover, LIDC-IDRI dataset consists of 686
lung nodule samples with 1010 CT scans. The sample image for the three different datasets is mentioned in figure 3.1, 3.2, and 3.3.
Methodology
In this section, the pre-processing stages employed in the experiments is explained along with the approaches to address the problem.
Pre-processing
The pre-processing steps covers the following areas like segmentation of nodule from lung, z-score normalization and finally nodule detection using u-net architecture
Lung Segmentation
Lung segmentation is the key task to work with lung images to identify the lung disease. The candidates of the lung nodules regions are considered from the CT scan images. False positives reduction has been performed by applying thresholding value calculation technique depending on the pixels intensity that separate the lungs pixels from the image. Kaggle and LUNA datasets is considered for the segmentation purpose along with the filtering method like erosion and dilation to calculate the patches [20].
3.3.2.1 Z-Score Normalization
There are several normalization technique available now-a-days. Max-min normalization and z-score normalization technique is overly used in data mining and machine learning arena. In this research, z-score normalization technique is used for the CT scan images that subtracted the mean to centralize the images. Then the standard deviation is considered to apply division technique to complete the normalization process.
3.3.2.2 Nodule Detection
Nodule detection is very important to identify the lung cancer regions from an image. U-net [8] structure of neural U-network performs significantly well to segment the images and properly detect the nodules. CT scan images is considered from both the dataset like Kaggle and LUNA for the segmentation purpose and after carefully segmented the images using U-net architecture, the dataset is fed to the deep neural network for classification purpose.
Figure 3.4 U-net Structure for Nodule Detection [21]
Binary mask output can be obtained after all the processes that represents the specific location of the nodule in an image. The U-net architecture for segmenting the images has been mentioned in Figure 3.4. The quantity of nodules for specific patient also obtained from this process with cancer and no cancer chances labeled mentioned in figure 3.5 and 3.6.
Figure 3.5 Quantity of Nodules Identified for a Patient Label Zero
Figure 3.6 Quantity of Nodules Identified for a Patient Label One
3.3.2.3 Convolutional Autoencoder Approach
Convolutional autoencoder approach is very popular for lung nodule detection from CT scan images where the image patches are considered from the lung input images. After detecting the patches from with a view to identify the nodules in the images, encoding operation is performed
to represent all the patches in a feature vector. Finally, SVM is used for the classification purpose. U-net architecture mentioned before is used for nodule detection.
3.3.2.4 Autoencoders
Autoencoder approaches have been considered to identify the lung cancer and eventually compared all the processes to come up with the best approach. In the first approach, the patches are identified from the CT scans images after detecting the nodules with appropriate pixel values. 48 x 48 patches extracted from the image and three techniques like autoencoder, local binary patterns evaluation, flattening is applied to encode the patches. The feature vector is identified from all the patches that generate 64-dimensional vector and eventually fed into the SVM classifier.
The architecture of the autoencoder used here is shown in Fig. 3.7. The convolutional autoencoder used in this approach.
Figure 3.7 Convolutional Autoencoder
Local Binary Patterns (LBP)
LBP is a popular technique also used termed as local binary patterns that generate the binary code from the image by calculating the value of the neighboring pixels and update the
current pixel value. The feature vector is generated from the n bit number of neighbors and can be used to express an image with the binary bit patterns mentioned in figure 3.8. Flattening is the method where the raw pixels of the patches is used for encoding purpose and represented using a vector [22]. The whole process mentioned in figure 3.8 where a convolutional neural network is used.
Figure 3.8 Local Binary Pattern for an Image Patch
3.3.3.1 Flattening
For encoding the candidate patches raw pixel patches is used to form a vector. In here 48 x 48 patches is simply used as a vector. In terms of patient level representation, a feature vector is needed for each patient to describe whether the patient experienced lung cancer disease or not. Finally, the average value of encoding is considered based on all the patches to represent the final feature vector.
3D DenseNet Approach
The DenseNet architecture consists of 3D convolutional neural network with sequence of Dense block and transition layer. The performance of 3D DenseNet is exceedingly high comparing with other state-of-the-art deep learning model as the overall distance in between input to the output is less. Due to the architecture with shorter distance, the better optimization result can be obtained as the vanishing gradient would be enhanced. The overall architecture of 3D CNN is
mentioned in figure 3.8 where the 3D volumetric image is used as the input and passed through the 3D convolutional layer and the sequence of Dense block is considered along with transition layer and finally fully connected layer is used with softmax to classify the value. In this approach, lung cancer 3D CT scans is used as input, rather than 2D CT scans. In this model, 3D volumes of shape 120 x 512 x 512 is considered with the batch size of 32.
Figure 3.9 3D DenseNet.
Hydra Net Approach
An ensemble of deep neural network is considered for forming a hydra net architecture. The training set, initial weights, and the number of layers is varying tremendously to form the hydra net architecture. In our proposed approach, we considered the 2D CNN and 3D DenseNet of different architecture to combine and form the hydra net structure. The important thing of this kind of network is it is complex and time consuming to deal with different weight from initial to final layer with varying structure. Hydra architecture considers various transformation based on geometry in terms of the training samples of the network.
Figure 3.10 Hydra Net
Moreover, hydra net calculates the results by combining the values of the heads with score vector that represent the classification. Therefore, each produces a score vector result and all the head score values is considered. Finally, the values with highest majority voting would be considered for identifying the final label. Depending on the number of heads and number of votes, we can determine whether there are false positives or not.
Experimental Results
All the methods that were used in this research was implemented in python with other essential libraries like NumPy, Scikit-Learn, TensorFlow, Keras. In terms of performance evaluation, the U-net architecture is considered for detecting the nodules with true positive rate of
85 percent and the 65 percent for training and test datasets where the LUNA16 was considered. The hardware and software system specification are mentioned in Table 3.1
Table 3.1 Hardware and Software Description
Hardware Software
Processor: i7-6000, 2.80 gigahertz OS: 64-bit Windows 10 Primary Memory: 16 gigabytes RAM API: Keras [50]
GPU: NVIDIA GeForce GTX 770 Backend: Tensorflow [51] Storage: Solid State, 250 gigabytes Language: Python 3.7.3 [52]
This experiment evaluates the computation result using the parameters, such as accuracy, specificity, sensitivity, and F-score. These parameters are achieved using True Positive (TP), False Positive (FP), True Negative (TN), False Negative (FN) derived from the confusion matrix. Equation (3.1) to Equation (3.5) represents the computing formula of these five performance parameters from the value of confusion metrics.
𝐴𝑐𝑐𝑢𝑟𝑎𝑐𝑦 (𝐴𝐶𝐶) = 𝑇𝑃+𝑇𝑁 𝑇𝑃+𝑇𝑁+𝐹𝑃+𝐹𝑁 (3.1) 𝑆𝑝𝑒𝑐𝑖𝑓𝑖𝑐𝑖𝑡𝑦 (𝑆𝑃) = 𝑇𝑁 𝑇𝑁+𝐹𝑃 (3.2) 𝑆𝑒𝑛𝑠𝑖𝑡𝑖𝑣𝑖𝑡𝑦 (𝑆𝐸) = 𝑇𝑃 𝑇𝑃+𝐹𝑁 (3.3) 𝑃𝑟𝑒𝑐𝑖𝑠𝑖𝑜𝑛 (𝑃𝑅) = 𝑇𝑃 𝑇𝑃+𝐹𝑃 (3.4) 𝐹 − 𝑠𝑐𝑜𝑟𝑒 (𝐹𝑠) = 2 ×𝑆𝐸×𝑃𝑅 𝑆𝐸+𝑃𝑅 (3.5)
To evaluate the performance of the U-Net, we assumed that a nodule was detected correctly if the U-Net detected a nodule within 10 pixels of its correct location in the annotated mask. The U-Net described in 3.2.1 achieved a true positive rate of 85% and 65% on train and test sets, respectively, of the LUNA16 dataset, and an average false positive rate of 0.14 and 0.4 per slice on the same, respectively.
The log loss can be formulated as:
𝐿𝑜𝑔𝐿𝑜𝑠𝑠 = −1
𝑛 ∑ [ 𝑦𝑖log (𝑦̂ + (1 − 𝑦𝑖) 𝑖) log (1 − 𝑦̂𝑖)
𝑛
𝑖=1 ] (3.6)
Where, n is the number of patients in the test set
^yi is the predicted probability of the image belonging to a patient with cancer
yi is 1 if the diagnosis is cancer, 0 otherwise
The Kaggle dataset contains CT scans from 198 patients that are not labelled, these patients form the test set for the submission on which we are scored.
Table 3.2 Model Comparison
Method Accuracy Log Loss
2D CNN 81.21% 0.43257
3D DenseNet 84.74% 0.42865
From Table 3.2 it can be observed that, 3D DenseNet achieved better result compared with 2D CNN method where the log loss is near about 0.42. In 2D CNN, U-net architecture was used along with three auto encoder techniques that performs significantly better than using raw datasets directly into the classifier and heatmap techniques. 3D DenseNet performance is not better than 2D CNN. The accuracy of the dataset is achieved where 20028 samples is considered for the training set and the 9866 samples is used for the validation purpose with different epoch values.
Table 3.3 Comparison with the State-of-the-art Method
Method Accuracy
Multi-Scale CNN [10] 86.84% Vanilla 3D CNN [11] 87.40%
Hydra Net 91.75%
86.84. The other deep learning models is compared with the proposed hydra net. The performance of the hydra net shows better accuracy results comparing with the other model as the different architecture with different weights is considered in hydra net. Finally, the majority voting scheme with strengthen vanishing gradient enhance the model performance.
Summary
Lung cancer detection has been a key research area last couple of years. The researcher has applied several methods to improve the performance of the computer aided process. Classification methods play key role to identify the nodules from the images with better prediction rate. In this research, two methods are considered to evaluate the performance. U-net architecture is used for nodule detection purpose. Convolutional neural network is used as the classification purpose and have shown greater performance along with autoencoder, binary patterns and flattening. The performance of the 3D DenseNet is superior than the 2D CNN with better log loss value. Moreover, the ensemble hydra net performs better than the single deep neural network model.
4 MICROSCOPIC IMAGE CLASSIFICATION USING ENSEMBLE OF DEEP CONVOLUTIONAL NEURAL NETWORK
Introduction
Microscopic image study has great impact for cancer detection and classification and the practitioner is fully focusing on the images to attain valuable information. Early detection and diagnosis can boost the possibilities of endurance rate of the cancer. Cancer is extremely spreading in the world and become the prominent cause of mortality of the mankind. Mammography and biopsy are the two overly applied methods for cancer disease diagnosis. Radiologist is fully responsible for early detection of the cancer in mammography whereas tissue is considered for biopsy in terms of detecting cancer. It is important to identify the cell where cancer occurred based on the shape, size, degree of malignancy, and distribution of tissue. However, identifying cancerous cell by visually inspecting it is time consuming and laborious task. Moreover, expert pathologist needed to go through the process and sometimes it is hard to identify cancerous cells from bunch of images. Therefore, effective identification of cancerous cell may lead to biopsy and may reduce the chance of infection and mortality [24].
Latest advancements in machine learning and image processing have facilitated the improvement of computer-aided diagnosis (CAD) systems for identifying and analyzing breast cancer and cervical cancer from the microscopic images more smoothly and faster way with higher accuracy results. The CAD system analyzes the microscopic images of the sample tissue, and finds the patterns corresponding to the cancerous and non-cancerous condition and classifies the images respectively into benign and malignant class. The major challenges associated with the classification of breast and cervical cancer images include the inherent complexity in microscopic images such as cell overlapping, subtle differences between images and uneven color distribution.
The objective of this study is to develop an accurate and reliable solution for breast cancer and cervical cancer classification.
In this study, we have analytically examined the deep learning models for automated identification of breast cancer. Key features of this work are as following:
Deep convolutional neural network with transfer learning is considered to detect breast cancer and cervical cancer from microscopic images
Data augmentation technique including rotation, cropping, flipping, and resizing has performed for image augmentation.
Examined the performances of deep ensemble model with the state-of-the-art breast histology and cervical cancer image classification methods.
This chapter is organized as follows: Section 4.2 describes the proposed method for classification of benign and malignant histopathological images and cervical images. Section 4.3 describes the dataset and data augmentation method. Section 4.4 presents the evaluation metrics along with the experimental results. Finally, the conclusion is drawn in Section 4.5.
Methodology
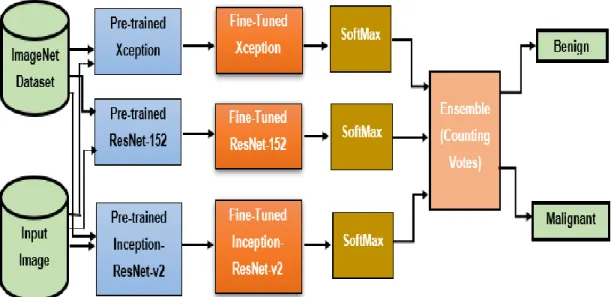
In this research, we introduce a novel deep neural network architecture for microscopic image classification using transfer learning. In the proposed architecture, three state-of-the-art CNNs are used to extract features using transfer learning and fine tuning. The pretrained CNN models such as Xception [25], Resnet [25], and Inception-Resnet-v2 [25] would be considered as feature extractor for the proposed ensemble model for microscopic image classification. The overly applied environmental image dataset known as ImageNet dataset is employed with these CNNs. ImageNet consists of millions of natural images can be applied for biomedical images as
the dataset is small. The extracted features from each pre-trained CNN would be combined in fully connected layer for microscopic image classification.
Google’s inception CNN model is extended to develop Xception [25] model by incorporating detpthwise separable convolutions and it has gained significant performance and have been applied for biomedical image analysis and applications. As different sized convolutional filters used in this model it reduces the number of hyperparameters as well as computational complexity. The Xception module is robust, stronger than the Inception module, and major composition inside the pretrained Xception architecture, as demonstrated in figure 4.1.
Resnet is a deep residual network that consists of multiple neural networks with sequence of convolutional connection. In here we considered Resnet152, thought there are other Resnet version with different depth. Resnet152 is overly used for biomedical image classification and shows significant performance. It reduces the running time and computational complexity by decreasing the number of parameters. Figure 4.2 illustrates the basic architecture of Resnet152.
Figure 4.2 Pre-trained ResNet-152
Inception-Resnet-v2 [25] consider the blended of Inception CNN structure and Residual connection to form the new architecture. A sequence of convolutional layer with max pooling operation is considered in Inception-ResNet-v2 structure with the bunch of residual connections that decreases the running time of the network. Figure 4.3 shows the basic network architecture of Inception-Resnet-v2.
![Figure 2-7 W-net for Image Segmentation [11]](https://thumb-us.123doks.com/thumbv2/123dok_us/374676.2541301/34.918.154.768.112.519/figure-w-net-for-image-segmentation.webp)
![Figure 2.10 Healthcare Related Blockchain Project [16]](https://thumb-us.123doks.com/thumbv2/123dok_us/374676.2541301/42.918.144.775.406.767/figure-healthcare-related-blockchain-project.webp)
![Figure 3.4 U-net Structure for Nodule Detection [21]](https://thumb-us.123doks.com/thumbv2/123dok_us/374676.2541301/48.918.164.749.358.709/figure-net-structure-for-nodule-detection.webp)
![Figure 4.1 Pre-trained Xception [25]](https://thumb-us.123doks.com/thumbv2/123dok_us/374676.2541301/59.918.171.766.440.1020/figure-pre-trained-xception.webp)