Volume Title: Explorations in the Economics of Aging Volume Author/Editor: David A. Wise, editor
Volume Publisher: University of Chicago Press Volume ISBN: 0-226-90337-0
ISBN13: 978-0-226-90337-8
Volume URL: http://www.nber.org/books/wise09-2 Conference Date: May 2009
Publication Date: March 2011
Chapter Title: The Demand for Medicare Part D Prescription Drug Coverage: Evidence from Four Waves of the Retirement Perspectives Survey
Chapter Authors: Florian Heiss, Daniel McFadden, Joachim Winter Chapter URL: http://www.nber.org/chapters/c11938
159
Retirement Perspectives Survey
Florian Heiss, Daniel McFadden, and Joachim Winter5.1 Introduction
Most developed countries have mixed “universal coverage” health care systems with mandated health insurance fi nanced from some combination of consumer, employer, and government sources. The United States is the only developed country without universal coverage; about 18 percent of the nonelderly population are currently without health insurance (Gruber 2008). The elderly are universally covered under the Medicare program, but historically Medicare did not cover prescription drugs. Before 2006, roughly 25 percent of the elderly population (age sixty- fi ve and above) had little or no insurance coverage for their prescription drugs, and 10 percent had annual pharmacy bills exceeding $5,600 (Winter et al. 2006). According to data from the U.S. Bureau of the Census (Current Population Survey, 2006, Annual Social and Economic Supplement), median per capita income in this population was $15,700 in 2005, and 29 percent of this population had incomes below $10,000. Uninsured prescription drug costs were thus a heavy Florian Heiss is chair of the Department of Statistics and Econometrics at Johannes Guten-berg University, Mainz. Daniel McFadden is the E. Morris Cox Professor of Economics and director of the Econometrics Laboratory at the University of California, Berkeley, 2000 Nobel Laureate in Economics, and a research associate of the National Bureau of Economic Research. Joachim Winter is chair of Empirical Research in Economics at Ludwig- Maximilians University, Munich.
Paper prepared for the NBER Conference on the Economics of Aging, May 7–10, 2009, Carefree, Arizona. This research was supported by the Behavioral and Social Research pro-gram of the National Institute on Aging (grants P01-AG05842- 18, P01-AG05842- 23, and R56 AG026622- 01A1), with additional support from the E. Morris Cox Fund at the University of California, Berkeley. We thank Amy Finkelstein for her insightful discussion. The authors are solely responsible for the results and conclusions offered in this chapter.
1. The debate about the effect of high- deductible plans has drawn heavily on a landmark study conducted by the RAND Corporation in the 1970s and 1980s, the Health Insurance Experiment; see Newhouse (2004). Buntin et al. (2006) and Goodman (2006) provide additional discussion of consumer- directed health care.
burden on unhealthy elderly. This was a major public concern prior to the introduction of Medicare Part D in 2006.
Medicare Part D provides the Medicare- eligible population with uni-versal access to standardized, heavily subsidized prescription drug cover-age through government- approved plans sponsored by private insurance companies and health maintenance organizations (HMOs). In addition to providing access to affordable drug coverage to all Medicare benefi ciaries (in particular to the chronically ill), a second policy goal was to create a “competitive, transparent marketplace offering a wide array of benefi ts” (Bach and McClellan 2005, 2733). Overall, the introduction of Medicare Part D has been viewed as a success story (Heiss, McFadden, and Winter 2006, 2010; Goldman and Joyce 2008; Duggan, Healy, and Morton 2008). High enrollment rates have been achieved—in the fi rst year of Medicare Part D, more than 90 percent of the eligible population had prescription drug coverage, either from a Medicare Part D plan or from some other source with comparable coverage (Heiss, McFadden, and Winter 2006). Consum-ers face a broad menu of plans to choose from, and premiums are at levels lower than anticipated by policymakers and sponsors.
The institutional design of Medicare Part D exemplifi es the current trend toward “consumer- directed health care” as it relies on consumer behavior and competition among insurers to attain satisfactory market outcomes with limited government regulation. Policymakers around the world, and particularly in the United States, are increasingly stressing the role of con-sumer choice and provider competition in the provision of public services.1 In the case of Medicare Part D, and arguably also in other similar programs, giving consumers more choice also means confronting them with difficult decisions (McFadden, Winter, and Heiss 2008; Kling et al. 2008; Abaluck and Gruber 2009).
The argument for creating markets in which consumers choose among private providers of services depends on consumers’ ability to make informed choices. Making optimal, or even just reasonable, decisions in the Part D market is difficult for seniors. They face uncertainty with respect to their future health status and drug costs, a rather complicated benefi t schedule with a coverage gap and other peculiar institutional features of the Part D program (to be discussed in detail later), and a large number of available plans with features that vary along several dimensions. The complexity of Medicare Part D was a great source of concern before its introduction (see Heiss, McFadden, and Winter 2006). How seniors decide whether to enroll in Medicare Part D, and what plans they select, is therefore not only of
2. In what follows, the three waves of the Retirement Perspectives Survey are referred to as RPS- 2005, RPS- 2006, RPS- 2007, and RPS- 2009, respectively.
fi ve and above, termed the Retirement Perspectives Survey (RPS), to study information, perceptions, and preferences regarding prescription drug use, cost, and insurance. After the initial enrollment period closed on May 15, 2006, we reinterviewed the same respondents to elicit their actual Medicare Part D decisions for 2006. Third and fourth waves of our survey were con-ducted in March/April 2007 and in March/April 2009. Data from RPS- 2009 are analyzed in this chapter for the fi rst time.2 In most of our analysis, we concentrate on “active deciders,” the eligible individuals in our sample who did not have prescription drug coverage in November 2005 that was auto-matically converted to Part D coverage or equivalent in 2006 (e.g., automatic coverage through their current or former employer’s health program, the Veterans Administration, or Medicaid). Our aim is to understand whether choices were related to the salient features of the program and the economic incentives they generated. We look at whether active deciders enrolled in Part D or not, at subsequent switching, and at the choice of plans. We stress the role of 2005 prescription drug use, health risks, and subjective factors in the demand for prescription drug insurance. We generally fi nd that seniors’ choices respond to the incentives provided by their own health and by the market environment.
The remainder of this chapter is structured as follows. In section 5.2, we review the Medicare Part D program and some of the research on individual decisions that has emerged since its introduction. We describe the Retire-ment Perspectives Survey project in section 5.3. Our empirical results are reported in section 5.4. In section 5.5, we summarize our fi ndings and discuss avenues for future research.
5.2 A Brief Review of the Medicare Part D Program and Related Research
The Centers for Medicare and Medicaid Services (CMS) within the U.S. Department of Health and Human Services administer health insurance coverage for older Americans via the Medicare program. The Medicare Modernization Act of 2003 (MMA) was enacted to extend coverage for prescription drugs to the Medicare population. Beginning in 2006, the new Medicare Part D benefi t reduced the fi nancial burden of prescription drug
spending for benefi ciaries, especially those with low incomes or extraor-dinarily high (“catastrophic”) out- of- pocket drug expenses. The CMS administers this program, subsidizing outpatient prescription drug cover-age offered by private sponsors of drug plans that give benefi ciaries access to a standard prescription drug benefi t. In the following, we describe those features of Medicare Part D that are relevant for our subsequent analysis of consumer behavior in this market. More details on the Medicare Part D prescription drug benefi t can be found on the CMS website and in Bach and McClellan (2005).
Critical parameters in determining Standard plan benefi ts are the plan formulary, the benefi ciary’s annual pharmacy bill for drugs in the plan for-mulary, the benefi ciary’s true out- of- pocket (TrOOP) payments for these covered drugs and threshold for catastrophic coverage, and the average monthly premium. In the benefi ts formula, expenditures for drugs not in the plan formulary are not counted in the pharmacy bill or in TrOOP payments. Part D premiums are also excluded from TrOOP payments. The Standard Medicare Part D plan had the following benefi t schedule in 2006:
• The benefi ciary has an annual deductible of $250.
• The benefi ciary pays 25 percent of drug costs above $250 and up to $2,250. The TrOOP payment is then $750 for a benefi ciary whose phar-macy bill has reached $2,250.
• The benefi ciary pays 100 percent of drug costs above $2,250 and up to a TrOOP payment of $3,600; this is referred to as the coverage gap or doughnut hole. The TrOOP threshold of $3,600 is attained at a drug bill of $5,100.
• The benefi ciary pays 5 percent of drug costs above a drug cost threshold of $5,100 at which the TrOOP threshold level is achieved; this is referred to as catastrophic coverage.
Standard plan coverage in 2007, 2008, and 2009 has the same structure, with parameters being adjusted annually to refl ect market base premiums and infl ation in drug prices. The combined effect of three annual adjust-ments can be seen in fi gure 5.1, which depicts the benefi t schedules for 2006 and 2009.
Heiss, McFadden, and Winter (2010) provide a calculation of the actu-arial value of Standard Plan benefi ts, based on a projection by CMS in 2005, the year prior to the introduction of Part D, of the distribution of 2006 drug costs for the full Medicare- eligible population. This calculation shows that the 2006 expected drug cost in this population was $245.03 per month. If enrollment in the Part D Standard Plan had been universal, the expected benefi t would have been $128.02 per month, or $91.13 net of the monthly average premium of $37 anticipated in 2005, and the expected TrOOP cost would have been $117.01 per month. The actual monthly average premium of $32.20 in 2006 was lower than anticipated; this may have been the result
of lower drug costs arising from pharmacy benefi t management and drug price negotiations by sponsors. Monthly premiums vary with plan sponsor and area, but a national average premium determined by CMS (and used in determining its subsidy) is a publicly available indicator of plan cost to benefi ciaries.
The Medicare Part D plans sponsored by private insurance fi rms may differ from the Standard Plan in their premiums and other plan features, provided that their benefi ts for any drug cost are on average at least as high as those of the Standard Plan. Enhancements may include coverage for the deductible and for the gap in the Standard Plan. The CMS classifi es the stand- alone prescription plans that are available under Medicare Part D in four categories (see Bach and McClellan 2006, 2313). The “standard benefi t” is a plan with the statutorily defi ned coverage, deductible, gap, and cost shar-ing. An “actuarially equivalent” plan is one that has the same deductible and gap as the Standard Plan, but has different cost sharing (such as copay-ment tiers for preferred drugs and generic drugs rather than a percentage copayment). Actuarial equivalence to the Standard Plan may be achieved through restrictions in plan formularies, but all approved plans must have Fig. 5.1 Benefi t schedule of the Medicare Part D Standard Plan
formularies that include at least two drugs in each therapeutic category. A “basic alternative” plan is actuarially equivalent to the statutorily defi ned benefi t, but both the deductible and cost sharing can be altered. (Most of these plans have no deductible.) Finally, an “enhanced alternative” plan exceeds the defi ned standard coverage—for example, by offering coverage in the gap for generic drugs only, or both generic and branded drugs.
One important feature of Medicare Part D is the penalty for late enroll-ment. Individuals who enroll after May 15, 2006 and do not have creditable coverage from another source face a late enrollment penalty fee of 1 percent a month for every month that they wait to join. The penalty is computed based on the average monthly premium of Part D standard plans in a given year. This rule was put in place to reduce adverse selection. As the analysis of an intertemporal discrete choice model by Heiss, McFadden, and Winter (2010, 2009) shows, the late- enrollment penalty provides a strong monetary incentive for eligible consumers to enroll in 2006 (or more generally, when they fi rst become eligible for Medicare) rather than wait to join only later, should health problems develop and drug costs rise.
The evolution of plan supply in this market is of interest in its own right. Official CMS data allow us to classify all Part D plans that have been offered from 2006 through 2009 into four types (defi ned differently from the official classifi cation discussed earlier): Standard Plans, plans without deductible (but with a coverage gap), and enhanced plans with gap coverage, either only for generics or for both brand- name drugs and generics. Figure 5.2 shows that while average premiums of plans without gap coverage have remained relatively stable, premiums for plans with gap coverage have increased sub-stantially. The market for the most generous plans with coverage for at least some brand- name drugs in the gap has all but collapsed within the fi rst three years. By 2007, almost half of such plans that had been offered in 2006 had disappeared and the remaining half had dramatically higher average pre-miums. In 2008, no such plan was offered, and in 2009 there is only one. A plausible interpretation is that sponsors have underestimated the costs of providing a generous plan; for example, due to adverse selection. This issue is investigated further in ongoing parallel research (Heiss, McFadden, and Winter 2009).
The new Medicare Part D prescription drug benefi t has received consid-erable attention in the literature. We do not attempt to provide a compre-hensive review of the literature but refer the reader to the paper by Duggan, Healy, and Morton (2008) for a discussion of the Part D drug benefi t and the research programs it has generated. In the remainder of this section, we review selected recent papers directly related to the present chapter.
Levy and Weir (2008, 2010) use data from the 2004 and 2006 waves of the Health and Retirement Study (HRS) to estimate the extent of adverse selection into Part D and the impact of Part D on medication use and of- pocket spending. They conclude that there was substantial selection into
Part D. Among Medicare benefi ciaries with no drug coverage in 2004, those with high use and/or spending in 2004 were most likely to be enrolled in Part D in 2006. Many of those who remained without coverage in 2006 reported that they did not use prescription drugs, and the majority had relatively low out- of- pocket spending. In line with the fi ndings by Heiss, McFadden, and Winter (2010), Levy and Weir (2010) conclude that Medicare benefi ciaries seem to have been able to make economically rational decisions about Part D enrollment (not necessarily plan choice) despite the complexity of the pro-gram. Further, Levy and Weir report that the use of prescription drugs did not change dramatically in response to Medicare Part D. Neither does Part D appear to have reduced the extent of cost- related noncompliance among those who previously had no drug coverage. Levy and Weir conclude that the Part D program has experienced adverse selection but not moral hazard.
Lichtenberg and Sun (2007) also investigate the effect of Medicare Part D on prescription drug use and out- of- pocket costs of eligible seniors. Using Fig. 5.2 Average premiums of Medicare Part D plans, by type
Source: CMS data (2005–2009 Excel fi les containing the characteristics of Medicare Part D
data on prescription fi lled by a large retail pharmacy chain during the period September 2004 to December 2006, they estimate that Medicare Part D reduced user cost among the elderly by 18.4 percent, increased their use of prescription drugs by about 12.8 percent, and increased total U.S. usage by 4.5 percent in 2006. Lichtenberg and Sun estimate that every seven prescrip-tions paid for by the government crowded out fi ve other prescripprescrip-tions and resulted in only two additional prescriptions used. Yin et al. (2008) also conclude that the Medicare Part D prescription benefi t resulted in modest increases in average drug utilization and decreases in average out- of- pocket expenditures among Part D benefi ciaries. Using data from a random sample of pharmacy customers who were benefi ciaries of the program after the enrollment deadline, they estimate that the drug benefi t saved benefi ciaries about nine dollars a month and gave them an extra fourteen days of pills, on average.
Two recent studies investigate the enrollment and plan choices of Medi-care Part D- eligible individuals in more detail. Abaluck and Gruber (2009) evaluate the choices of elders across the wide array of Part D options using a data set of prescription drug claims matched to information on the char-acteristics of choice sets. They document that the vast majority of elders are choosing plans that are not on the “efficient portfolio” of plan choice in the sense that an alternative plan would have offered better risk protection at a lower cost. Their analysis suggests that individuals place much more weight on current plan premiums than on expected out- of- pocket costs. Further, individuals appear to place almost no value on variance reduction.
Kling et al. (2008) investigate suboptimal plan choice from another view-point; their analysis is motivated by recent models of individual mispercep-tion of prices. They present results from a randomized experiment conducted in the open- enrollment period at the end of 2006, which gave individuals an opportunity to switch plans. One group of seniors enrolled in Medicare drug plans was presented personalized information on the potential cost savings from changing to the lowest cost plan while another group received informa-tion about how to access the Medicare website, where this same informainforma-tion was available. The intervention group plan- switching rate was 28 percent, while the comparison group rate was 17 percent. Average predicted costs for 2007 were lower for the intervention group as a whole and lower for those potentially affected by the intervention.
Also related to the issue of whether consumers can make well- informed choices among a large number of plans available to them, Lucarelli, Prince, and Simon (2008) study the welfare impacts of limiting the number of Part D plans based on a joint estimation of plan supply and demand. They assess the effects on equilibrium premiums and welfare of reducing prod-uct differentiation and of reducing the maximum number of plans each fi rm can offer. Lucarelli and colleagues fi nd that implied search costs would have to be at least two- thirds of the average monthly premium in order to
5.3 The Retirement Perspectives Survey, 2005 to 2009
The Retirement Perspectives Survey is a research project conducted by the authors to study the feasibility of using Internet survey designs in elderly populations, and using treatments embedded in surveys to detect and miti-gate survey response errors. Beginning in 2005, the continuing methodolog-ical research objectives have been combined with a substantive focus on consumer choices and experience in the Medicare Part D prescription drug program. Results from the fi rst three waves of the Retirement Perspectives Study have been reported in a series of papers (Winter et al. 2006; Heiss, McFadden, and Winter 2006, 2009, 2010, McFadden, Winter, and Heiss 2008).
The four waves of the Retirement Perspectives Survey in 2005, 2006, 2007, and 2009 used a panel of individuals maintained by Knowledge Networks (KN), a commercial survey fi rm. The members of the KN Panel are enrolled using random- digit- dialing sampling to obtain a pool that is representative of the U.S. noninstitutionalized population in terms of demographics and socioeconomic status. Participants are provided with web TV hardware to respond to periodic survey elicitations with content from both commercial and academic clients. The KN Panel members are compensated for par-ticipation. The RPS respondents are somewhat younger, more educated, healthier, and computer- literate than the underlying population. For ex-ample, about half the panel members use the Internet, compared with about a third in the corresponding population. Sample weighting is used to adjust for attrition in the recruitment and retention process, and for nonresponse to specifi c surveys. For a detailed discussion of representativeness of the RPS sample and weighting procedures, we refer to Heiss, McFadden, and Winter (2010).
The fi rst wave of our study, RPS- 2005, was conducted in November 2005, just before the initial enrollment period for the new Medicare Part D prescription drug benefi t began. This survey focused on prescription drug use and intentions to enroll in the new Medicare Part D program. Addi-tional questions concerned long- term care, and a sequence of questions was designed to obtain simple measures of respondents’ risk attitudes. In May 2006, after the initial enrollment period had ended, we administered the second wave (RPS- 2006). For this survey, we recontacted the Medi-care eligible respondents of RPS- 2005 and elicited their prescription drug insurance status as well as their Part D decisions, including plan choice. The RPS- 2007 and RPS- 2009 were conducted in March/April 2007 and
February/March 2009, respectively; their samples consisted of reinterviewed respondents of earlier RPS waves plus refreshment cases. The four RPS interviews required between twenty- fi ve and forty minutes for completion, with variations due to variations in the length of the questionnaire. Most socioeconomic and demographic variables were provided by Knowledge Networks as background on panel members, and were not requested again in the RPS questionnaires.
In table 5.1, we report sample sizes and participation rates for the various RPS waves and segments. Participation rates from the KN panel were gener-ally rather high. For the fi rst wave (RPS- 2005), we contacted almost 6,000 KN Panel members aged fi fty and older, and 80.6 percent of those invited to participate completed the questionnaire. For RPS- 2006, we contacted only KN members who had completed RPS- 2005 and were aged sixty- three years or older at the time of the interview (or in a few cases were younger but already on Medicare). The participation rate was again rather high at 82.3 percent. For RPS- 2007 two groups were contacted: reinterviews of earlier RPS respondents (i.e., those who had completed either RPS- 2005 only or both RPS- 2005 and RPS- 2006), and a refreshment sample of KN Panel members who had not participated in any prior RPS wave. The par-ticipation rate among these groups was the highest for those who had com-pleted both RPS- 2005 and RPS- 2006 (89.6 percent), and slightly below the other rates for those who had completed RPS- 2005 but missed RPS- 2006 (76.6 percent). The participation rate for the refreshment sample was 81.5 per-cent and thus well in line with that in the comparable RPS- 2005 sample.
For RPS- 2009 we again contacted all previous RPS respondents and a refreshment sample. Since individuals remain on the KN Panel only for a limited time, the number of earlier RPS respondents that were successfully recontacted was relatively small. As consequence, only a fraction of respon-dents who were interviewed for RPS- 2005 also completed all three subse-quent interviews. Of the 2,119 RPS- 2005 respondents aged sixty- four and older at the time of that interview, 710 (or 33.5 percent) completed all three subsequent interviews; 702 (or 33.1 percent) participated in 2006 and 2007, but not in 2009; 232 (11.0 percent) did not participate in any subsequent interview; and the remaining respondents have holes in their participation pattern over time. Response rates in 2009 were substantially lower than in earlier years, even in the refresher sample, which may indicate that public interest in Medicare Part D has declined relative to earlier years.
These numbers highlight the fact that Internet panels such as the KN Panel are not ideally suited for conducting panel studies over longer time periods since they are not built and administered with the aim of retaining respondents for periods of several years. In private correspondence, KN indicated that among those respondents who were still active in the KN Panel, participation rates achieved for the RPS interviews were higher than those typically observed in other studies that use the KN Panel. The KN
T
able 5.1
Sample selection criteria and r
esponse r ates f or the f our RPS w a ves RPS- 2005 RPS- 2006 RPS- 2007 RPS- 2009
Age selection rule
50 63 a 64 64 Subsamples Subsamples Completed RPS- 2005 Y es b Y es Y es No Y es Y es Completed RPS- 2006 Y es No No Y es No Completed RPS- 2007 Ye s Ye s KN members contacted 5,879 2,598 1,704 217 1,250 3,171 1,151 127 Completed intervie ws 4,738 2,137 1,526 165 1,020 2,711 783 77 R esponse r a te c 80.6% 82.3% 89.6% 76.0% 81.6% 85.5% 68.0% 60.6% 67.7% aIn ad dition, RPS- 2005 r espondents y
ounger than sixty-
thr ee y ears w er e contacted f or RPS- 2006 if
they said tha
t they ar e on M bCompletion of RPS- 2005 w as r equir ed f or this subsample . cThe r esponse r a te is defi ned as the n umber of completed intervie ws as a pr oportion of the n umber of KN P
3. We excluded a small number of observations from the analysis samples that had inconsis-tencies in key demographic variables.
4. In this chapter, the terms “current drug use” and “drug use in the previous year” are used interchangeably. When we consider enrollment in Medicare Part D for a given year, “current drug use” refers to drug use in the year when the enrollment decision was made (i.e., the “pre-vious year”).
attributed this to the highly topical subject of the RPS study. However, high participation rates conditional on still being in the panel cannot compen-sate for attrition from the panel. Attrition that is selective with respect to observed or unobserved variables would exacerbate these problems.
Table 5.2 contains a comparison of the distributions of key demographic characteristics in the Health and Retirement Study (HRS) 2006 and our analysis samples. For the three interviews in which we observe Medicare Part D enrollment and plan choices (i.e., the 2006, 2007, and 2009 inter-views), we defi ne the analysis samples as containing all RPS respondents aged sixty- fi ve or older at the time of the 2006 interview (or at the time of their fi rst interview if they entered the sample in 2007 or 2009 as members of the refreshment sample).3 Despite the rather complicated structure of the overall RPS panel, the three analysis samples line up well with the HRS sample in terms of these key demographic characteristics; application of the sample weights supplied by Knowledge Networks tends to reduce any differences further. In our subsequent multivariate analysis, we do not use weights; see McFadden et al. (2006) for a discussion.
In our empirical analysis of enrollment decisions and plan choice, we consider the following groups of explanatory variables: socioeconomic char-acteristics supplied by Knowledge Networks as background variables (age, sex, race, education, and income); measures of current self- rated health status (SRHS) and drug use; and measures of decision- making competence, planning horizon, and attitudes toward risk. We describe these explana-tory variables in the remainder of this section. Descriptive statistics are reported in the next section. The dependent variables are also described in section 5.4.
Age, sex, race, and education are naturally defi ned. The only income vari-able that is availvari-able as part of the KN background varivari-ables is total (gross) household income. The KN background data do not contain a measure of wealth.
Current health status is measured using the standard question on rated health status as used in the HRS and many other surveys: “How would you describe your current health?” with fi ve response options (excellent, very good, good, fair, poor).
Our measure of current drug use4 is based on the question, “How many different prescription drugs did you use last year in total (not counting mul-tiple refi lls)?” We also asked respondents whether they expect their drug use to change: “How do you think the number of prescription drugs that you
T able 5.2 Socioeconomic char acteristics, HRS 2006 vs. RPS 2006/2007/2009 HRS 2006 RPS- 2006 RPS- 2007 Unw eighted (%) W eighted (%) Unw eighted (%) W eighted (%) Unw eighted (%) W eighted (%) Gender F emale 57.3 56.8 55.8 57.2 55.2 57.2 Male 42.7 43.2 44.2 42.8 44.8 42.8 R ace W hite 83.5 89.3 87.6 83.3 87.0 82.4 Nonw hite 16.5 10.7 12.4 16.7 13.0 17.6 Age 61–70 35.8 33.7 39.3 35.9 40.5 36.4 71–80 40.3 41.6 46.9 47.9 45.5 45.9 81–90 20.4 22.0 12.9 15.1 13.2 16.8 90 3.5 2.7 0.9 1.1 0.9 0.9 Educa tion Less than HS 31.5 28.3 12.9 26.1 13.1 23.1 High school 32.6 33.4 41.5 36.5 39.0 37.3 Mor e than HS 36.0 38.4 45.6 37.5 47.9 39.6 Income $20K 33.2 31.2 23.4 28.9 21.9 26.2 $20K–$60K 46.2 46.9 58.2 52.6 57.9 53.0 $60K 20.6 21.9 18.4 18.5 20.2 20.8 SRHS Ex cellent 8.5 9.1 6.1 5.6 5.1 4.6 V ery good 26.3 27.5 32.2 27.8 30.4 27.9 Good 31.6 32.4 39.5 41.8 39.9 41.4 F air 23.3 22.2 18.1 19.8 19.9 20.8 P oor 10.3 8.8 4.0 4.9 4.4 5.2 Number of observ a tions 11,399 1,666 2,463 Notes:
The HRS comparison sample consists of
r espondents a ged sixty- fi v e or older a t the time of the HRS 2006 intervie w . The RPS anal of r espondents a ged sixty- fi v e or older a t the time of the RPS- 2006 intervie w (or f or panel r efr eshers , a t the time of their fi rst RPS intervie
dents with inconsistent demo
gr a phic inf or ma tion w er e also e x cluded fr om the anal ysis sample .
take on a regular basis will change over the next few years?” Three response options were provided (more, fewer, no change). In earlier RPS waves, we included a probabilistic measure of the subjective expectations with respect to drug use; this measure is not analyzed in this chapter. The RPS- 2005, 2007, and 2009 questionnaires contained a series of questions that allows us to impute the respondent’s total drug expenditure (evaluated at average pharmacy over- the- counter prices); we do not use this measure in the cur-rent version of this chapter (see Winter et al. [2006], and Heiss, McFadden, and Winter [2010], for detailed discussions).
In various RPS waves, we experimented with alternative measures of decision- making competence and preference variables. In the present chap-ter, we use the “Decision Making Competence” (DMC) scale developed by Bruine de Bruin, Parker, and Fischhoff (2007); an abbreviated version of that instrument was contained in the RPS- 2007 questionnaire. For our subsequent analysis, we generated a median- split dummy from the raw DMC measure.
We also use simple measures of the respondent’s planning horizon and risk attitudes that were contained in RPS- 2009 as explanatory variables. The question on the planning horizon was taken from HRS: “What is your most important period for planning saving and spending?” This question had closed response options (the next few months; the next year; the next few years; the next fi ve to ten years; more than ten years). We construct a dummy variable for responses that imply a planning horizon of more than one year.
The questions on risk attitudes were taken from the German Economic Panel; they have been used successfully to predict risk- related behavior in various domains (Dohmen et al. 2010). The fi rst question is: “How do you see yourself: Are you generally a person who is fully prepared to take risks or do you try to avoid taking risks?” This question is followed by a series of similar domain- specifi c questions; in RPS- 2009 we used the questions, “How prepared are you to take risks while driving?”, “. . . in fi nancial matters?”, and “. . . with your health?” All four questions had closed response options on an 11- point scale with extremes labeled as “fully prepared to take risks” and “risk averse.” For each measure, we construct a dummy variable for respondents who are prepared to take risks (i.e., who checked a response above the neutral response on the 11- point scale). 5.4 Analysis of Consumers’ Medicare Part D Decisions
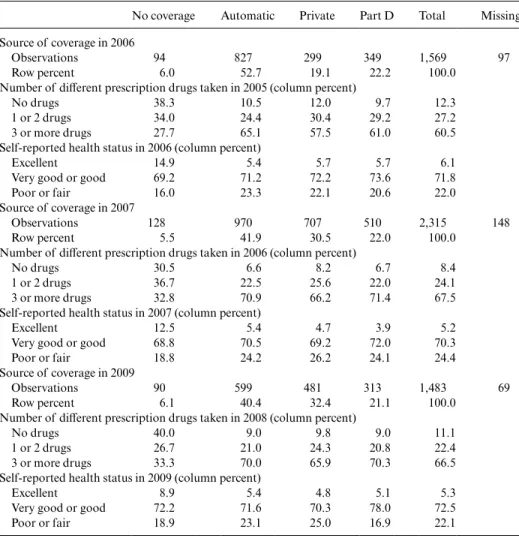
We begin by reviewing the sources of prescription drug coverage of the RPS respondents in 2006, 2007, and 2009. As noted before, the analysis sample contains respondents aged sixty- fi ve and older who are eligible for Medicare Part D; however, not all eligible individuals had to make an active enrollment decision because of existing coverage from other sources that is comparable to the Medicare Part D standard plan (or better).
with official enrollment fi gures provided by CMS. The top panel of table 5.3 replicates these fi gures; the bottom panels report comparable fi gures for 2007 and 2009. About 6 percent of eligible respondents remained without coverage in 2006; the numbers did not change much in 2007 and 2009. Note
Table 5.3 Prescription drug insurance status, drug use, and self- rated health
No coverage Automatic Private Part D Total Missing Source of coverage in 2006
Observations 94 827 299 349 1,569 97
Row percent 6.0 52.7 19.1 22.2 100.0
Number of different prescription drugs taken in 2005 (column percent)
No drugs 38.3 10.5 12.0 9.7 12.3
1 or 2 drugs 34.0 24.4 30.4 29.2 27.2
3 or more drugs 27.7 65.1 57.5 61.0 60.5
Self- reported health status in 2006 (column percent)
Excellent 14.9 5.4 5.7 5.7 6.1
Very good or good 69.2 71.2 72.2 73.6 71.8
Poor or fair 16.0 23.3 22.1 20.6 22.0
Source of coverage in 2007
Observations 128 970 707 510 2,315 148
Row percent 5.5 41.9 30.5 22.0 100.0
Number of different prescription drugs taken in 2006 (column percent)
No drugs 30.5 6.6 8.2 6.7 8.4
1 or 2 drugs 36.7 22.5 25.6 22.0 24.1
3 or more drugs 32.8 70.9 66.2 71.4 67.5
Self- reported health status in 2007 (column percent)
Excellent 12.5 5.4 4.7 3.9 5.2
Very good or good 68.8 70.5 69.2 72.0 70.3
Poor or fair 18.8 24.2 26.2 24.1 24.4
Source of coverage in 2009
Observations 90 599 481 313 1,483 69
Row percent 6.1 40.4 32.4 21.1 100.0
Number of different prescription drugs taken in 2008 (column percent)
No drugs 40.0 9.0 9.8 9.0 11.1
1 or 2 drugs 26.7 21.0 24.3 20.8 22.4
3 or more drugs 33.3 70.0 65.9 70.3 66.5
Self- reported health status in 2009 (column percent)
Excellent 8.9 5.4 4.8 5.1 5.3
Very good or good 72.2 71.6 70.3 78.0 72.5
Poor or fair 18.9 23.1 25.0 16.9 22.1
Notes: “Private” includes prescription drug coverage as part of a Medicare Advantage program. “Part
also that the rates of item nonresponse on this key question were low in all three surveys (6 percent or less).
Table 5.3 also confi rms our earlier fi nding of a strong association of pre-scription drug coverage and measures of current health. In all three RPS waves, respondents who take three or more prescription drugs on a regular basis are much more likely to have stand- alone Part D coverage than those who take fewer drugs. Similarly, respondents whose self- rated health is “excellent” are less likely to have stand- alone coverage. (We confi rm these associations in multivariate regressions reported following). Finally, while table 5.3 shows some stability in responses over time, there are also some variations. For instance, the fractions of “automatic” and “private” coverage change from 2006 to 2007 but are similar in 2007 and 2009. The fractions of “no coverage” and “stand- alone Part D coverage” do not change over time.
Table 5.4 reports descriptive statistics for our explanatory variables. We have converted all variables into dummy variables; the left out categories are naturally defi ned. We chose to do this to ease interpretation of the regres-sion results; we report the coefficients of logistic regressions as log- odds ratios. Also, the information loss from converting the age variable into a three- category measure turned out to be small, and the only other continu-ous variable, hcontinu-ousehold income, may suffer from measurement error so that
Table 5.4 Means of covariates used in reduced- form regressions
RPS- 2006 RPS- 2007 RPS- 2009
Obs Mean Obs Mean Obs Mean
Female 1,666 0.56 2,463 0.55 1,552 0.55
Nonwhite 1,666 0.12 2,463 0.13 1,552 0.16
Education: Less than high school 1,666 0.13 2,463 0.13 1,552 0.13
Education: More than high school 1,666 0.46 2,463 0.48 1,552 0.51
Age 70 and younger 1,666 0.47 2,463 0.46 1,552 0.46
Age 81 and older 1,666 0.14 2,463 0.14 1,552 0.12
Income $20K 1,666 0.23 2,463 0.22 1,552 0.15 Income $60K 1,666 0.18 2,463 0.20 1,552 0.31 SRHS excellent 1,666 0.22 2,463 0.24 1,552 0.22 SRHS poor or fair 1,666 0.06 2,463 0.05 1,552 0.05 1 or 2 drugs 1,666 0.27 2,463 0.25 1,552 0.22 3 or more drugs 1,666 0.60 2,463 0.66 1,552 0.66
Expects to use more drugs 2,431 0.15 1,538 0.16
DMC scale above median 2,362 0.50
Planning horizon longer than one year 1,521 0.50
Prepared to take risks (general) 1,539 0.64
Prepared to take risks (health) 1,539 0.27
Prepared to take risks (fi nancial) 1,542 0.42
using a median split is a conservative approach. As can be seen from table 5.4, rates of item nonresponse are small for the covariates, even for the subjective measures.
In table 5.5, we begin our analysis with a reduced- form regression of whether an eligible respondent has prescription drug coverage from any source. The dependent variable is based on the direct question described earlier. We report a baseline specifi cation with socioeconomic and health variables for 2006, 2007, and 2009; for 2007 and 2009 we also report speci-fi cations that add our measure of an expected increase in drug use (which, as we hasten to add, may be endogenous) and either the decision- making
Female 0.5984∗∗ 0.9473 0.9595 1.1919 1.0972
Nonwhite 1.9583 2.3541∗∗ 2.4266∗∗ 1.8430 2.0211
Education: Less than
high school 0.4654∗∗ 0.8546 0.9618 0.7101 0.776
Education: More than
high school 1.1794 1.1494 1.145 0.8949 0.8862
Age 70 and younger 0.6480∗ 0.7182 0.6453∗ 0.5761∗∗ 0.6047∗
Age 81 and older 1.2025 0.5948∗ 0.5610∗ 0.5440∗ 0.5368∗
Income $20K 1.4487 0.8838 0.8846 0.9630 1.0291 Income $60K 2.0077∗ 1.7923∗ 1.8392∗ 2.0905∗∗ 1.9667∗∗ SRHS excellent 0.9375 0.7776 0.831 0.8151 0.7129 SRHS poor or fair 0.5148∗ 0.5806∗ 0.5453∗ 1.0218 0.8206 1 or 2 drugs 2.8892∗∗∗ 2.8905∗∗∗ 2.9519∗∗∗ 3.8979∗∗∗ 3.7165∗∗∗ 3 or more drugs 8.3483∗∗∗ 10.110∗∗∗ 10.478∗∗∗ 10.812∗∗∗ 9.8519∗∗∗ Expects to use more
drugs 1.3576 1.3745
DMC scale above
median 1.2753
Planning horizon
longer than one year 1.4572
Prepared to take risks
(general) 0.9339
Prepared to take risks
(health) 0.9005
Prepared to take risks
(fi nancial) 1.1251
Constant 6.4693∗∗∗ 4.4951∗∗∗ 3.8892∗∗∗ 3.7363∗∗∗ 3.4718∗∗∗
Observations 1,569 2,315 2,204 1,483 1,425
Notes: All variables are defi ned as dummy variables. Coefficients are reported as odds ratios.
∗∗∗Signifi cant at the 1 percent level.
∗∗Signifi cant at the 5 percent level.
measure based on the DMC scale (2007 only) or the planning horizon and risk attitude measures (2009 only). The most striking result is that the num-ber of drugs used in the previous year has the strongest effect as a predictor of drug coverage. Some socioeconomic variables are signifi cant; the result that nonwhites were more likely to have coverage in 2007 is curious. Less surprising is the result that high- income respondents are more likely to have coverage—many of them have existing coverage via their (current or former) employer’s health insurance.
The structure of table 5.6 is identical to that of table 5.5. The sample is
Table 5.6 Logit regressions—Part D prescription drug coverage (active deciders)
Mean of dependent variable RPS- 2006 RPS- 2007 RPS- 2009 0.788 0.799 0.802 0.777 0.788 Female 0.7423 1.2741 1.3556 1.6853∗ 1.8143∗ Nonwhite 1.2946 1.1643 1.2841 0.8646 1.0234 Education: Less
than high school 0.4725∗∗ 0.7163 0.8406 0.8054 0.8570
Education: More
than high school 1.1958 0.9256 0.9069 0.8332 0.7979
Age 70 and younger 0.4930∗∗ 0.7624 0.6657 0.6053 0.6031
Age 81 and older 1.0496 0.5449∗ 0.5399∗ 0.6577 0.7404
Income $20K 1.6273 0.8746 0.8741 0.8810 0.9351 Income $60K 1.5748 1.3768 1.4373 1.4639 1.2535 SRHS excellent 0.7197 0.6815 0.7585 0.5608 0.5774 SRHS poor or fair 0.5034 0.4723∗ 0.4514∗ 1.3835 1.1077 1 or 2 drugs 3.3766∗∗∗ 2.7943∗∗∗ 2.7018∗∗∗ 3.7034∗∗∗ 3.5037∗∗∗ 3 or more drugs 9.1045∗∗∗ 10.981∗∗∗ 10.774∗∗∗ 11.823∗∗∗ 11.699∗∗∗ Expects to use more
drugs 1.8346∗ 1.4768
DMC scale above
median 1.3002
Planning horizon longer than one
year 2.4231∗∗∗ Prepared to take risks (general) 1.0581 Prepared to take risks (health) 1.0209 Prepared to take
risks (fi nancial) 1.0261
Constant 1.5404 1.0856 0.8869 0.7989 0.467
Observations 443 638 605 403 387
Notes: All variables are defi ned as dummy variables. Coefficients are reported as odds ratios.
∗∗∗Signifi cant at the 1 percent level.
∗∗Signifi cant at the 5 percent level.
want to test whether the additional “soft” variables obtained in those years have predictive power. As in table 5.5, current drug use remains a strong predictor of Part D coverage among the active deciders. Socioeconomic variables have little predictive power (as we reported in Heiss, McFadden, and Winter [2010]). Expecting to use more drugs has some predictive power in 2007; the planning horizon variable is signifi cant and relatively strong in 2009. Measures of risk attitudes and decision- making competence are not signifi cant in these regressions. This is somewhat surprising since these mea-sures had predictive power for economic decisions in other studies; one rea-son for the lack of signifi cance may be the relatively small sample of active deciders. In any case, these results confi rm what we and others have found in other studies: current drug use is the strongest predictor of Medicare Part D enrollment among active deciders.
Also for active deciders, we looked at potential determinants of plan switching. This was fi rst possible at the end of 2006 for 2007. Table 5.7 therefore reports results from RPS- 2007 and 2009. The dependent variable is based on a direct question of whether the respondent was enrolled in the same stand- alone Part D plan in the previous year. The fraction of switchers was slightly below 14 percent in 2006 (for 2007) and close to 18 percent in 2008 (for 2009). The regressions show no variable with strong effects other than being nonwhite in the 2009 data. At this level of analysis, we cannot explain plan switching well with a small set of sociodemographic and health variables. The additional “soft” variables obtained in 2007 and 2009 also show no clear pattern.
Finally, we investigate plan type choice. Specifi cally, the dependent vari-able in the following set of regressions is whether a prescription drug plan has coverage in the gap (in most cases, this will be for generic drugs). We con-structed this variable using the responses to a direct question that was asked to all respondents with prescription drug coverage from any source. Table 5.8, panel A, reports results for all these respondents, panel B only for active deciders. When we look at all respondents with coverage, the coefficients of the income variables suggest that the probability of having gap cover-age increases with income. Using (more) drugs also increases the probabil-ity of having gap coverage. Females are less likely to have gap coverage, and nonwhites are more likely. These fi ndings are in line with the fact that many of those with “automatic” enrollment (say, via their employer’s health insurance) have gap coverage. When we look only at the active deciders, the coefficients of the income variable change—in this sample, respondents with lower incomes are more likely to have gap coverage (even though we control
for current drug use). As before, our measures of decision- making compe-tence, planning horizon, and risk attitudes are not statistically signifi cant as predictors of having gap coverage.
5.5 Conclusions
In this chapter, we investigated how older Americans made their deci-sions in the enrollment periods for the fi rst four years of the new Medicare Part D prescription drug benefi t. We analyzed data from four waves of the Retirement Perspectives Survey (RPS), which we designed specifi cally to obtain information on older Americans’ health status and expenditures, their preferences, and their prescription drug insurance choices before and after the introduction of Medicare Part D. The main purpose of our anal-ysis was to understand how consumers react to the economic incentives embedded in Medicare Part D. This is an important research question that goes far beyond the more pressing public policy issue of how successful the program was in terms of its stated goals. It is our view that understanding
Table 5.7 Logit regressions—Part D plan switching (active deciders)
Mean of dependent variable
RPS 2007 RPS 2009
0.134 0.139 0.176 0.177
Female 0.9653 0.964 0.7462 0.7289
Nonwhite 0.6612 0.6299 5.6205∗∗∗ 5.6288∗∗∗
Education: Less than high school 1.0573 0.8166 0.5216 0.352
Education: More than high school 1.7903∗ 1.9129∗ 1.6731 1.7942
Age 70 and younger 1.3526 1.3948 0.6827
Age 81 and older 0.7543 0.6261 0.6609 0.928
Income $20K 0.5608 0.5865 0.9666 1.0872 Income $60K 0.7111 0.6777 1.1222 1.1166 SRHS excellent 1.0965 1.1787 0.6608 0.7002 SRHS poor or fair 2.5675 2.5594 0.2448 0.2541 1 or 2 drugs 1.0739 1.1181 6.6095∗ 5.4491∗ 3 or more drugs 2.0942 1.8233 5.1503∗ 5.0242∗
Expects to use more drugs 0.3094∗∗ 0.6447
DMC scale above median 1.1352
Planning horizon longer than one year 1.184
Prepared to take risks (general) 0.3183∗
Prepared to take risks (health) 1.9755
Prepared to take risks (fi nancial) 1.4737
Constant 0.0699∗∗∗ 0.0864∗∗∗ 0.0433∗∗∗ 0.0472∗∗∗
Observations 418 395 250 243
Notes: All variables are defi ned as dummy variables. Coefficients are reported as odds ratios.
∗∗∗Signifi cant at the 1 percent level.
∗∗Signifi cant at the 5 percent level.
Education: Less than high school 1.0955 1.0831 0.9665 0.9835 Education: More than high school 1.1938∗ 1.2226∗∗ 0.8756 0.915
Age 70 and younger 0.9639 0.9419 0.931 0.9215
Age 81 and older 0.7334∗∗ 0.7269∗∗ 1.148 1.1382
Income $20K 0.7466∗∗∗ 0.7752∗∗ 0.9331 0.9487 Income $60K 1.3480∗∗∗ 1.3479∗∗ 1.3808∗∗ 1.3555∗∗ SRHS excellent 0.8367∗ 0.8605 0.9532 0.974 SRHS poor or fair 0.8296 0.8566 1.4683 1.4628 1 or 2 drugs 1.5620∗∗ 1.4120∗ 1.4679∗ 1.4927∗ 3 or more drugs 1.5502∗∗ 1.3919∗ 1.5461∗∗ 1.5438∗∗
Expects to use more drugs 0.7493∗∗ 1.0118
DMC scale above median 0.916
Planning horizon longer than one year 1.0325
Prepared to take risks (general) 0.9144
Prepared to take risks (health) 0.8631
Prepared to take risks (fi nancial) 0.9012
Constant 0.7399 0.88 0.5662∗∗ 0.6587
Observations 2,190 2,087 1,387 1,337
B Active deciders
Mean of dependent variable 0.125 0.124 0.107 0.108
Female 1.0534 1.0457 1.5672 1.5956
Nonwhite 1.834 1.5598 5.2845∗∗∗ 5.6204∗∗∗
Education: Less than high school 1.5386 1.5436 0.2610∗ 0.1645∗∗
Education: More than high school 1.0135 0.8863 0.3157∗∗∗ 0.3297∗∗∗
Age 70 and younger 0.9987 0.9325 0.6866 0.764
Age 81 and older 0.8468 0.7497 1.8317 1.8744
Income $20K 1.9645∗∗ 2.1019∗∗∗ 3.5823∗∗∗ 3.6767∗∗∗ Income $60K 1.2013 1.4106 1.4012 1.2763 SRHS excellent 0.7032 0.7854 0.6358 0.577 SRHS poor or fair 0.4223 0.4543 3.2805∗ 3.8187∗ 1 or 2 drugs 4.1067∗∗ 4.0492∗∗ 2.9162 2.3096 3 or more drugs 3.7745∗∗ 3.4656∗∗ 2.9982∗ 2.7202
Expects to use more drugs 0.5825 1.0072
DMC scale above median 0.8221
Planning horizon longer than one year 0.8805
Prepared to take risks (general) 1.0065
Prepared to take risks (health) 1.0999
Prepared to take risks (fi nancial) 0.6532
Constant 0.0319∗∗∗ 0.0414∗∗∗ 0.0339∗∗∗ 0.0440∗∗∗
Observations 638 605 403 387
Notes: All variables are defi ned as dummy variables. Coefficients are reported as odds ratios.
∗∗∗Signifi cant at the 1 percent level.
∗∗Signifi cant at the 5 percent level.
whether and how consumers react to economic incentives in complex health insurance markets is an important part of the process of optimally design-ing social insurance programs such as Medicare Part D. This chapter can be interpreted as a fi rst step in that direction.
Specifi cally, we asked whether eligible consumers without prescription drug coverage from other sources enrolled in Medicare Part D. Given the structure of the program, expected drug costs for the fi rst year should be by far the most important determinant of those decisions. Our analysis con-fi rmed this: enrollment seems to be driven strongly by the number of drugs used on a regular basis in 2005 (which should be a good predictor of 2006 drug use) and very little by other variables. This result is important since the introduction of Medicare Part D allows us to observe individual risk before any insurance decision: moral hazard cannot have affected drug use of those without coverage prior to the introduction of Medicare Part D. Our data therefore confi rm (adverse) selection into this insurance program. In earlier research, we found a similar result when we used an imputed measure of drug costs rather than the number of drugs (Heiss, McFadden, and Winter 2010). This chapter adds to our earlier work by using data from the RPS waves 2007 and 2009, which also contained measures of decision- making competence, planning horizon, and risk attitudes. When we added those measures to our reduced- form regressions, they had little additional predic-tive power, however.
The overall conclusion from the empirical analysis presented in this chap-ter is that consumers respond to the immediate incentives that are induced by their current health status and drug expenditures combined with the salient, widely publicized features of the Medicare Part D program. To the extent that our measures approximate subjective factors well, they seem to have little effect. This result is, however, subject to further scrutiny.
We end by mentioning directions for future research on Medicare Part D and on consumer- directed health care, and on insurance markets more generally. One issue that deserves more attention is whether consumers’ decisions are rational. We did not consider this issue in this chapter but refer to our earlier results (Heiss, McFadden, and Winter 2010) and on-going research (Heiss, McFadden, and Winter 2009). The latter paper takes into account the intertemporal aspects of the enrollment decision that arise because of the late enrollment penalty (and that may be exacerbated by psychological switching costs). In that paper, we model enrollment and plan choice in stylized environment as a discrete dynamic decision process and confront the predictions from our behavioral model with data on individual enrollment and plan choice from the fi rst three years of Medicare Part D. We view that more structural approach as complementary to the reduced- form analysis presented in this chapter.
Bach, P. B., and M. B. McClellan. 2005. A prescription of a modern Medicare pro-gram. New England Journal of Medicine 353: 2733–35.
———. 2006. The fi rst months of the prescription- drug benefi t: A CMS update. New England Journal of Medicine 354:2312–14.
Bruine de Bruin, W., A. M. Parker, and B. Fischhoff. 2007. Individual differences in adult decision- making competence (A- DMC). Journal of Personality and Social Psychology 92:938–56.
Buntin, M. B., C. Damberg, A. Haviland, K. Kapur, N. Lurie, R. McDevitt, and M. S. Marquis. 2006. Consumer- directed health care: Early evidence about effects on cost and quality. Health Affairs 25:w516–30.
Dohmen, T., A. Falk, D. Huffman, U. Sunde, J. Schupp, and G. Wagner. Individual risk attitudes: Measurement, determinants, and behavioral consequences. Journal of the European Economic Association (forthcoming).
Duggan, M., P. Healy, and F. S. Morton. 2008. Providing prescription drug coverage to the elderly: America’s experiment with Medicare Part D. Journal of Economic Perspectives 22 (4): 69–92.
Goldman, D. P., and G. F. Joyce. 2008. Medicare Part D: A successful start with room for improvement. Journal of the American Medical Association 299 (16): 1954–55.
Goodman, J. 2006. Consumer directed health care. Policy Brief 2006- PB- 20, Net-works Financial Institute, Indiana State University.
Gruber, J. 2008. Covering the uninsured in the U.S. NBER Working Paper no. 13758. Cambridge, MA: National Bureau of Economic Research, January.
Heiss, F., D. McFadden, and J. Winter. 2006. Who failed to enroll in Medicare Part D, and why? Early results. Health Affairs 25:w344–54.
———. 2009. Regulation of health insurance markets: Lessons from enrollment, plan choice, and adverse selection in Medicare Part D. NBER Working Paper no. 15392. Cambridge, MA: National Bureau of Economic Research, October. ———. 2010. Mind the gap! Consumer perceptions and choices of Medicare Part
D prescription drug plans. In Research fi ndings in the economics of aging, ed. D. A. Wise, 413–81. Chicago: University of Chicago Press.
Kling, J. R., S. Mullainathan, E. Shafi r, L. Vermeulen, and M. V. Wrobel. 2008. Misperceptions in choosing Medicare drug plans. Unpublished Manuscript. Levy, H., and D. Weir. 2008. The impact of Medicare Part D on drug utilization and
out-of-pocket spending: Evidence from the Health and Retirement Study. Unpub-lished Manuscript.
———. 2010. Take- up of Medicare Part D: Results from the Health and Retirement Study. Journal of Gerontology: Social Sciences 65B (4): 492–501.
Lichtenberg, F. R., and S. X. Sun. 2007. The impact of Medicare Part D on prescrip-tion drug use by the elderly. Health Affairs 26 (6): 1735–44.
Lucarelli, C., J. Prince, and K. I. Simon. 2008. Measuring welfare and the effects of regulation in a government- created market: The case of Medicare Part D plans. NBER Working Paper no. 14296. Cambridge, MA: National Bureau of Economic Research, September.
McFadden, D., F. Heiss, B. Jun, and J. Winter. 2006. On testing for independence in weighted contingency tables. Medium for Econometric Applications 14 (2): 11–18.
Amy Finkelstein is professor of economics at the Massachusetts Institute of Technology, and a research associate and codirector of the public economics program at the National Bureau of Economic Research.
McFadden, D., J. Winter, and F. Heiss. 2008. Consumer- directed health care: Can consumers look after themselves? Swiss Journal of Economics and Statistics 144 (3): 285–307.
Newhouse, J. P. 2004. Consumer- directed health plans and the RAND health insur-ance experiment. Health Affairs 23 (6): 107–13.
Winter, J., R. Balza, F. Caro, F. Heiss, B. Jun, R. Matzkin, and D. McFadden. 2006. Medicare prescription drug coverage: Consumer information and preferences. Proceedings of the National Academy of Sciences of the United States of America 103 (20): 7929–34.
Yin, W., A. Basu, J. X. Zhang, A. Rabbani, D. O. Meltzer, and G. C. Alexander. 2008. The effect of the Medicare Part D prescription benefi t on drug utilization and expenditures. Annals of Internal Medicine 148: 169–77.
Comment
Amy FinkelsteinThis is an excellent installment in a fruitful and fascinating line of ongoing work by this research team on the Medicare Part D program. This research program is motivated by two important and complementary goals. The fi rst is evaluating the impact of the introduction of Medicare Part D. This was arguably the largest single expansion in social insurance in the United States since 1965. It is therefore an extremely important program to understand in its own right. The second goal, however, goes beyond this important policy evaluation to use the introduction of Medicare Part D as a tool for gaining insight more generally in consumer responsiveness to the economic incen-tives in social insurance programs. I am going to confi ne my comments to the second goal, but of course the importance of the application makes the analysis and results all the more interesting.
The current chapter examines the determinants of individual enroll-ment decisions and plan choices. It examines in particular the role of past drug use, self- rated health, and measures of the individual’s time horizon (discount rate), risk attitudes, and decision- making competence. The main fi ndings are twofold. First, prior drug use is a strong (positive) predictor of both whether the individual enrolls and the comprehensiveness of the plan chosen. Second, the other factors examined do not seem to have much explanatory power.
These results are fascinating for several reasons. The fi rst fi nding—regard-ing the positive correlation between prior drug use and plan enrollment and comprehensiveness—provides clear evidence of a role for private infor-mation about risk type in infl uencing insurance decisions. Because adverse selection offers a canonical economic rationale for the existence of social