Productivity
Commission
Technical Paper
GTAP Summary in
Excel version 1.0:
samag3x3.zip
April 2007 Alexandra Strzelecki© COMMONWEALTH OF AUSTRALIA 2007
This work is subject to copyright. Apart from any use as permitted under the Copyright Act 1968, the work may be reproduced in whole or in part for study or training purposes, subject to the inclusion of an acknowledgment of the source. Reproduction for commercial use or sale requires prior written permission from the Attorney-General’s Department. Requests and inquiries concerning reproduction and rights should be addressed to the Commonwealth Copyright Administration, Attorney-General’s Department, Robert Garran Offices, National Circuit, Canberra ACT 2600.
Users free to reproduce this document
This publication is available in PDF format from the Productivity Commission website at www.pc.gov.au. If you require part or all of this publication in a different format, please contact Media and Publications (see below).
Publications Inquiries:
Media and Publications Productivity Commission
Locked Bag 2 Collins Street East Melbourne VIC 8003 Tel: (03) 9653 2244 Fax: (03) 9653 2303 Email: [email protected] General Inquiries: Tel: (03) 9653 2100 or (02) 6240 3200
An appropriate citation for this paper is:
Strzelecki, A. 2007, GTAP Summary in Excel version 1.0 – Program Documentation for samag3x3.zip, Productivity Commission Technical Paper, Melbourne, April.
The Productivity Commission
The Productivity Commission, an independent agency, is the Australian Government’s principal review and advisory body on microeconomic policy and regulation. It conducts public inquiries and research into a broad range of economic and social issues affecting the welfare of Australians.
The Commission’s independence is underpinned by an Act of Parliament. Its processes and outputs are open to public scrutiny and are driven by consideration for the wellbeing of the community as a whole.
Information on the Productivity Commission, its publications and its current work program can be found on the World Wide Web at www.pc.gov.au or by contacting Media and Publications on (03) 9653 2244.
GTAP SUMMARY IN EXCEL
III
Disclaimer and conditions of use
1. To the extent permitted by law, the Commonwealth of Australia, the Productivity Commission and GTAP (Global Trade Analysis Project at Purdue University, USA) (the Agencies) give no warranty of any type, either express or implied, for GTAP summary in Excel and its supporting databases (the Program), and any other material supplied with the Program.
2. To the extent permitted by law, the entire risk of loss, damage or unsatisfactory performance of the Program rests with any user (the User). In no event will the Agencies be liable for damages, including any general, special, incidental or consequential damages, arising out of the installation of the Program, any attempt to install the Program, the use of the Program, the inability to use the Program, the use of data obtained from the Program or the use of any documentation or other material accompanying the Program.
3. The numerical data and formulas contained in the Program are provided solely for the purpose of illustrating the capabilities of the GTAP summary in Excel framework. The Agencies give no warranty as to the accuracy, reliability, timeliness or other features of any data contained in the Program or data obtained from using the Program. The numerical data contained in the Program and the output of the Program should not be regarded as representative of any current GTAP data.
4. The User should rely on the User's own inquiries to determine the current release of GTAP data.
5. The words, including designations, used in the Program and documents accompanying the Program do not express or imply any opinion whatsoever on the part of the Agencies concerning the legal status of any country, territory, city, or area, or of its authorities or its government, or concerning the delimitation of its frontiers or boundaries.
6. The Program is made available to Users for their own use and may be provided or re-disseminated by them to another party. Users who re-disseminate the Program should include the disclaimer and conditions of use in its current form with the Program, and identify any modifications made by the user to the Program and Documentation.
7. The User may modify the Program. However, the Productivity Commission would appreciate being informed of any modifications made by the User and being offered the opportunity to add any extra data and modifications to its version of the Program. When making modifications of the Program available to the Commission, please also identify who created the material contained in the modifications.
GTAP SUMMARY IN EXCEL
1
GTAP Summary in Excel
version 1.0 — Program
Documentation for samag3x3.zip
1By Alexandra Strzelecki, Productivity Commission, Australia.
GTAP (Global Trade Analysis Project) is a global network of researchers and policymakers that conduct quantitative analysis of international policy issues. Due to its complexity, it is not easy to obtain a quick overview of the main characteristics of the GTAP database.
The ‘GTAP Summary Programs in Excel’ is a suite of programs designed to improve access to the GTAP database for non-GEMPACK users. It has been developed by the Productivity Commission, building on previous work by GTAP. It enables the generation of Excel workbooks containing a summary of each country’s economic statistics in individual worksheets.
It is hoped that improved access to a summary of the GTAP database will enable non-GTAP specialists to provide feedback on the database, thereby improving its quality.
This suite of programs produces 20 country-specific summaries of the GTAP database.2 The summaries consist of:
• a Social Accounting Matrix;
• 13 tables that describe key macroeconomic and aggregate industry
characteristics for each country; and
• 6 tables that describe bilateral trade flows of aggregated commodities.
1 The results reported here were obtained using the GTAP summary in Excel software (Strzelecki 2007).
2 The facility must be run five times to obtain a summary for all the countries included in the version 6 Data Base. The aggregated GTAP Data Base must have 10 commodities or less.
2 GTAP SUMMARY IN EXCEL
The system was designed to facilitate access to summarised GTAP data for non-GEMPACK users, and therefore facilitate checking the characteristics of the data included in the GTAP database.
The procedure is automated. It uses a combination of batch files, GEMPACK programs and Microsoft Excel Visual Basic macros. The system builds on two existing GEMPACK programs: SAM.tab and GTPVEW.tab.
• The program SAM.tab was developed by Vitaly Kharitonov and Terrie
Walmsley (Center for Global Trade Analysis, Purdue University). It was renamed SAM_GXL6.tab and extended by Alexandra Strzelecki (Productivity Commission, Australia) for the purpose of creating an Excel version of the Global Social Accounting Matrix.
• The program GTPVEW.tab was developed initially at the Center for Global
Trade Analysis, Purdue University. It was renamed GTAPVEWX.tab and extended by Alexandra Strzelecki (Productivity Commission, Australia) for the purpose of creating an Excel version of the GTAP VIEW summary matrices. The complete system is described in the remainder of this document.
1 Overview
This is a documentation file for a GEMPACK version of a program SAM_GXL6.tab that derives a Global Social Accounting Matrix from version 6 of the aggregated GTAP Data Base.3 The Global Social Accounting Matrix produced as a separate header for each region of interest is then copied into an Excel workbook and formatted using a Visual Basic macros file.
• SAM_GXL6.tab is a complement to: McDonald, Scott and Thierfelder, Karen
2004, Deriving a Global Social Accounting Matrix from GTAP version 5 data,
GTAP Technical paper 22, Center for Global Trade Analysis, Purdue University, https://www.gtap.agecon.purdue.edu/resources/res_display.asp?RecordID=1645. This is also a documentation file for a GEMPACK version of a program GTAPVEWX.tab that derives GTAP VIEW summary files from version 6 of the aggregated GTAP Data Base.4 The summary files produced as a separate header for each region of interest are then copied into an Excel workbook and formatted using a Visual Basic Macros file.
3 It will also be possible to use it with future versions of the GTAP Data Base.
4 For those familiar with the GTAPView program in RunGTAP, this is a slightly modified version of that file.
GTAP SUMMARY IN EXCEL
3
2
What is needed to run these programs
1. The program files are made available in a WinZip archive — samag3x3.zip. 2. A 3-commodity by 3-region aggregation of the GTAP 6 Data Base is provided
(Sets.har and Basedata.har). If the user wishes to change the aggregations in the files provided, a licensed version of the GTAP Data Base with the GTAPAgg program will be needed. The GTAPAgg program uses an input aggregation file like ag3gtap6.agg to produce the Sets.har and Basedata.har files.
3. All the sets required to use the two GEMPACK programs with a GTAP database are provided from five files (the table in section 5 provides a comprehensive list of all files needed to run the entire suite of programs).
(a) Sets.har — standard set file produced by the GTAPAgg program.
(b) Common.har — contains sets that are included in a Global Social Accounting Matrix no matter which aggregation is used.
(c) REG_SETI.har — specifies sets for a subset of regions of interest (up to 20). L IMPORTANT: The user can change these data (they need to be changed
if the aggregation or subset of regions of interest is changed), but the file must be structurally identical to the REG_SETI.har files provided and named REG_SETI.har.
L To modify the REG_SETI.har file, select the ‘Use advanced, editing
menu’ option under File in ViewHAR. Selecting this option provides more tools in the menu including ‘Edit’. Under ‘Edit’ you will see an option ‘change size’ which allows you to change the size of an array. New data can then be pasted into the array from Excel.
(d) REG_SET.xls — input Excel file that maps the names of the countries/regions of interest from short to long names. These are then used in the final Excel output files. Any changes to the REG_SETI.har file must be accompanied by equivalent changes to the REG_SET.xls file. The short
names must correspond to the header ‘H1’ in REG_SETI.har. Do NOT
change ‘Sheet2’ in this file.
3
How to use the programs
1. All files from the WinZip archive should be extracted to one directory. Files Basedata.har and sets.har created by the GTAPAgg program using an input aggregation file like ag3gtap6.agg should be copied into the same directory.
4 GTAP SUMMARY IN EXCEL
2. Run the DOS batch file GTAPSAMX.bat which selects TG executable file
sam_gxl6.exe and runs file sam6_xl.sti together with 20 regional SEEHAR.exe program input SEE_SX*.sti files.
– Running this .bat file produces a Global Social Accounting Matrix and a set of 21 CSV files. It creates one additional labelling CSV file from running SEEHAR.exe with SEE_LABS.sti.
L Depending on computer configuration, it takes 1–2 minutes to create
output files sam.har (about 26 Mb) and the file transferred to Excel, SAM6_XL.har, which is about 140 Kb for the full GTAP 6 Data Base. Unlike the full unaggregated matrix which occupies 300 Mb and does not fit into Excel, the size of 1.6 Mb does not cause it to open slowly in ViewHAR. The user must, however, have enough free space available before running the program.
L The structure of the file SAM6_XL.har may appear to be slightly different from the one produced by the GAMS program developed by McDonald and Thierfelder. The differences are related to the fact that GAMS does not carry zeros.
3. Then run the DOS batch file GTAPXV.bat which selects TG executable file gtapvewx.exe and runs file gtpvewx.sti, togetherwith 20 regional SEEHAR.exe program input SEE_MC*.sti files and 10-sector SEEHAR.exe program input SEE_BI*.sti files.
– Running this .bat file produces GTAP VIEW summary matrices and a set of 30 CSV files.
L Depending on computer configuration, it takes 2 minutes to create output
file GTPXVEW.har and a dummy output file GTPXTAX.har, which
together occupy about 274 Kb of disk space.
4. If using a different sectoral aggregation of the GTAP Data Base, then before performing step 5, the user should update COMM_AGG.xls. This can be done by copying the commodity/industry sector aggregation mapping part of the input
text file for aggregation (see ag3gtap6.agg)5 into a new file like
COMM_AGG.txt and then converting it into an Excel file, which must be called COMM_AGG.xls. An example of these files is provided in the WinZip archive. 5. The final step is to create the SAM matrix and summary tables in Excel. To do
this, the user must do the following.
– First, open the VBA files GTAP_SAMMAC.xls
GTAP SUMMARY IN EXCEL
5
– Second, begin opening a file in the directory that contains the input and output files, then cancel out of the opening process.
L The VBA programs save the Excel output files containing the summary
matrices to the folder specified by this process. If the user does not set up the directory in this way, the program will be unable to locate the input files.
– Finally, run Module 1 — by selecting Tools | macro | macros | run — first in GTAP_SAMMAC.xls.
L The programs run for approximately 1 minute and 2 minutes respectively. L If an error message arises, it is likely to be due to problems with the
GTAP input files created by the user. Please ensure that the REG_SETI.har and the REG_SET.xls files are consistent with the files produced by the GTAPAgg program (see point 3 in section 2).
L The hard-wired output files produced by these Visual Basic macros files are called GTAP_SAM_a1.xls and GTAP_VEWX_a1.xls. These should be saved with different names, otherwise they will be overwritten in subsequent runs.
– Repeat for GTAP_MAC.xls
4 Feedback
Comments and suggestions about this documentation and/or the program suite are welcome. They can be forwarded to the author of this paper:
Alexandra Strzelecki, Productivity Commission, Locked Bag 2,
Collins Street East Post Office Melbourne, Vic, Australia, 8003. E-mail: [email protected]
6 GTAP SUMMARY IN EXCEL
5
List of files
REQUIRED
ag3gtap6.agg Input to GTAPAgg program facility which
aggregates the full database in accordance with the aggregation specified in the .agg file
GTAPsamx.bat Batch file to run SAM extraction program
Sam_gxl6.tab SAM extraction GEMPACK files
Sam_gxl6.exe Sam_gxl6.axs Sam_gxl6.axt
Sam6_xl.sti Runs SAM extraction program
Common.har Input required by SAM extraction program
GTAP_SAMMAC.xls Visual basic file for running SAM extraction
program
Gtapxv.bat Batch file to run GTAPView
Gtapvewx.tab GTAP View GEMPACK files
Gtapvewx.exe Gtapvewx.axs Gtapvewx.axt
Gtapvewx.sti Calls GTAPView cmf file to run GTAPView
Gtapvewx.cmf CMF file for running GTAPView
GTAP_MAC.xls Visual basic file for running GTAPView
See_labs.sti Sends sets.har to CSV file
See_regs.sti Sends reg_set.har output to CSV file
See_seti.sti Sends reg_seti.har output to CSV file
See_BI01.sti Sends GTAPView HAR output by commodity to
CSV file See_BI02.sti See_BI03.sti See_BI04.sti See_BI05.sti See_BI06.sti See_BI07.sti See_BI08.sti See_BI09.sti See_BI10.sti See_BI11.sti See_BI12.sti See_BI13.sti See_BI14.sti See_BI15.sti See_BI16.sti See_BI17.sti See_BI18.sti See_BI19.sti
GTAP SUMMARY IN EXCEL
7
See_BI20.sti
See_mc01.sti Sends GTAPView HAR output by region to CSV
file See_mc02.sti See_mc03.sti See_mc04.sti See_mc05.sti See_mc06.sti See_mc07.sti See_mc08.sti See_mc09.sti See_mc10.sti See_mc11.sti See_mc12.sti See_mc13.sti See_mc14.sti See_mc15.sti See_mc16.sti See_mc17.sti See_mc18.sti See_mc19.sti See_mc20.sti
See_sx01.sti Sends SAM extraction HAR output to CSV file
See_sx02.sti See_sx03.sti See_sx04.sti See_sx05.sti See_sx06.sti See_sx07.sti See_sx08.sti See_sx09.sti See_sx10.sti See_sx11.sti See_sx12.sti See_sx13.sti See_sx14.sti See_sx15.sti See_sx16.sti See_sx17.sti See_sx18.sti See_sx19.sti See_sx20.sti
Sets.har Sample standard set file for 3x3 aggregation
produced by the GTAPAgg program; the user can also construct this file by running the GTAPAgg program
Basedata.har Sample 3x3 output from GTAPAgg.
8 GTAP SUMMARY IN EXCEL
TEMPLATES WHICH CAN BE EDITED
COMM_AGG.xls Commodity/industry sector aggregation
mapping
REG_SET.xls Alternative list of 20 regions and longnames for
producing xls files for all countries
REG_SETI.har Alternative list of 20 regions and longnames for
producing xls files for all countries YOU MUST PROVIDE
FOR YOUR ASSISTANCE ONLY
Comm_agg.txt Commodity/industry sector aggregation
mapping – used to create comm._agg.xls
GTAP_SAM_ag3b1.xls Sample output files
GTAP_VEWX_ag3b1.xls Sample output files
DOCUMENTATION GTAP Summary in Excel Documentation
9
1.6
Sample output tables for Australia from GTAP_VEWX_c1.xls
Table 1: GDP components Expenditure Source consumptn 214,866 factors 217,053 investment 77,240 taxes 102,887 government 64,239 depreciatn 37,425 exports 73,934 totsrc 357,365 imports -72,913 diffe_s 0.000000 totexpend 357,365
Table 2: Value of tradables fob and International transport margins by commodity fob trans agri 7,656 758 mimf 51,222 4,448 serv 14,154 0 Total 73,033 5,206
Table 3: Saving and investment
save 40,836
inv -39,815
tot_capacc 1,021
diff_capmcur 0
Table 4: Exports and imports by commodity
exp imp tot_curacc
agri 7,656 -606 7,051
mimf 51,222 -59,276 -8,054
10
Total 73,934 -72,913 1,021
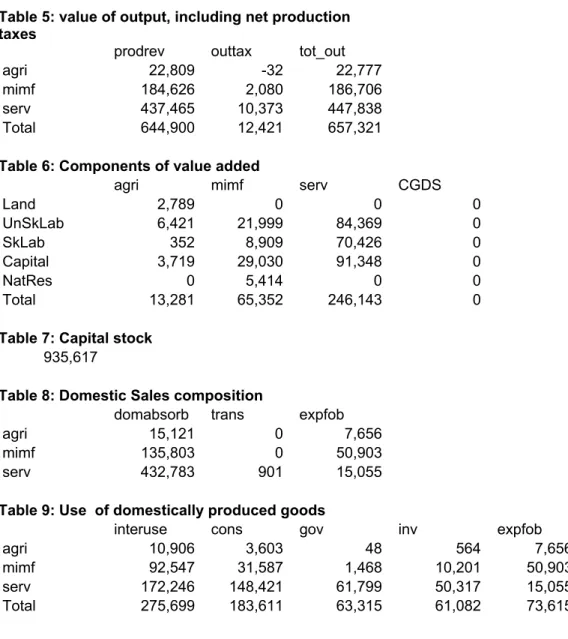
Table 5: value of output, including net production taxes
prodrev outtax tot_out
agri 22,809 -32 22,777
mimf 184,626 2,080 186,706
serv 437,465 10,373 447,838
Total 644,900 12,421 657,321
Table 6: Components of value added
agri mimf serv CGDS
Land 2,789 0 0 0 UnSkLab 6,421 21,999 84,369 0 SkLab 352 8,909 70,426 0 Capital 3,719 29,030 91,348 0 NatRes 0 5,414 0 0 Total 13,281 65,352 246,143 0
Table 7: Capital stock
935,617
Table 8: Domestic Sales composition
domabsorb trans expfob
agri 15,121 0 7,656
mimf 135,803 0 50,903
serv 432,783 901 15,055
Table 9: Use of domestically produced goods
interuse cons gov inv expfob tot_sal
agri 10,906 3,603 48 564 7,656 22,777
mimf 92,547 31,587 1,468 10,201 50,903 186,706
serv 172,246 148,421 61,799 50,317 15,055 447,838
11
Table 10: Use of imports
interuse cons gov inv expfob tot_sal
agri 386 219 1 2 0 608
mimf 35,259 12,656 923 13,585 0 62,423
serv 7,227 5,602 0 202 0 13,030
Total 42,872 18,477 924 13,788 0 76,061
Table 11: Ratio of output to total usage
agri 1.45
mimf 0.94
serv 1.00
Table 12: Industry cost structures - Basic Values
agri mimf serv cons gov inv expfob tot_sal
Primary inputs Land 2,965 0 0 0 0 0 0 2,965 UnSkLab 6,165 21,122 81,007 0 0 0 0 108,294 SkLab 338 8,554 67,619 0 0 0 0 76,511 Capital 3,653 28,173 88,652 0 0 0 0 120,478 NatRes 0 5,254 0 0 0 0 0 5,254 Intermediate inputs d_agri 1,939 7,720 1,247 3,603 48 564 7,656 22,777 d_mimf 2,408 49,357 40,783 31,587 1,468 10,201 50,903 186,706 d_serv 4,707 38,939 128,600 148,421 61,799 50,317 15,055 447,838 m_agri 43 241 102 219 1 2 0 608 m_mimf 700 21,629 12,930 12,656 923 13,585 0 62,423 m_serv 164 972 6,090 5,602 0 202 0 13,030 tot_cost 23,082 181,961 427,030 202,088 64,239 74,870 73,615 1,046,884
Table 13: Industry cost structures - Taxes
agri mimf serv cons gov inv expfob tot_sal
12 Land -176 0 0 0 0 0 0 -176 UnSkLab 256 877 3,363 0 0 0 0 4,495 SkLab 14 355 2,807 0 0 0 0 3,176 Capital 66 857 2,696 0 0 0 0 3,619 NatRes 0 160 0 0 0 0 0 160 Intermediate inputs d_agri -102 0 0 9 0 0 0 -93 d_mimf -37 343 1,414 8,155 0 860 319 11,054 d_serv -248 28 75 1,303 0 0 0 1,159 m_agri -2 0 0 2 0 0 0 0 m_mimf -34 45 80 3,493 0 1,503 0 5,086 m_serv -9 0 0 -184 0 6 0 -187 tot_cost -273 2,665 10,435 12,778 0 2,370 319 28,293