1. Introduction
The 1996 Summer Olympic Games in Atlanta not only challenged athletes with world class competition, but also challenged the National Weather Service (NWS) to provide support to the Games. The challenge for the NWS spanned the entire gamut of weather sup-port operations, from working with a new customer who had new weather information requirements, to the communications media being used. One of the biggest
challenges in supporting the games was conducting warning operations. Traditional NWS warning opera-tions seek to warn the public of severe weather (> 1.9 cm hail, > 25 m s−1 winds, tornadoes, flooding).
However, for the Olympics, the Atlanta Committee for the Olympic Games required notification of the occur-rence or prediction of many nonstandard, almost be-nign by NWS standards, weather phenomena. These nontraditional requirements not only challenged the skills of the meteorologists who manned the Olympic Weather Support Office (OWSO), but also challenged the team of software developers and meteorologists tasked to assemble and integrate the technology tools for the support. This paper discusses the warning re-quirements of the users, the types of warnings and strategies that were developed and used during the Games, the operational warning methodology, and the software tools that supported the warning operations of the OWSO. Broader operational aspects (including training of the forecasters, products and services, and system infrastructure) of the OWSO are discussed in Rothfusz et al. (1998).
Warning Operations in Support of the
1996 Centennial Olympic Games
J. T. Johnson,*
Michael D. Eilts,* David Ruth,
+William Goodman,
#and Lans Rothfusz
@*National Severe Storms Laboratory, Norman, Oklahoma.
+National Weather Service Techniques Development Laboratory,
Silver Spring, Maryland.
#General Sciences Corporation, Laurel, Maryland.
@National Weather Service Forecast Office, Tulsa, Oklahoma.
Corresponding author address: J. T. Johnson, Real Time Appli-cations Prototyping and Idea Development, NSSL, 1313 Halley Circle, Norman, OK 73069.
E-mail: [email protected] In final form 28 September 1999. ©2000 American Meteorological Society
ABSTRACT
During the summer of 1996, the National Weather Service (NWS) provided weather support for the Centennial Olym-pic Games in Atlanta, Georgia. This weather support effort presented many challenges, particularly in the area of pro-viding short-term forecast (watch) and warning support. Topping the list of challenges was working with a customer with different weather information needs than the general public. The needs of the venue and competition management were much more detailed than the NWS traditionally is accustomed to and the thresholds for various phenomena were very low (e.g., warnings for the occurrence of any rain were issued rather than the more traditional NWS severe thunder-storm warning).
This paper discusses many of the challenges faced and met by the Olympic Weather Support Office (OWSO). Details are provided on the weather warning requirements of the Olympic venue and competition management, the watch/warning strategy utilized by the OWSO, and the resulting performance of the office. More than 1200 watches and warnings were issued during the period of Olympic weather support. These bulletins were for phenomena ranging from dew formation and low visibility to lightning and heavy rain. Several emerging technologies were employed for warning operations in the OWSO, including the Warning Decision Support System and the Watch/Warning/Advisory package. These hard-ware/software solutions appear to have made a positive impact on the performance of the office in meeting the chal-lenges of this unique warning situation.
2. Warning requirements
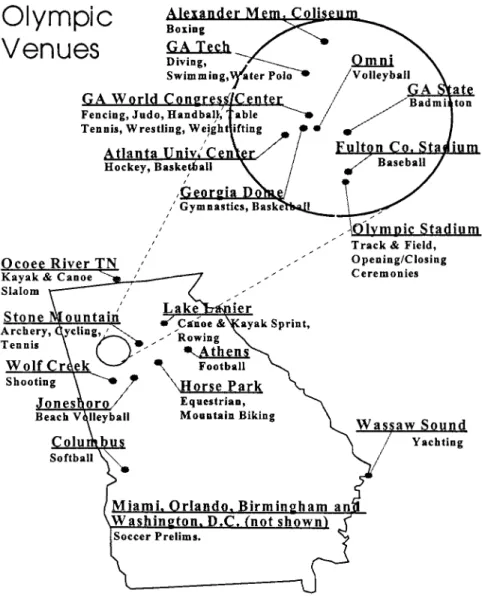
The 1996 Summer Olympic Games consisted of several venues around the state of Georgia. While the majority of the venues were located in the Atlanta metropolitan area, several venues were well removed from Atlanta (Fig. 1). Not only were venues spread geo-graphically across the state of Georgia, which challenged communications, but they were located in different “microclimates,”which challenged the meteorologist’s understanding of the local problems and the technol-ogy tools employed to help the meteorologists.
The safety of the spectators and athletes was the primary concern of venue officials. In addition, with many of the world’s best athletes participating in the Olympic Games, Olympic venue officials strived to
provide the athletes and coaches with the best possible “field of play” conditions for their competitions. Knowing about and planning for (or around) inclem-ent weather was necessary to achieve their safety and field of play goals. Thus, venue officials needed to know when the weather would impact their venues, what intensity would be reached and for how long. In addition, they obviously needed to know all this in-formation with adequate lead time.
Table 1 lists the weather phenomena (with ing criteria) for which venue officials required warn-ing or notification. This listwarn-ing is in addition to the standard NWS severe thunderstorm, tornado, and flash flood warnings. For indoor venues, the primary weather concerns were not for the safety of the ath-letes and coaches or the condition of the playing field but rather for spectators outside moving to and from venues. Thus, weather phenomena for indoor venues had much more traditional warning thresholds.
3. Watch/warning strategy
Members of the OWSO staff met with the venue officials to determine what types of weather phenomena were important to their venues and competitions, and also to understand the re-quired frequency and content of weather information for decision making. In an attempt to main-tain as much of the traditional NWS strategy and format as possible, so as to lessen the amount of training for both the meteorologists and the customer, the following bulletin types and strategies were chosen.
Watch: Issued if there was
any potential of an event occurring. A watch was issued to alert venue officials of the possibility of an event. This strat-egy helped in their
FIG. 1. 1996 Summer Olympic venues. The large ring “blowup” represents the “Olym-pic Ring” venues. Satellite venues include Washington, DC; Birmingham, AL; Orlando, FL; and Miami, FL.
contingency planning for each day. Most watches were issued the day before a po-tential event or the morning before an ex-pected afternoon/evening event.
Warning: Issued if the warning meteorologists be-lieved the event would occur at the venue site.
Statement: Issued as a follow-up to warnings. For the entire lifetime of a warning, a statement was required at least every 15 minutes providing succinct updated information including times of beginning, ending, and how “bad” the event would be.
Dew formation T–Td ≤ 5°F Stone Mtn Cycling 24 h 12 h 1 h
Hail Any size All 6 h As much 15 min
as possible (AMAP)
High heat index HI ≥ 100°F All 24 h 12 h 1 h
Heavy rain Rate < 0.03"/min All 12 h AMAP 15 min (see rain
watch/warning)
Strong wind > 30 mph All except: 12 h AMAP 15 min
(see exceptions Aquatic Ctr Diving (20) (convective)
at right) Open/Close Cer. (20) 1 h
Stone Mtn Cycling (20) (gradient)
Lake Lanier (10)
Lightning Any All 6 h AMAP 15 min
Low visibility ≤ 1 mi AFC Stadium 24 h AMAP 1 h
Clark-Atlanta U Morris Brown Open/Close Cer. Road Cycling GIHP Wolf Creek CSG Golden Park
Rain Any AFC Stadium 24 h 12 h 15 min
Open/close Cer. Stone Mtn Archery Stone Mtn Tennis Stone Mtn Cycling Atlanta Beach Sanford Stadium
Wind > 90° Olympic Stadium 12 h AMAP 15 min
direction in 10 min Road Cycling (convective)
change or less Stone Mtn Cycling 1 h
Wolf Creek (synoptic)
Lake Lanier
TABLE 1. Weather watch/warning criteria for the 1996 Olympic Games venues.
Max watch Max warning Max
issuance issuance statement
4. Meeting the challenge
With a new customer, new types of warnings and a new set of “issuance” rules, the OWSO had to have efficient and accurate technology tools for making warning decisions, issuing bulletins, and managing the bulletins (i.e., keeping track of what bulletins were in effect, were about to expire, needed an update, etc.). To meet these challenges, the Warning Decision Sup-port System (WDSS), developed by the National Se-vere Storms Laboratory (NSSL), and the Watch/ Warning/Advisory (WWA) package, developed by the NWS Techniques Development Laboratory (TDL), were chosen to serve as the foundation for OWSO warning operations. In addition, several other technol-ogy tools were used to support warning operations. All the warning-related tools are discussed below.
a. Warning Decision Support System (WDSS)
Since 1993, the National Severe Storms Laboratory has developed, enhanced, and tested a prototype Warn-ing Decision Support System in NWS offices across the country as part of actual warning operations. The WDSS consists of severe weather detection and pre-diction algorithms (e.g., the Hail Detection Algorithm and the Damaging Downburst Prediction and Detec-tion Algorithm), data integraDetec-tion techniques, and an interactive graphical user interface (Johnson et al. 1996). The WDSS was developed to test severe weather detection and prediction algorithms and dis-play concepts in real time, in front of warning meteo-rologists, to gain feedback on the utility of the WDSS components before these components are transferred to the WSR-88D and the Advanced Weather Interac-tive Processing System (AWIPS). The posiInterac-tive feed-back on the performance and utility of the WDSS in warning operations made it attractive as a technology tool for the OWSO.
b. Watch/Warning/Advisory (WWA) software
The WWA software provides an intuitive method by which forecasters can choose: the phenomenon for which to issue a watch or warning, the valid times of the product, and the areas affected. In addition, WWA manages the watches, warnings, and statements in ef-fect and alerts the user to the need for updates. The WWA software was developed by TDL for “long-fused” warnings such as Winter Storm Warnings as part of the Interactive Computer Worded Forecast now being tested on AWIPS (Ruth et al. 1998). WWA was modified by TDL and the OWSO staff for use in
sup-port of the Olympics. The ability to use WWA and WDSS on the OWSO computing platform and the maturity of WWA made it a perfect fit for the OWSO.
c. Implementation of WDSS and WWA
Changes to the WDSS and the WWA were neces-sary due to the uniqueness and frequency of the watches and warnings and pinpoint location require-ments. Table 2 provides a brief description of the changes that were required for both the WDSS and WWA to support the OWSO warning operations.
d. Other OWSO watch/warning tools
In addition to the WDSS and WWA applications, the OWSO utilized several other tools, some of which were software applications and some of which were data sources, as part of its watch/warning operations. These additional tools were primarily used in a “now-casting” role or in watch decision making. These tools included the following:
• the RAMSDIS (Molenar et al. 1996) system; • surface observations from a mesonet (Garza and
Hoogenboom 1997);
• high temporal and spatial resolution analyses from the Local Analysis and Prediction System (LAPS; Snook et al. 1997);
• high temporal and spatial numerical mesoscale models including the Regional Atmospheric Mod-eling System (RAMS; Snook et al. 1997) and the Eta-10 (Black et al. 1997);
• Interactive Sounding Program for analyzing verti-cal profiles of wind, temperature, and moisture; • special 0300 and 1500 UTC soundings from
sur-rounding NWS radiosonde sites; and
• a “mesocast” form that provided meteorologists an integrated look at mesoscale features that could serve as focus mechanisms for convection. The RAMSDIS system is a PC-based satellite dis-play and interrogation system. The OWSO RAMSDIS was configured to receive GOES-8 imagery every 15 minutes from the satellite downlink system at the Storm Prediction Center in Kansas City, Missouri. The RAMSDIS also provided satellite data to the LAPS analysis and to the WDSS for displaying and compar-ing with radar data.
The NWS installed 12 Campbell Scientific surface observing sensors at or near venue sites for the Olym-pic Games (Garza and Hoogenboom 1997). These sen-sors along with sensen-sors from the University of Georgia
and the Georgia Forestry Commission composed a mesonetwork of surface weather observing platforms. Temperature, relative humidity, wind speed, and wind direction data were collected every 15 minutes from a majority of the mesonet sites.
To better take advantage of the enormous amount of observational data available in the OWSO, an analy-sis of the data was done every half hour using the analysis capability of the LAPS. The analysis portion of LAPS also served as initial conditions for the pre-diction portion of LAPS, known as the Regional At-mospheric Modeling System (Snook et al. 1997). The LAPS analysis was run using surface observations (standard NWS sites and mesonet), WSR-88D data,
GOES-8 visible and infrared data, instrumented buoy data (buoys located off the Georgia coast near nah), and vertical wind profiler data (located in Savan-nah) as input. The first-guess estimate of the nonsurface levels was provided by the Rapid Update Cycle. The resulting analysis was on a horizontal grid of 81 × 81 grid points at 8-km resolution. The grid cov-ered all of Georgia, eastern Alabama, southeastern Tennessee, and most of South Carolina. The analysis was updated every half hour. More detailed informa-tion on the LAPS configurainforma-tion and its use for the Olympics can be found in Snook et al. (1997).
In addition to the standard numerical models run by the National Centers for Environmental Prediction
Required WDSS changes
Lightning data The lightning data “overlay” was placed in its own window or image where the data could be viewed as a single data source or as an overlay on other image types (radar reflectivity, visible satellite, etc.). Venue overlay Venue locations were added to the maps overlay. These overlays were 5 and 10 n mi rings around the
venue sites. These rings provided an immediate reference for noting the location of lightning and storms relative to the venues. Watches and warnings had to be written with references only to venues (and possibly interstate highways), since venue management was typically not from the Atlanta area and only knew the location of venues rather than towns or counties.
Multipanel The WDSS display was enhanced with a multipanel display for simultaneously observing radar
display reflectivities at multiple elevation angles. This provided a means of viewing the reflectivities relative to the freezing level as a possible indicator of the potential of lightning.
Attribute tables Tabular algorithm information was augmented with a venue location column for quick determination if a storm was affecting a particular venue.
Satellite data Satellite data (visible, infrared, and water vapor channels) were ingested into the WDSS and displayable side-by-side with the radar data with the same magnification and center point for quick comparison of satellite features and radar echoes.
Required WWA changes
Venue location The interactive county selection map was deactivated for all counties that did not contain Olympic venues. selection The county selection map was annotated with venue locations. For counties with multiple venues, a window
with all possible venues in that county was displayed and the user could choose which venues to include in the watch or warning.
Database The WWA database of watch and warning types was augmented to include all the specific Olympic watch and warning types (see Table 1). In addition, since many of the phenomena could occur simultaneously, several pre-determined combinations were also included in the database.
Specialized calls-to-action statements were developed for the watch and warning types that reflected the types of actions that could be expected by athletes, coaches, volunteers, and venue management at the venues.
TABLE 2. Description of modifications that were required for the WDSS and WWA software packages to support warning opera-tions in the Olympic Weather Support Office.
(NCEP), two high-resolution mesoscale models were run in support of the Olympics to provide additional information to the forecast process. The Eta-10 was run at the Cray Research facility in Eagan, Minnesota, and at the NCEP. The domain of the Eta-10 was roughly the eastern half of the United States. The model was run at 0300 and 1500 UTC daily during the Olympic Games out to 45 h in 3-h increments. The RAMS was run at the OWSO at both 8- and 2-km hori-zontal resolution with the same domain as LAPS for the 8-km resolution and a movable domain for the 2-km resolution. The RAMS model was run every day every 3 hours from 0600 to 2100 UTC. The model runs generally ran to 14 or 15 hours before the next model run would start. [See Snook et al. (1997) for more in-formation on the implementation and use of RAMS during the Olympics and Black et al. (1997) for more information on the implementation and use of the Eta-10 during the Olympics.]
The NWS radiosonde sites, in states surrounding Georgia, made special 0300 and 1500 UTC radiosonde releases. These soundings were used as part of the ini-tial conditions for the Eta-10 model. In addition, a 1600 UTC sounding was taken each day during the games at Peachtree City, Georgia (site of the OWSO), for a better “convective potential” examination than the 1200 UTC sounding typically offers.
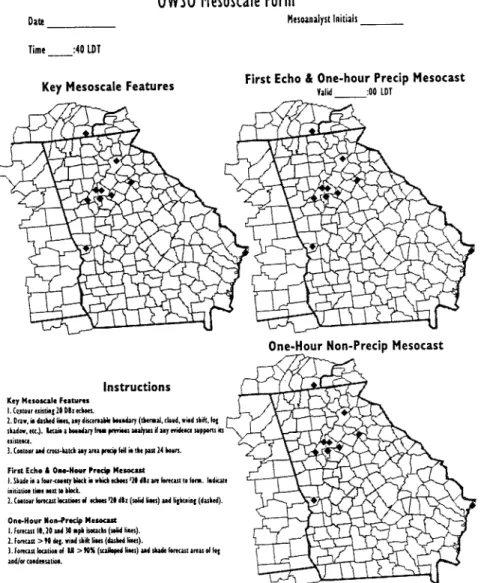
There is no clear-cut line where forecast operations end and warning/watch operations begin. To assist in moving downscale from the standard forecast pack-age to mesoscale watch/warning operations, the OWSO developed a mesocast form (Fig. 2) to be filled out by the mesoanalyst. The purpose of the form was to document key mesoscale features (cloud bound-aries, wind shift lines, fog shadows, precipitation foot-prints, existing radar echoes, etc.) and to make a one-hour forecast of radar echoes, lightning, winds > 10, > 20, and > 30 mph and RH > 90%. This form was an attempt to focus all the mesoscale data sources (sur-face observations, radar, satellite, etc.) into one form for a comprehensive look at the situation.
5. Watch/warning operations
Peak staffing at the OWSO centered around the daily convective potential (Rothfusz et al. 1998). Two, two-person teams dedicated to mesoscale operations were scheduled daily from 1400 to 2200 EDT. Each team was comprised of one person doing mesoanaly-sis (completing the mesocast form with the aid of
LAPS) and observational data while the other person interpreted the WDSS and issued warnings with the WWA. Watch/warning decisions were made jointly by the team members. Each team was responsible for either north or south venues (Fig. 1) as shown below.
North Team Venues South Team Venues
Ocoee Olympic Ring
Lake Lanier Atlanta Beach
Athens Wolf Creek
Stone Mountain Columbus
Georgia International Horse Park
Note that the yachting venue, Wassaw Sound, was the responsibility of the Olympic Marine Weather Support Office (Powell and Rinard 1998).
a. Mesocasts
Mesoscale forecasts or “mesocasts” were prepared by the mesoanalysts every two hours from 0600 LT until noon and then hourly until 2100 LT. Although this form was not distributed externally, it was used as a tool for constantly and consistently monitoring mesoscale phenomena.
A special form with three base maps was developed for this purpose (Fig. 2). The first map, known as the “Key Mesoscale Features Map” (Fig. 2, upper left), documented, for an extended period, those areas that might support convective initiation. Peripheries of areas where fog dissipated in the morning, rain fell the previous day, or clouds were prevalent, were noted as possible locations for convective initiation. In addi-tion, wind shifts and strong gradients of moisture and temperature were indicated on the form.
The First Echo and One-Hour Precipitation Mesocast Map (Fig. 2, upper right) was used to indi-cate the prediction of the onset and subsequent move-ment of convection/precipitation. The location and time of first echoes (> 20 dBZ) were indicated by iden-tifying a block of four counties in which echoes were expected to form and by labeling the expected initia-tion time. The forecasters utilized all available obser-vational data sources, model forecasts, experience, and understanding to make these forecasts with no particu-lar formula or method. There was no attempt to verify these forecasts. The forecasts were simply a useful means by which the forecasters could document their thoughts for others in the OWSO to see and use as a guide for the coming hour(s).
Finally, the One-Hour Nonprecipitation Mesocast Map (Fig. 2, lower right) was used to indicate the fore-cast position of key weather features important to Olympic venues (Table 1).
b. Watches, warnings, and updates
All OWSO watches, warnings, and statements were issued with the WWA. Any standard NWS watches and warnings (e.g., severe weather, tornado, and flash flood) issued by the NWSFOs or national centers that had watch/warning responsibility for the Olympic venue areas were “passed through” to the OWSO customers. WWA was configured to “reissue” these products and it was the responsibility of the OWSO forecasters to monitor
NWSFO, National Hurricane Center, and Storm Prediction Center activities for their origi-nal issuance.
For all nonstandard Olympic weather products, the WWA would automatically include in-formation relating to the nature of the watch, warning, or update statement. OWSO forecasters added a discussion section for each product. Forecasters were required to include the following information in all discussion sections:
1) the expected onset time of the phenomenon,
2) the expected intensity of the phenomenon, and
3) the expected end time of the phenomenon.
When warnings had been issued, or when activity for which a watch had been issued approached warning criteria, up-dates or Weather Status State-ments were issued as frequently as every 10 minutes. OWSO support of pre-Olympic events demonstrated that statements issued as frequently as every 10 minutes were necessary when a warning for a convective phe-nomenon was in effect to keep
the competition and venue management abreast of changes. Over 1200 updates were issued during the support of the Olympics (7 July–4 August 1996). WWA’s ability to advise forecasters as to when fol-low up statements were due was a tremendous asset. Table 1 lists the variety of venue-specific watches and warnings that were required of the OWSO and the planned frequency of updates.
c. Verification of watches and warnings
Great care was taken by the OWSO staff to determine if watches and warnings verified. A watch/warning verification log was maintained by the mesoanalysts. A watch or warning verified if the phenomenon was
FIG. 2. Mesocast form used in support of the 1996 Olympic Games. Upper-left map is for denoting key mesoscale features, such as boundaries (thermal, cloud, wind shift, fog shadow, etc.). The upper-right map is for first echo and 1-h precipitation mesocast. The lower-right map is for 1-hour nonprecipitation mesocast (wind speeds, direction, RH).
confirmed at the venue site. Warnings for multiple phenomena were verified for each phenomenon at each venue. For example, a lightning and heavy rain warn-ing issued for Atlanta Beach and Wolf Creek consti-tuted four warnings. The existence of lightning alone would only verify the lightning portion of the warning (one verification for each venue). Heavy rain would have had to have been verified separately for each venue.
The forecasters were encouraged to use all avail-able resources in determining whether or not a watch/ warning verified or if an unwarned event occurred. This usually involved calling the Venue Communica-tions Center (VCC) and questioning the venue man-agement about the events that transpired. These calls typically took place during the duration of the warn-ing or shortly after the expiration of the warnwarn-ing. If some observational data (e.g., radar data, surface ob-servation) were received that indicated the possibility of an unwarned event, a call to the VCC was made to verify the conditions. A few warnings were verified by off-duty forecasters watching a competition on tele-vision while still others were verified by observational data (e.g., a mesonet observation of a 30 mph gust at a venue site would verify a high wind warning, and a lightning strike in the NLDN data stream within 5 n mi of the venue would verify a lightning warning). A correct hit was credited for a watch or warning if the warned for event occurred during the valid time of the warning, otherwise, the watch or warning was declared a false alarm.
The final verification statistics are shown in Tables 3 and 4. Table 3 provides the statistics for watches is-sued during the period 7 July–4 August 1996. A total of 571 watches were issued during the period with the majority being for lightning (210), heavy rain (181), and high heat indices (59). The high FAR is indica-tive of the type of criteria used to issue watches. The philosophy was to minimize the risk of catching the customer off guard to a potential weather situation. Even if only the slightest chance existed for a phenom-enon to occur, a watch was issued. A state of readi-ness was accomplished at the VCCs with the issuance of a watch. The greatest success (CSI) for watches was the issuance of watches for lightning (38%).
Table 4 provides the statistics for warnings issued during the period 7 July–4 August 1996. A total of 663 warnings were issued during the period with the ma-jority being for lightning (228), light rain (237), and heavy rain (125). Success rates for warnings were be-tween 60% and 70% for these most frequent phenom-enon. The reasons behind these successes are discussed
below in section 6. The most difficult phenomena to warn for were wind direction changes and dew forma-tion. The reasons behind these failures are discussed below in section 6.
6. Discussion of challenges
Most of the watches and warnings issued during the Olympics had much lower thresholds than that for which the NWS traditionally issues watches and warn-ings. These thresholds were put into place because of the need to not only protect life and property but to provide weather information that could affect an ath-letic competition. Alerting the customer to the occur-rence of these lower threshold phenomena was scientifically and technically challenging. Some of these challenges were addressed by supplying fore-casters with high temporal and spatial resolution ob-servations and forecasts. In addition, the tools available to the forecasters made the examination of these data efficient and effective. However, as the sta-tistics show, there was room for improvement.
a. Lightning
Lightning was the weather phenomenon most feared by venue and competition management. It can be quite daunting to have 100 000 spectators in an open-air stadium and have lightning in the vicinity. While lightning is an obvious concern for outdoor venues, the indoor venue management had to manage crowds outside their venues and the occurrence of lightning impacted this crowd management. Lightning warnings were considered successful if thunder was heard at the venue or if a lightning strike was indicated in the NLDN data stream within 5 n mi of the venue during the valid time of the warning.
Lightning accounted for 31% of all the warnings and 37% of all the watches issued by the OWSO. The 72% probability of detection (POD) for lightning watches and 83% POD for lightning warnings indicates good skill at recognizing the factors that lead to the occurrence of lightning. However, the false alarm ra-tio of 25% for warnings and 55% for watches indicates a significant amount of uncertainty in these factors.
For lightning watches, forecasters looked for all the factors that are generally considered for thunder-storm development (instability, moisture, lift). If thun-derstorms were even a slight possibility, a lightning watch was issued. Thus a high FAR for lightning is not surprising.
For lightning warnings, the forecasters were forced to rely more on the tools that were at their disposal rather than relying on a generally accepted method. The tools included the 15-minute GOES-8 satellite data (via RAMSDIS) the WSR-88D data and displays (via WDSS), the LAPS analyses, and the surface mesonet data. Warnings for lightning were most of-ten triggered by existing thunderstorms anticipated to move over the venue of interest. The less frequent and more difficult situation was forecasting the onset of lightning from clouds that either did not yet exist or had been detected by the radar for no more than a few minutes. For the first few days of the Olympic weather support, the forecasters examined WSR-88D data looking for reflectivity echoes located near the freez-ing level (Hondl and Eilts 1994) by usfreez-ing the multipanel display in the WDSS. This technique was determined to be unreliable for the summertime Geor-gia environment and led to too many false alarms. Forecasters began using storm top above 20 000 ft as a predictor which seemed to work better. There is ob-vious room for improvement in finding better predic-tors for the onset of lightning and more research is needed in this area.
b. Heavy and light rain
While most venues were primarily concerned about heavy rain, some venues were concerned about the occurrence of any rain (these venues were outdoor venues with playing fields that could be hazardous for competition). As with lightning, issuing a watch for heavy or light rain was essentially an extension of de-veloping a forecast with heavy or light rain in the 24-hour forecast. However, with the warnings there were two modes or types of scenarios: 1) issuing a warning for existing precipitation that was expected to move over the venue(s) of interest, and 2) issuing a warning for developing precipitation in the vicinity of the venue(s).
For heavy and light rain warnings of the first type, the use of the looping capability (of radar reflectivity) of the WDSS and the track forecast feature of the Storm Cell Identification and Tracking Algorithm (Johnson et al. 1998) was sufficient to provide enough information to the forecasters on whether existing pre-cipitation would move over the venue(s) of interest. These warnings were generally valid only for 30– 45 minutes and thus the extrapolation of existing mo-tions worked sufficiently well. For events of the sec-ond type, the use of the WDSS multipanel display and
the RAMSDIS satellite display provided the most in-sight into precipitation development. The biggest chal-lenge was in determining both if the radar echo or clouds seen on satellite would develop precipitation and, if so, how long formation would take. Traditionally, NWS forecasters do not have to concern themselves with whether or not a cloud or low reflectivity radar echo will produce any precipitation, rather they have to be more concerned with more substantial storms and whether or not they will produce very heavy rain, dam-aging winds, hail, or tornadoes. Thus, being concerned with the other end of the spectrum was a challenge for the OWSO forecasters. Even so, the forecasters were quite successful in the both watches and warnings for heavy and light rain. The use of data integration and convective initiation tools (e.g., Wilson and Mueller 1993) would likely have been tremendously useful for these situations.
Occurrence of precipitation was verified by the forecasters calling the VCC and questioning the venue management about the nature of the precipitation and by rainfall measurements at the mesonet sites located at venues. On occasion, precipitation occurrence was verified by radar observation of precipitation at a venue.
c. Wind speed
Table 1 shows that most venues were concerned with wind speeds greater than 30 mph, but several were concerned with wind speeds greater than 20 mph and one with wind speeds greater than 10 mph. The weather pattern in Georgia during the summer of 1996 was dominated by a high pressure system that was not conducive to wide-spread high wind events. Thus, the concern over winds greater than 30 mph was limited to thunderstorm situations and their resulting outflow. These events were generally not difficult for the fore-casters to determine. Watches for high winds were gen-erally handled similar to lightning; with a forecast of thunderstorms, a watch for high winds was issued. In general, warnings for high winds were always issued when a thunderstorm was expected to move over or very near the venue(s) of interest.
The 20-mph criteria was similar to the 30-mph cri-teria. Winds in Georgia during the summer typically do not exceed 20 mph except in thunderstorm situa-tions. The biggest warning challenge for wind speeds was at Lake Lanier (Fig. 1), site of the rowing compe-tition. With a watch/warning criteria of wind speeds greater than 10 mph, this venue received the majority of the 32 wind warnings and 41 wind watches. The
watches were generally issued when forecast models were forecasting surface winds greater than 7 mph. Forecasters relied heavily on the surface mesonet sta-tion near the Lake Lanier venue for wind warnings at the venue. However, the siting of the mesonet station was not optimal for this purpose. The mesonet station had to be located on a ridge above the rowing site on the lake. Thus, using the mesonet station to make warning decisions for the Lake Lanier venue was dif-ficult. This required more of a reliance on communi-cation with the venue site about the wind conditions. Tables 3 and 4 show that the wind watches had a low (23%) POD and high FAR (85%). However, the warnings were more successful, 73% POD and 50% FAR. The lack of success for the watches is due to the lack of spatial resolution in the forecast models and thus the ability to predict the small variations in the wind field that were needed to discern the need for a watch. The better success with the warnings is likely due to the high resolution of the observational sensors (radar, satellite, and surface mesonet), but the rather high FAR is likely due to not high enough resolution in the surface mesonet for detecting the detailed fea-tures of the thunderstorm outflows and sampling limi-tations of the WSR-88D.
d. Wind direction
No wind direction change watches were issued during the period 7 July–4 August 1996. A 90° wind direction change was the criteria and forecasters had to rely (for watches) heavily on the mesoscale fore-cast models to predict deep convection. With the wind direction change being an issue at only five venues, forecasters had to either trust the forecast models ex-plicitly about the timing and location of deep convec-tion or only issue watches for more obvious events (such as fronts). Only three wind direction change warnings were issued, none of which verified. Two events actually occurred that went unwarned. It is ap-parent that the scale of the phenomenon that occurred was much smaller than the resolution of the observa-tional tools in place.
e. Heat index
Summer in Georgia can be quite hot and humid and thus the heat index can be quite high at times. Competition and venue management alike were concerned about the health and safety of the athletes, spectators, and workers. Heat index was chosen as the measure for which to gauge heat stress and thus watches and warnings were issued for events with
Phenomenon
(verified events) POD FAR CSI
TABLE 3. Probability of Detection (POD), False Alarm Ratio (FAR), and Critical Success Index (CSI) for the various phenom-enon for which watches were issued during the Olympics.
Lightning (95) 72% 55% 38% Heavy rain (58) 74% 68% 29% Light rain (38) 51% 51% 27% Wind speed (6) 23% 85% 10% Wind direction change (0) — — — Heat index < 100°F (29) 91% 51% 47% Visibility > 1 mi (0) 0% — — Dew formation (2) 22% 33% 20% Hail (any size) (0) 0% — —
Total (228) 64% 60% 33%
Lightning (155) 83% 25% 65% Heavy rain (78) 93% 38% 60% Light rain (170) 96% 28% 70% Wind speed (16) 73% 50% 38% Wind direction change (0) 0% 100% 0% Heat index > 100°F (29) 94% 29% 67% Visibility < 1 mi (3) 100% 0% 100% Dew formation (6) 100% 54% 46% Hail (any size) (0) 0% 100% 0%
Total (457) 89% 31% 64%
TABLE 4. Probability of Detection (POD), False Alarm Ratio (FAR), and Critical Success Index (CSI) for the various phenom-enon for which warnings were issued during the Olympics.
Phenomenon
a heat index greater than 100°F. There were 59 watches and 41 warnings issued for high heat index. Forecasting for this phenomenon was much more tra-ditional and the adtra-ditional tools available to the fore-casters appear to have been helpful for predicting these events as shown by the high POD and low FAR num-bers for both watches and warnings (Tables 3 and 4). However, it is difficult to truly determine if the addi-tional tools made an improvement because the NWS does not traditionally issue watches and warnings for heat index.
f. Visibility
Visibility was one of the more obscure phenom-ena requiring prediction during the Olympics. The NWS does traditionally issue public advisories and forecasts for dense fog. Only in aviation forecasts is there a need to be concerned about the density of the fog. The forecasters at the OWSO were asked to fore-cast and issue watches and warnings for situations with visibility less than 1 mi. In general, the forecast-ers were forecasting conditions of RH of > 95% and attempting to equate the RH with a visibility. The two visibility watches that were issued did not verify. The three visibility warnings issued all verified.
g. Dew formation
Dew formation was likely the most challenging phenomenon to forecast during the Olympic Weather Support effort. Watches and warnings for dew were required at the velodrome (a banked oval cycling track). Any moisture on the track created hazardous conditions for practices and competitions. For issu-ing watches, forecasters relied on model forecasts of temperature and moisture as well as the previous day’s observations. For issuing warnings, forecasters relied more on the observations of dewpoint and tempera-ture from the mesonet sensors at the venue site. Unfortunately, the mesonet unit could not be sited op-timally and thus the usefulness of the temperature and dewpoint were limited. Confirmation of the formation of dew was critical for determining the reliability of the sensors and for determining the measured tempera-ture/dewpoint spread at which dew actually formed. During the early morning and late evening hours, fre-quent calls were made to the venue site to confirm the moisture conditions on the track. These reports were compared to the mesonet sensor readings for calibrat-ing the sensors. It took several days for the forecast-ers to gain undforecast-erstanding about what conditions/ readings resulted in dew formation on the track.
In general, watches for dew formation were not issued. The warnings became the standard bulletin for alerting the users. Thirteen dew formation warnings were issued with a POD of 100% and a FAR of 54%.
7. Observations and recommendations In supporting the 1996 Summer Olympic Games, the National Weather Service undertook a tremendous challenge of assembling cutting-edge technology, working with a new customer and forecasting and warn-ing for low threshold weather phenomena. However, the experience was a bona fide success by all accounts from the participants, the customers, and the resulting watches and warning statistics. The experience pro-vided insight into the needs, concerns, and issues of the NWS office of the future and for similar support efforts. Watch/warning operations within the Olympic Weather Support Office included using new technol-ogy tools and methods to 1) issue new types of warn-ings, 2) provide more frequent information, 3) provide point watches and warnings for venues rather than area (county based) watches and warnings, and 4) provide specific information about a situation. Several recom-mendations and observations about OWSO watch/ warning operations may benefit future NWS opera-tions support efforts, as follows.
• The practice of issuing follow-up statements rap-idly—as often as every 10 minutes during thunder-storms—until the weather episode ended made the warning program particularly successful. This im-pacted the operational workload, but software like WWA minimized the impact. Olympic officials commented that the continuous stream of post-warning statements made them feel that their in-terests were truly being tended. The ratio of state-ments to warnings was over 2:1. It is recommended that a similar practice be adopted for standard NWS warning operations.
• Customers were especially pleased with the three required elements in the discussion section of each watch, warning, and statement: When the event would start, how bad it would get, and when it would end. It is recommended that such informa-tion be included in all NWS bulletins and short-term forecasts.
• During the early days of the Olympic weather sup-port verification statistics were not as good as one would have hoped. This was likely due to some
un-familiarity with the technology and the forecast do-main (only two of the forecast staff were from NWS forecast offices in the southeast United States). However, overall warning verification sta-tistics of the OWSO showed POD and FAR scores declined (to 0.89 and 0.31, respectively) and the CSI improved to 0.64 during the period of support. The decrease in POD scores was likely due to a re-duction in “broad-brush” warnings. The decrease in FAR scores, on the other hand, was probably evi-dence of forecasters’ increased skill with the new technology. Forecasters were in general agreement that the scores would only improve with more ex-perience with the new technology. It is recom-mended that all watch/warning verification statis-tics be evaluated over a period of time before, dur-ing, and following the introduction of new technol-ogy to determine if the new technoltechnol-ogy had an impact on the results.
• Forecasters used the WDSS multipanel display to locate the existence of 10 dBZ or more of radar re-flectivity above the freezing level as a potential indicator of lightning. This proved to be unreliable. Although forecasters eventually discovered a bet-ter predictor (storm top above 20 000 ft) more re-search is needed for “forecasting” lightning on the 10–15-minute timescale.
• With the watch/warning criteria thresholds so much lower than the standard NWS criteria, it was often necessary to look for the existence of first echo, and, depending on the stability of the atmo-sphere, decide on whether or not to issue a warn-ing. Waiting for a storm to show up as an identi-fied storm cell (via the Storm Cell Identification and Tracking algorithm) was often too late. Among other tools, WDSS’s multipanel display of several elevation angles at the same time was useful in these situations.
• The mesocast form became an integral part of the mesoscale forecast operations. It helped forecast-ers track and focus their thoughts on possible me-soscale forcing mechanisms. It is recommended that a similar device for tracking mesoscale fea-tures—even for long periods of time—be devised for NWS operations. Such a device could be in paper format, but tools (software) that integrate data and provide guidance on convective initiation should be the ultimate goal (e.g., the Autonowcaster; Wilson and Mueller 1993). It is recommended that the NWS take action to provide these types of tools in their operational systems.
Acknowledgments. The authors would like to thank the en-tire staff of the Olympic Weather Support Office and the Olym-pic Marine Weather Support Offices for their patience, insight, and talent to make the Olympic weather support effort a tremendous success. The lead author would like to thank the National Weather Service, the Southern Region Headquarters, and the Olympic Weather Support Coordinating Committee for the wonderful op-portunity to be a part of a truly inspiring experience.
References
Black, T., G. DiMego, and E. Rogers, 1997: High resolution nu-merical guidance from NCEP’s ETA model for the 1996 Olym-pic Games. Preprints, 13th Conf. on Interactive Information and Processing Systems for Meteorology, Oceanography, and Hydrology, Long Beach, CA, Amer. Meteor Soc., 9–14. Garza, C., and G. Hoogenboom, 1997: Success experienced in the
use of diverse surface weather data collection systems in sup-port of the 1996 Olympic Games. Preprints, 13th Conf. on In-teractive Information and Processing Systems for Meteorol-ogy, Oceanography, and HydrolMeteorol-ogy, Long Beach, CA, Amer. Meteor. Soc., 1–4.
Hondl, K. D., and M. D. Eilts, 1994: Doppler radar signatures of developing thunderstorms and their potential to indicate the onset of cloud-to-ground lightning. Mon. Wea. Rev., 122,
1818–1836.
Johnson, J. T., and Coauthors, 1996: Operational testing of enhanced WSR-88D algorithms and display concepts in National Weather Service offices. Preprints, 12th Conf. on Interactive Informa-tion and Processing Systems for Meteorology, Oceanography, and Hydrology, Atlanta, GA, Amer. Meteor. Soc., 143–146. ——, P. MacKeen, A. Witt, G. J. Stumpf, E. D. Mitchell, M. D.
Eilts, and K. W. Thomas, 1998: The Storm Cell Identification and Tracking Algorithm (SCIT): An enhanced WSR-88D al-gorithm. Wea. Forecasting, 13, 263–276.
Molenar, D., K. J. Schrab, J. F. W. Purdom, and H. Gosden, 1996: RAMSDIS in digital satellite data training and analysis. Pre-prints, 12th Conf. on Interactive Information and Processing Systems for Meteorology, Oceanography, and Hydrology, At-lanta, GA, Amer. Meteor. Soc., 160–163.
Powell, M. D., and S. K. Rinard, 1998: Marine forecasting at the 1996 Centennial Olympic Games. Wea. Forecasting, 13, 764– 782.
Rothfusz, L. P., M. R. McLaughlin, and S. K. Rinard, 1998: An overview of NWS weather support for the XXVI Olympiad.
Bull. Amer. Meteor. Soc., 79, 845–860.
Ruth, D. P., M. A. Mathewson, T. J. LeFebvre, and P. K. Wu, 1998: Interpretation and editing techniques for Interactive Forecast Preparation. Preprints, 14th Conf. on Interactive In-formation and Processing Systems for Meteorology, Ocean-ography, and Hydrology, Phoenix, AZ, Amer. Meteor. Soc., 345–349.
Snook, J. S., P. A. Stamus, J. Edwards, Z. Christidis, and J. A. McGinley, 1997: Local-domain mesoscale analysis and fore-cast model support for the 1996 Summer Olympic Games.
Wea. Forecasting, 13, 138–150.
Wilson, J. W., and C. K. Mueller, 1993: Nowcasts of thunderstorm initiation and evolution. Wea. Forecasting, 8, 113–131.