Online Surveys Aren't Just for Computers Anymore!
Exploring Potential Mode Effects between Smartphone
and Computer-Based Online Surveys
Trent D. Buskirk, Ph.D.
1and Charles Andrus, MHA.
21
The Nielsen Company,
8084 Watson Road Ste 226, Saint Louis, MO 63119
2
Saint Louis University and Saint Louis Children’s Hospital Mailstop PG-100, 1 Children's Place, St. Louis MO 63110
Abstract
The percentage of cell phone only households in the United States continues to rise and currently hovers just under 32% (Bloomberg and Luke, 2011). With a continually increasing rate nearly 50% of U.S. mobile phone subscribers use smartphones (Rainie et al., 2012 and Nielsen Wire, 2012). As these smart mobile devices continue to rise in popularity and functionality, their potential as a survey data collection methodology becomes clearer. This paper presents the preliminary results of an experiment that randomized online panelist to complete an online survey via computer or iPhone within 8 block groups defined by a combination of age, sex and education variables. Detailed comparisons for mode effects from two broad outcomes including: randomization/recruitment and survey process/completion are included in this paper. In short, there were significant differences noted in survey completion times after accounting for block group. No significant differences were noted for other key mode effects outcomes including open ended items and missing item rates, contrary to what we would have expected.
Keywords
: Smartphones, iPhone, Cell Phone, Survey Research, Randomized Complete Block Design, Mode Effects, APPS
1.
Background
1.1 The Rise of Smarter Cell Phones
The percentage of cell phone only households in the United States continues to rise and currently hovers just under 32% (Bloomberg and Luke, 2011). With a continually increasing rate nearly 50% of U.S. mobile phone subscribers use smartphones (Rainie et al., 2012 and Nielsen Wire, 2012). One major draw to popular smartphone platforms is the availability of executable applications that can run via the smartphone operating system (apps). Beyond app use, utilization of data services (such as text messaging and Internet browsing) among 30-49 year-old cell phone owners also continues to rise (Smith, 2010). The smartphone offers a multimode survey device accessible via voice, text or Internet and can make use of synchronous multimedia messaging (SMS) and APPs. The variability in smartphone devices, hardware, operating systems and mobile browser capabilities, creates intricacies and complications for implementing smartphone surveys via apps or mobile online browsers beyond that of computer online varieties. And while the research related to using mobile phones in the survey context continues to grow (see for example: Brick et al., 2007; Steeh et al. 2007; Vicente, et al., 2009; ZuWallack, 2009; AAPOR, 2010), specific research regarding the use of smartphones exclusively is just now beginning to appear. Couper (2010) presents more detailed experiments for online survey research applied to mobile browsers related to types and sizes of data entry fields and spacing/alignment of response options, among others. Callegaro (2010) provides specific recommendations for survey researchers to deal with the
ever increasing reality that respondents complete online surveys via mobile devices. Couper (2010) echoes these recommendations and also suggests developing different versions of online surveys for smartphones rather than having online mobile users adapt to current online standards. Peytchev and Hill (2010) report the results for a series of experiments comparing various aspects of questionnaire design and layout including horizontal scrolling, number of questions per screen, direction of response options, impact of embedded images and the use of open-ended options using a Samsung Blackjack smartphone. Fuchs (2008), Callegaro and Macer (2011), Buskirk (2011), Link and Buskirk (2012) and Buskirk and Andrus (2012) present details of new and emerging survey research methods and include specific suggestions about how to operationalize smart phone surveys across various mobile platforms including: question layout, paradata, and next/back button placement, among others. While the Petchev and Hill (2010) study is among very few published experiments with smartphones specifically, they do not compare the smartphone to other popular survey research modes of data collection (e.g. online and paper). To our knowledge, the only published study investigating mode effects between surveys completed via online versus smartphones conducted in North America was presented by Zahariev et al. (2009). In their experiment Canadian smartphone users were randomized into online or mobile completion of a short 8 item questionnaire (6 single select, 1 multiple select and 1 open ended question). Zahariev et al. (2009) report no significant differences in the response option distributions across mode for the 7 closed-ended survey items. In this paper we report some preliminary results of the Got Healthy Apps Study (GHAS) that compares online surveys completed via smartphone to computer. In the next section we provide more details of the GHAS including: an overview of the experimental design, technical details of survey development and deployment across the two modes, survey content, and key mode effect outcomes including loading times, questionnaire completion rates and times and primacy rates. The results of the mode effects tests for the key outcomes of interest appear in the third section followed by a brief discussion that includes implications for future survey research using smartphones.
2.
Materials and Methods
2.1 The Got Healthy Apps Study – Focus on iPhone Users
The Got Healthy Apps Study (GHAS) conducted a randomized experiment to compare mode effects for a survey completed via an iPhone mobile browser or online via a desktop/laptop computer web browser. Unlike the mode effects study presented by Zahariev et al. (2009) that compared an online survey with one taken via the Internet accessed from a variety of mobile devices, the GHAS utilized a single smartphone platform (i.e. the iPhone). Unlike the Petchev and Hill (2010) study, which provided smartphones to participants, the GHAS study screened for smartphone users who owned an iPhone to focus on native smartphone use. We believe this is a more natural setting to evaluate mode effects. Our focus on iPhones predicated on minimizing the complexity in survey development by focusing on a single device manufacturer offering a common web browser, uniform browser size and consistent hardware. The iPhone also provided a unified user experience, which was another key factor in our decision to use the iPhone platform for the mode of our experiment. At the design phase of the study, we posited that developing for a single operating system would offer tighter control on the survey interface and consequently improve the user experience. The recent work of Bosnjak et al. (2010) motivated this focus by reporting that perceived enjoyment was among the key factors related to mobile survey participation. Zahariev et al. (2009) reported that respondents completing the survey via the iPhone were more likely to enjoy the survey experience
compared to mobile respondents using other devices. We designed the GHAS survey (described more detail in a subsequent subsection) to collect information about the use of health and wellness related apps that consistently appeared in the Top 10 lists within either the overall, health and fitness, lifestyle or medical categories of the iTunes App Store between June and December of 2010. We also wanted to target a smartphone platform with a fair number of users within the 30-54 year old age group (i.e. typical age range for many wellness-related activities) and NielsenWire (2009) estimates roughly 40% of iPhone users are within this age range.
2.2 Data Source and Experimental Design
Survey Sampling International Incorporated’s (SSI) recruited participants for the GHAS mode effects experiment from their Opt-in Online Panels targeted to adults 18 and older. These panels typically complete Internet surveys via computer or laptops enabled with Internet access. A subset of adult SSI panelists were screened for iPhone ownership and a random subset of those reporting current ownership received further demographic screening questions based on age, sex and education. In particular, noting that many health related prevention activities begin after age 40 (U.S. Preventative Task Force, 2009) and that use of health related apps for prevention and disease management was one of the primary goals of this study, we categorized age into two groups – less than 40 and at least 40 and used this age-group variable formed the first demographic screening question. Also noting that survey participation in online surveys has been demonstrated to vary by sex (Smith, 2008 and Sax et al., 2003) and that the use of various health related apps may indeed vary by age and sex (i.e. males over 40 would not be likely to report use of pregnancy related apps) and that prevention guidelines vary by disease, age and gender, sex was included as a second screening factor. Finally, we note that health literacy levels, including the awareness and use of prevention resources, have been demonstrated to vary by demographic and education factors (Williams et al., 1995 and Nurss et al., 1997), and noting that smartphone ownership may also be related to both age and education (Smith, 2010) we incorporated a two-level education variable (i.e. less than a Bachelor’s Degree versus at least a Bachelor’s degree) as the final component to the blocking.
Respondents who completed these additional screening questions were then randomly assigned to survey mode based on a randomized complete block design with replicates within each block and a single between-person factor. More specifically, recruited panelists were randomly assigned to complete the survey via iPhone or Computer (i.e. between person factor) in a ratio of 3-to-1 within each of 8 stratification-blocks formed by combining age-group (i.e. less than 40 vs. 40 or older), educational attainment (i.e. less than Bachelor’s versus Bachelor’s or more) and sex. We note the 3-to-1 ratio used in anticipation of a hypothesized differential non-response, recruitment and participation among those online panelists assigned to participate in the study using their iPhone. Panelists received a $4.00 (iPhone) or $2.00 (Computer) incentive for completing the survey based on assigned mode. We used the differential incentive to compensate iPhone users for any burden incurred to their data plan for survey access and data transmission. The Saint Louis University Behavioral Sciences Institutional Review Board approved the study in March of 2011 and the data for this study were collected between May 2, 2011 and May 5, 2011.
2.3 Survey Invitation Protocol
SSI provided each respondent with a secure web address that contained the secure server access followed by the panelist’s 9-10 digit id followed by a mode indicator. All initial invitations were sent over messaging services intended for desktop computer or laptop computer users enabled with an internet connection. Each panelist was provided a unique URL that directed them to a secure server that was
hosting the survey and storing all data. The URL was designed to be free of any special characters and also free of standard internet protocols for passing information from within the web address. This decision was an important respondent burden consideration because we believed that since panelists were recruited from an online panel with typical computer internet invitation, many assigned to iPhone completion would have to manually type the address into their iPhone’s web browser. We did not want the data entry of the web address to be cumbersome or contribute to a decline in response propensity. In particular, the simplified study URL was given by: http://mobilehealth.slu.edu/1234567890B where the 9-10 digits following the "/" represented the panelist's unique study id and the final letter (either A or B) represented the assigned mode of completion. Both the panel id and the mode of completion were assigned to each recruited panelist by the survey vendor. Once the respondents entered our secure server (note: the http:// became https:// whenever the link was entered into the browser) we automatically detected their id, mode assignment and type of device they were using to access the web site.
To facilitate compliance for survey completion in the assigned mode we incorporated “splash” pages that would redirect respondents to point their web browser to the panelist specific web address on the appropriate survey mode (which our server detected from the mode indicator in the web address assigned to each randomized panelist). For panelists assigned to complete the survey via iPhone who reached our study cite via their computer, the splash page requested them to point their iPhone web browser to the study website (that contained their unique URL) and informed them that survey completion was optimized for completion via an iPhone. There was also a text field which provided panelists an opportunity to request the survey web link be sent to their iPhone via a text message. Respondents assigned to complete the survey via the computer who accessed the survey link via their iPhones also received a redirect page (optimized for viewing with their iPhone browser) that informed the panelist that the survey was optimized for completion on their laptop/desktop. The redirect page also included the panelist's unique survey URL.
2.4 Survey Development and Deployment:
We developed the GHAS survey to be accessed as an online web-based survey (i.e. accessed via an Internet connection on either a desktop or laptop computer) or accessed using the web-browser on an iPhone. While not an app, the iPhone version of the survey behaved more like an app than an online survey. Specifically, we used an app-like mobile web browser survey approach previously described by Buskirk and Andrus (2012) that maximized the use of native iPhone features such as spin wheels and loading pinwheels within what appears to the user as a self-contained browsing session (i.e. the browser address bar was masked throughout the session and specific parts of the survey pages including back and next buttons were pre-loaded at the survey entry screen.) More technical details of the specific programming aspects and other implementation details of this approach are described in Buskirk and Andrus (2012). While it was not possible to make the two versions of the survey completely identical because of form factor differences between iPhone and computer browsers (Koch, 2010), we did attempt to create the most identical experience as possible on both platforms. To that end we limited the number of questions per screen to 4 for the computer version and 2 for the iPhone version to limit excessive scrolling for iPhone participants as well as to minimize the number of questions that at first glance would appear hidden. We also chose a layout for the iPhone version that would imply scrolling to the respondent (i.e. a part of the next question or answer choice appeared within the displayed page giving the respondents a clue that scrolling was needed to read the remainder of the question/responses). The back and next buttons were also placed at the top of the displayed pages for both the Computer and iPhone versions of the survey.
2.5 GHAS Survey Content
The GHAS survey contained questions organized into one of six main subsections. Specifically, the first section screened respondents for the number of cell phones owned. The second section, “Your APPS,” contained: questions related to total number of apps currently loaded and retained on the phone and the breakdown of free and paid apps. The third section, “Health and Lifestyle,” asks a series of wellness questions including: weight, exercise, physician visits, pregnancy and history of diabetes. We modeled the question wording for a majority of questions in this section after the 2011 Behavioral Risk Factor Surveillance System (BRFSS) survey. The fourth section, “APPS You Use,” involved questions related to the ownership and use of health and wellness related apps from 6 broad categories including: weight management, exercise, sleep, pregnancy, diabetes and medical information. The categories of inquiry in section 4 were based on the answers provided to the questions posed in section 3. An app icon recognition experiment was included in the fifth section, “APP Check,” followed by the final section, “Your Phones,” which contained questions related to the type of iPhone, sharing, landline phone ownership and the use of email and mobile web browsers. Altogether there were a total of 120 survey questions possible for all respondents, but the actual number of questions posed was a function of skip patterns based on apps owned, prevention activities and the ways in which respondents used their phones. The complete survey can be accessed via an iPhone at https://mobilehealth.slu.edu/demo/b or via a computer at
https://mobilehealth.slu.edu/demo/a.
2.6 Primary Study Outcomes and Analysis Methods
We grouped the primary study outcomes for the GHAS survey mode experiment into two broad categories including: (1) recruitment and response related outcomes such as use of the text messaging option, redirect rates and errors in survey web address and survey participation; and (2) survey completion related outcomes including total time required to complete survey questions, number of questions asked and item missing rates and the prevalence of primacy responses and open-ended text responses.
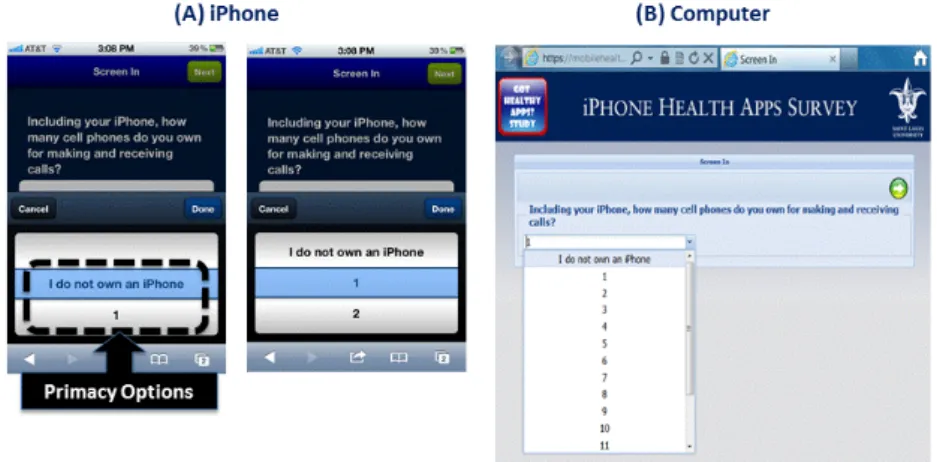
For the purposes of this study, primacy questions were those that required the iPhone respondents to scroll in order to see all possible answer choices. For these questions the degree of scrolling required to see all available answer choices on the computer was much less, or nonexistent, and depended upon browser screen size. A primacy response to these types of questions was indicated if the respondent chose at least one option among those initially visible on the iPhone screen without any scrolling as illustrated in Figure 1.
Mode effects for continuous outcomes measured for the entire sample (or nearly the entire sample) such as completion time were evaluated using the van Elteren (1960) statistical test. This nonparametric test extends the Wilcoxon rank sum test to stratification/block designs and allows for the evaluation of the main effect of survey mode while controlling for the stratification/blocking variable (Lehman, 1975). Differences across mode were evaluated using a Mann Whitney test without accounting for the stratification/block group for continuous variables measured on a smaller subset of respondents (i.e. distribution of responses from a slider bar questions with skip pattern qualifiers). Finally, differences in item missing rates and primary response rates across the two modes were analyzed using either a Poisson or Negative Binomial regression model with main effects for both survey mode and stratification/block group and the interaction between these two design variables and an offset for the total number of questions posed for the respondent.
Figure 1: A screenshot of a GHAS Survey Primacy Question presented in iPhone version (A) and computer version (B). The primacy responses are those that appear in left pane of (A). Any response options other than those shown in (A) constituted non-primacy responses (i.e. 2 or more).
3.
Results
We present the results of the GHAS mode effects experiment by category starting with the survey participation related outcomes, followed by survey completion outcomes.
3.1 Randomization and Survey Participation Outcomes
3.1.1 Survey Completion and Randomization
A total of 16,051 panelists were exposed to the iPhone ownership screening question. The recruitment and response outcomes are visually depicted in Figure 2. As expected, there were no significant differences in the distribution of stratum membership across mode for assignees (χ2
(7)=3.94; p-value=0.79). A total of 312 (95.1%) computer and 332 (33.8%) iPhone assignees initially responded to the survey invitation and entered the website.
Figure 2: GHAS Recruitment and Response Distribution Diagram.
The total in-survey drop-off rate among eligible computer respondents was 28.4% compared to 30.9% for eligible iPhone respondents. While there are very little differences in the in-survey drop-off rates, the location of drop-off varied
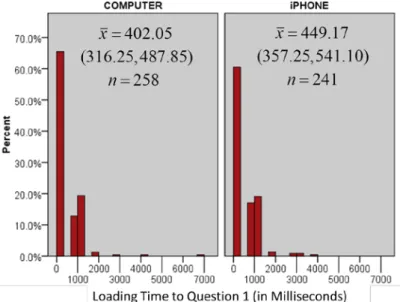
considerably across the two modes with the bulk of these occurring within the intro section for iPhone, compared to those occurring in later sections for computer respondents. We note that loading times for the first screen of the GHAS survey were on average about 50 milliseconds longer for respondents using an iPhone compared to those using a computer as demonstrated in Figure 3 and while these differences were not statistically significant, they may be practically related to a respondent’s decision to carry on or drop off the survey.
Figure 3: Distribution of GHAS survey question 1 screen loading times by mode. Even though the drop-off rates between the two modes were consistent, completion rates were significantly different by assignment stratum (Wald χ2 (7)=39.026, p-value <0.0001) and mode (Wald χ2 (1)=174.402, p-value<0.0001) consistently across stratum (i.e. mode-by-stratum interaction was not significant: χ2 (7)=7.493, p-value=0.379). We note there were no significant differences in the distributions of completing respondents over the 8 stratification block groups between the two survey modes (χ2
(7)=11.09, p-value=0.14).
3.1.2
Redirect Webpages, SMS Requests and ID Errors
:In total, 118 (100 iPhone, 18 computer) of the 644 assignees who visited the GHAS survey website first entered via a redirecting webpage. Ninety-three of these assignees did not revisit our study cite while the remaining 25 navigated to the main page using the assigned survey mode. The proportion of iPhone assignees who encountered the redirect webpage was significantly higher than that of computer assignees (i.e. 30.1% versus 5.8%, respectively; Fischer’s exact p-value <0.0001) which seems logical since the initial invitations went to members of an online computer panel via their preferred panel email. We also note that 15 of these 100 iPhone assignees requested an SMS from the redirect webpage and five requested a second SMS.
A total of twelve of the 221 (5.4%) iPhone completes entered an incorrect study id in the web-site address. These respondents accessed the survey web page using their iPhone by typing in the study website manually. The two main types of errors included a missing digit and an incorrect digit (e.g. one-offs – 3 instead of 4, 5 instead of 6, etc.). While the error incidence in low here we note our study web address was relatively straightforward and did not include special characters.
3.2.1 Questionnaire Completion Times and Number of Survey Items Asked
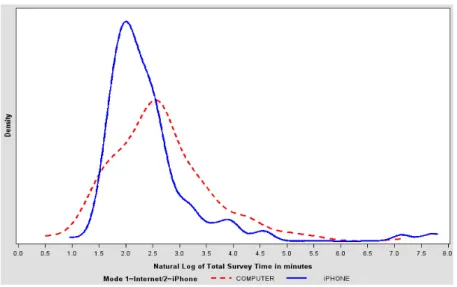
Significant differences were noted for the distribution of survey completion times across the mode controlling for strata. On average, computer users took nearly twice as long to complete the survey as iPhone respondents. This large difference could in part be explained by the presence of four very extreme outliers observed among computer respondents. The completion times for these two male and two female, under 40 and less than Bachelor’s degree respondents ranged from 160 (> 2.6 hours) to over 1330 minutes (>22 hours). Questionnaire completion times across mode were still significantly different with these outliers removed, even after accounting for strata/block group (van Elteren Statistic=17.9; p-value <0.0001) with computer respondents taking, on average, nearly 5 minutes more to complete the survey compared to iPhone respondents (median difference was just over 4 minutes) as shown in Figure 4.
Figure 4: Distribution of survey completion times by mode on the natural log scale (all observations were included here);
While survey times across mode differed, the distribution of total number of questions posed to computer and iPhone respondents was not significantly different after controlling for stratification/block group as shown in Table 1. In particular, the median number of questions posed for each of the groups, overall was 46 (out of a total possible 120).
3.2.2 Missing Item and Primacy Outcome Selected Rates
Although the total number of questions asked was generally less than the total possible for respondents from both modes, the answers to asked questions were generally rather complete regardless of mode. Table 2 provides descriptive statistics by mode for the missing item rates. Due to overdispersion, differences in item missing rates across the two modes were thus modeled using a negative binomial model and there were no significant differences in missing item rates across mode (χ2
Table 1: Descriptive statistics for the survey completion related outcomes by mode.
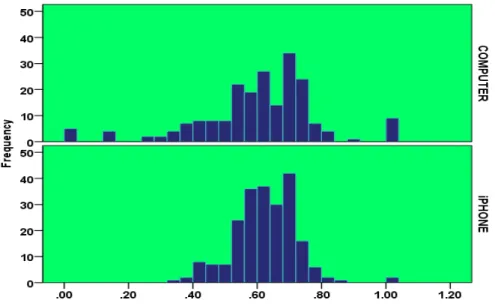
Despite a possible 52 primacy response questions for the GHAS survey, the actual number asked was no larger than 28 for iPhone and 33 and for computer respondents. The median number of primacy response questions asked for each mode was 17 and there was no apparent overdispersion in individual rates of primacy response selections across the two modes as illustrated in Figure 5 and Table 1.
Figure 5: Distribution of the “primacy” option selection rates across the two modes. While the rate at which primacy options were selected was approximately 7% larger for iPhone respondents compared to computer respondents, consistently across stratification/block group, this difference was not statistically significant in the Poisson regression model with main effects for both mode and stratification/block group (χ2
(1)=4.76; p-value=0.03). It is interesting to note that the percentage of respondents who had primacy rates of 100 was higher among those assigned to the computer (4.3%) compared to those assigned to iPhone (0.9%) (Fisher’s exact test p-value=0.03).
3.2.3 Open Ended Items
A survey respondent could have received up to 6 open-ended items requesting the names of “other” apps if the respondent answered that they used an app other than what was listed from the weight, exercise, sleep, pregnancy, diabetes and medical information categories. Ninety-one (21%) respondents selected at least one “other” app from among the six categories and of those only 4 did not provide any additional information in the open-ended field (2 from iPhone and 2 from computer mode). The median number of characters typed for the names of all other apps reported was 11 for both modes and there were no significant differences found in the distribution of the total number of characters entered [Table 1] and Figure 6.
Figure 6: Distribution of the total number of characters entered for “other” app names by survey mode.
4.
Discussion
Our study recruited iPhone users from a broader U.S. online panel in an experimental design aimed to maximize internal validity for the sole purpose of examining mode effects. We thought that because these panelists typically received survey invitations via email, some assigned to iPhone may manually enter the study’s survey URL. To reduce potential respondent burden we used a short and simple URL that contained their panel id and assigned mode without the use of any special punctuation or symbols. The few detectable manual data entry errors that we encountered were either, one offs (e.g. typing a 5 instead of 6), repeating a digit too many times (e.g. 111 instead of 11) or digit omission (e.g. 134 instead of 1234).
To maintain the randomization we used redirect webpages encountered if a panelist assigned to complete via iPhone (or computer) accessed our survey via their computer (or iPhone). There were nearly 5.5 times as many iPhone-assigned panelists that first reached our website via a redirect webpage compared to computer-assigned panelists. Certainly an intentional advantage of the redirect pages was preserving experimental conditions; however, an unintentional byproduct was a decrease in participation. Nearly 80% of the panelists who encountered the redirect webpage did not persist to complete the study using the assigned survey mode and only a small percentage actually requested the survey URL via text message. While we cannot infer that the redirecting webpage caused non-participation, it could have contributed to it by discouraging iPhone assigned panelists who had interest in completing the survey only via computer. In this experiment we did not have a
“panelist choice” option, but one could envision how this could add value to the current research landscape.
While the overall drop-off rates were slightly higher for iPhone compared to computer panelists who started the survey, but did not complete it on their assigned mode, the majority of drop-off from the iPhone occurred earlier in the survey. Computer assignees tended to drop off in later sections of the survey at varying rates. We note that drop offs here could be because the respondent (a member of an online survey panel) might have realized that the truly had to complete a survey on a smartphone (rather than on a computer) and decided to terminate.
Overall GHAS survey completion rates among randomly assigned panelists were significantly different by stratum and mode (consistent across stratum). Completion rates were highest among the <40, <BS Male category followed by <40, <BS Female (both above 60% in the computer mode and nearly 35% in the iPhone arm). These results are especially promising and are counter to what much of the literature has suggested about difficulties to reach “younger males”. In contrast, the lowest completion rates were noted for both the >=40, <BS Male and Female subgroups reporting just under 50% completion in the computer mode and just above 10% in the iPhone mode. We note that the completion rates for the >=40, BS or more groups were slightly higher than these. We also note that generally differences by gender were non-existent for both recruiting and completion outcomes.
Respondents assigned to iPhone had significantly shorter survey completion times compared to those completing the via computer, even though the two sets of respondents received on average, approximately the same number of survey items. We suspect that computer users may have started the survey in one setting and completed it in another. The extent to which smartphone users multitask across apps, programs (e.g. email or marketplace) and services (e.g. video chat or SMS) is not well known and should be explored more fully in the survey research environment. In any case, knowing how multitasking might contribute to delays in survey completion or breakoff would inform best practices for survey completion reminders which may differ from what is currently prescribed for online computer surveys. Finally, no significant differences were found in the distribution of the number of characters entered for the names of “other” apps. The implication here is that direct, open ended questions may be reasonable to ask in Smartphone surveys with comparable data quantity/quality by mode. More experimentation around open ended questions is needed across platforms and operating systems, however. Related to this result was the lack of differences in the distribution of the proportion of times iPhone and Computer respondents chose the one of the “primacy” options available. While it is entirely possible that a respondent could have scrolled through all of the choices on their respective devices for these questions and then selected the primary options, we at least note that nearly 50% of iPhone respondents had to scroll to select their choice for the at least half of the primacy questions. This finding demonstrates that iPhone respondents were not in general speeding through the survey selecting only the options that appeared on the screen without having to scroll.
While our study design maximized internal validity for the express purpose of comparing mode effects the results/estimates presented here may not have a large degree of external validity. For example, online panelists who were recruited for this study owned iPhones, and the results of their survey completion outcomes may not apply to smartphones using alternate operating systems. The results of the GHAS also focused on mode effects between iPhone online to computer online surveys and may not apply to surveys completed using an iPhone via voice or SMS service. The
lack of differences across the modes does not imply equality across modes (as is the case in standard hypothesis frameworks). So additional studies are needed to further corroborate and extend the results presented here. In the era of lower response rates for many traditional survey modes, the excitement of the smartphone may create more engagement and interest among potential respondents and appears to be a promising mode for survey data collection that should be explored more fully.
Acknowledgements
This study was conducted while the primary author was a faculty member at Saint Louis University with funding from Presidential Research Award number 230011. We would also like to thank Chris Gorrell and Dr. Mark Gaynor for their assistance during the design phase of the project.
References
AAPOR Cell Phone Task Force. “New Considerations for Survey Researchers When Planning and Conducting RDD Telephone Surveys within the U.S. With Respondents Reached Via Cell Phone Numbers,” Lenexa, KS: American Association of Public Opinion Research; 2010. Available at:
http://aapor.org/AM/Template.cfm?Section=Cell_Phone_Task_Force&Temp late=/CM/ContentDisplay.cfm&ContentID=2818 , accessed June 10, 2012. Blumberg SJ, Luke JV. Wireless substitution: Early release of estimates from the
National Health Interview Survey, July-December 2010. National Center for Health Statistics. June 2011. Available from:
http://www.cdc.gov/nchs/nhis.htm.
Bosnjak, Michael, Gottfried Metzger, and Lorenz Gräf. 2010. "Understanding the Willingness to Participate in Mobile Surveys: Exploring the Role of Utilitarian, Affective, Hedonic, Social, Self-Expressive, and Trust-Related Factors." Social Science Computer Review 28:350-370.
Brick, J. Michael, Pat D. Brick, Sarah Dipko, Stanley Presser, Clyde Tucker, and Yuan Yangyang. 2007. "CELL PHONE SURVEY FEASIBILITY IN THE U.S.: SAMPLING AND CALLING CELL NUMBERS VERSUS LANDLINE NUMBERS." Public Opinion Quarterly 71:23-39.
Buskirk, TD. (2011) “Making Surveys As Smart As Your SMARTPHONE,” Shortcourse Presented at the 36th Annual Meeting of the Midwest Association of Public Opinion Research (MAPOR), Chicago, IL. Buskirk, Trent D. and Charles Andrus. 2012. “Smart Surveys for Smart Phones:
Exploring Various Approaches for Conducting Online Mobile Surveys via Smartphones” Survey Practice, February: www.surveypractice.org.
Callegaro, M. and T. Macer. 2011. "Designing Surveys for Mobile Devices: Pocket-sized Surveys that Yield Powerful Results." in 66th American Association of Public Opinion Research Conference. Phoenix, AZ.
Callegaro, Mario. 2010. “Do You Know Which Device Your Respondent Has Used to Take Your Online Survey?” Survey Practice, December:
www.surveypractice.org.
Couper, M.P. 2010. "Visual design in online surveys: Learnings for the mobile world." in Mobile Research Conference 2010. London, UK.
Elteren, P. H. van. 1960. "On the combination of independent two-sample tests of Wilcoxon." Bulletin of the International Statistical Institute, pp. 351-361. Fuchs, Mark. 2008. "Mobile Web Surveys: A Preliminary Discussion of
Methodological Implications." Pp. 77-94 in Envisioning the Survey Interview of the Future, edited by F. Conrad and M. Schober. Hoboken, NJ: Wiley.
Koch, P-P. (2010) Smartphone Browser Landscape, A List Apart Article No. 320, available at http://www.alistapart.com/articles/smartphone-browser-landscape/ (accessed on October 30, 2011)
Lehmann, E. L. and H. J. M. D'Abrera. 2006. Nonparametrics : statistical methods based on ranks. New York: Springer.
Link, MW and Buskirk, TD. (2012) “The Role of New Technologies in Powering, Augmenting, or Replacing Traditional Surveys,” Shortcourse Presented at the 67th Annual Meeting of the Americaon Association of Public Opinion Research, Orlando, FL.
Nielsen Wire. 2009, " iPhone Users Watch More Video… and are Older than You
Think", Retrieved April 20, 2011,
( http://blog.nielsen.com/nielsenwire/online_mobile/iphone-users-watch-more-video-and-are-older-than-you-think/).
—. 2012, "Smartphones Account for Half of all Mobile Phones, Dominate New Phone Purchases in the US", Retrieved April 20, 2012, ( http://blog.nielsen.com/nielsenwire/online_mobile/smartphones-account-for-half-of-all-mobile-phones-dominate-new-phone-purchases-in-the-us/). Nurss, Joanne R., Imad M. El-Kebbi, Daniel L. Gallina, David C. Ziemer, Victoria C.
Musey, Stephanie Lewis, Qinghong Liao, and Lawrence S. Phillips. 1997. "Diabetes in Urban African Americans: Functional Health Literacy of Municipal Hospital Outpatients With Diabetes." The Diabetes Educator 23:563-568.
Peytchev, Andy and Craig A. Hill. 2010. "Experiments in Mobile Web Survey Design." Social Science Computer Review 28:319-335.
Centers for Disease Control and Prevention. 2011, "Behavioral Risk Factor Surveillance System Questionnaire", Retrieved April 10, 2012, (http://www.cdc.gov/brfss/questionnaires/pdf-ques/2011brfss.pdf).
Rainie, Lee, Kathryn Zickuhr, Kristen Purcell, Mary Madden, and Joanna Brenner. 2012, "The Rise of E-Reading", Retrieved April 21, 2012, (http://libraries.pewinternet.org/files/legacy-pdf/The rise of e-reading 4.5.12.pdf ).
Sax, Linda J., Shannon K. Gilmartin, and Alyssa N. Bryant. 2003. "Assessing Response Rates and Nonresponse Bias in Web and Paper Surveys." Research in Higher Education 44:409-432.
Smith, Aaron. 2010, "Mobile Access 2010", (http://pewinternet.org/Reports/2010/Mobile-Access-2010.aspx).
—. 2011, "Smartphone Adoption and Usage", (http://www.pewinternet.org/reports/2011/Samartphones.aspx).
Smith, William G. 2008. "Does Gender Influence Online Survey Participation? A Record-Linkage Analysis of University Faculty Online Survey Response Behavior."
Steeh, Charlotte, Trent D. Buskirk, and Mario Callegaro. 2007. "Using Text Messages in U.S. Mobile Phone Surveys." Field Methods 19:59-75.
Townsend, Leslie. 2005. "The Status of Wireless Survey Solutions: The Emerging "Power of the Thumb."." Journal of Interactive Advertising 6:52-58.
U.S. Preventative Services Task Force. 2009, "Aspirin for the Prevention of Cardiovascular Disease", Retrieved May 7, 2011, (http://www.uspreventiveservicestaskforce.org/uspstf/uspsasmi.htm).
Vicente, Paula, Elizabeth Reis, and Maria Santos. 2009. "Using mobile phones for survey research." International Journal of Market Research 51:613-633. Williams, Mark V., Ruth M. Parker, David W. Baker, Nina S. Parikh, Kathryn Pitkin,
Wendy C. Coates, and Joanne R. Nurss. 1995. "Inadequate Functional Health Literacy Among Patients at Two Public Hospitals." JAMA: The Journal of the American Medical Association 274:1677-1682.
Zahariev, M., C. Ferneyhough, and C. Ryan. 2009. "Best Practices in Mobile Research." in ESOMAR Online Research. Chicago, IL.
Zuwallack, Randal. 2009. "Piloting Data Collection via Cell Phones: Results, Experiences, and Lessons Learned." Field Methods 21:388-406.