(Draft version)
Could gender wage discrimination explain regional
differences in productivity?
Melchor Fernández
Universidade de Santiago de compostela
Yolanda Pena-Boquete
Universidade de Vigo Abstract
Human capital and productive structure could account for an important part of the differences in productivity between Spanish regions; nevertheless we consider that gender wage discrimination could also have effects on it. The existence of a degree of discrimination means that there is a wage differential in which employer prefer to hire less productive workers instead of discriminated workers. Thus, the cost of producing a unit of product would be higher than the cost of producing without discrimination, i.e. discrimination could has effects on productivity. Based on Becker (1957) we develop a maximization problem with discrimination using an aggregate production function with constant elasticity of substitution (CES). As a result, we get a productivity function depending on discrimination and other traditional factors such as wages or production. Our results show that the discrimination growth hast a negative and significant effect on productivity for the Spanish regions.
Introduction
In last years, European policy-makers have focused on competitiveness and gender equality as independent concepts or even as opposite forces. Nevertheless, are these two concepts complete independent?
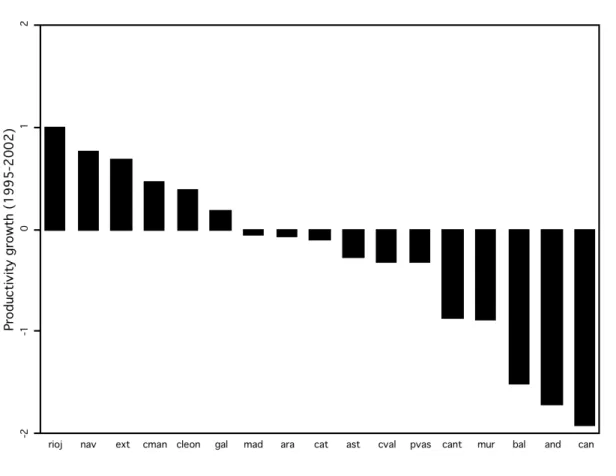
One of the main factors accounting by competitiveness seems to be productivity (Krugman, 1996 and Porter, 1990).1 As a result European institutions are worry about the productivity of their Member States, especially about those countries such as Spain which have not shown any productivity growth in last years. Gómez-Salvador, R. et al. (2006) and Sibert, A. (2007) confirm a decline of the labour productivity growth in Spain since the mid-1990s. Nevertheless, this fact hides important differences between Spanish regions.2 Actually, regions such as La Rioja or Navarra show positive growth
rates during the period 1995-2002 while other regions as Andalucía or Canary Islands show an even negative productivity growth (see figure 1). The opposite performance of Spanish regions gives to Spain (in average) a productivity growth close to zero.
How could explain theses differences? Human capital and productive structure could account for an important part of the differences in productivity between Spanish regions (Cuadrado Roura, et al. 1999). Nevertheless, in this paper we attempt to underline the importance of other possible factor: the gender wage discrimination. Thus, we base on discrimination literature in order to prove that a loss of productivity is one of the mains outcomes of discrimination.
1 National competitiveness is an ambiguous concept. In fact, Krugman (1996) points out several reasons against the idea of national competitiveness. He argues that firm success would often be at the expense of another, while the success of one country could creates rather than destroys opportunities for others. 2 Spain is constituted by 17 regions which show important economic, cultural and social differences among them.The economic differences have been analysed many times and the different public administrations have made an important legislative and economic effort in order to reduce them (Cohesion Policy, European and Spanish regional policy)
Figure 1: Productivity growth for the Spanish regions (1995-2002)
Following neoclassic theory, where preferences are the main consequence of discrimination, there is neither inefficiency nor effects on labour markets.3 An employer
with preferences not related to productive efficiency has a disadvantage and they have higher costs than other employers. Consequently, in a free market they would be dropped out. Under the neoclassic theory, discrimination disappears in the long term and differences in preferences explain wage differential. Nevertheless, theories such as the monopsony power assert that frictions in the labour market may avoid the disappearance of discrimination. Empirical studies show that discrimination has not decreased over time as neoclassic authors supposed. Actually, in Spain discrimination has not decreased, and in regions as Galicia it has even increased (Pena-Boquete, 2009). Moreover, nor the gender pay gap neither the gender wage discrimination is homogeneous between Spanish regions. In fact, the degree of gender wage discrimination in 1995 goes from 14.32 for Castilla La Mancha to 27.29 for Murcia (Aláez and Ullibarri, 2000)
3 Taking individuals preferences as given make the automatic translation of different prices (wages) for the same good (job) in a loss of total utility impossible.
Since empirical research shows an important magnitude and persistence of discrimination in labour market, it is important to determine the effects of discrimination not only for an individual (at a microeconomic level) but also for the whole labour market (at a macroeconomic level). We argue that discrimination has consequences for the whole labour market, especially on productivity, and policymakers should realize about the need of correct this inefficiency.
In order to check the possible effect of the discrimination on productivity for the Spanish regions, we estimate a productivity function with discrimination. Thus, we develop a profit maximization problem with discrimination using an aggregate production function with constant elasticity of substitution (CES).
The structure of this paper is as follows: first, we explain the effects of a discriminatory behaviour, in order to show the relationship between discrimination and productivity. Second, we develop a problem of profit maximization including discrimination in order to get the productivity function. In the third section, we show the results of our estimations for the Spanish regions. Finally, we draw some conclusions.
1.
Theoretical approach: The relationship between
productivity and discrimination
Based on Becker (1957, 1971) if an individual has a “taste for discrimination”, he must act as if he were willing to pay something, either directly or in the form of reduced income, to be associated with some persons instead of others. Thus, when actual discrimination occurs, he must either pay or forfeit income for this privilege. Different agents, such as employers, co-workers, customers, unions, government may have this “taste for discrimination” and their consequences are different in the labour market.4 In this case we focus on the employers “taste for discrimination” because it could have effects on labour productivity.
4Based on the Becker theory, consequence of co-workers “taste for discrimination” is segregation. In this context, Becker argues that segregation eliminates wage discrimination. Nevertheless, perhaps segregation will not permit equal wages because workers are too few to allow economies of scale in production, recognizing that their numbers must staff all skill levels (e.g., women in construction sector).
Suppose an employer were faced with the money wage rate (wi) of a particular
factor; he is assumed to act as if wi(1+di) were the net wage rate, with di as his
discrimination coefficient against this factor. An employer discriminates by refusing to hire someone with a marginal value product greater than marginal cost. Thus, employer discrimination does not alter the criterion of profit maximation, and the ratio of any two marginal products (mpi) still equals the ratio of their net factor prices.
However, equilibrium factor combinations would be quite different in situations of discrimination from those obtained with classical assumptions: there would be a smaller demand for discriminated factors. Moreover, the cost of producing each unit of output would be greater than the minimum cost (without discrimination).5
Some researchers argue competitive forces eliminate discrimination since discrimination has effects on productivity. In this way, Arrow (1973) argues that competitive markets forces tend to drive discrimination toward zero in Becker’s model: “only the least discriminatory firms survive.” In the same line, Aigner and Cain (1977) may doubt that a mistaken behaviour, systematically overpay men relative to women, will persist in competitive markets Nevertheless, Becker (1957, 1971) points out the possibility of the existence of discrimination in the long run because the generality of entrepreneurial skills and the long run elasticity of other factors determine the persistence of a discriminating cost differential in the long run under competitive conditions.
Since empirical research shows a persistent and significant magnitude of wage discrimination, we should notice the consequences of discrimination in the aggregated labour productivity. Up to my knowledge, researches have tested the effects of disparities on labour market but not the effects of discrimination. Neoclassical macro
5 Although we are basing on Becker’s model we could extend similar conclusion using the statistical discrimination or the monpsony power. Moreover, as we said before, based on “taste for discrimination” or “statistical discrimination” there are a share of equally productive women, which are not hired due to discrimination, i.e. there is a share of less productive workers which are hired. Consequently, an increase of discrimination causes a loss of productivity. In the theory of monopsony this loss of productivity could be cause by lack of motivation. Moreover the those theories are not incompatible and they could coexist, Black (1995) develops a search model where a share of firms discriminates against minorities (women in our case) and the others have a certain monopsony power to pay less.
analyses of the direct effects of gender inequality on growth focus on education equity and the misallocation of labour. In addition to education, those analyses have placed in the foreground the indirect effects of the women’s entrance to the labour market on growth through changes in fertility.6 In any case, results are not very conclusive. While Esteve-Volard (2004) in a model applied to India, argues that in the short run, discrimination may act as a brake on economic growth and development,7 other authors such as Seguino (2002) argue exactly the opposite.8
Different authors such as Esteve-Volart (2000, 2004) and García-Miguez et al. (2003) point out the importance of estimating a macroeconomic model about the cost of discrimination on the aggregated output. The main idea is that gender discrimination is macroeconomically inefficient because the firms do not maximize its productive capacity. They find that these costs are indeed quite substantial. In this case they not measure wage discrimination but the discrimination in managerial positions using the share of women relative to men. Policy makers should be concerned since one of their main aims is to increase output per capita in the long run. These authors attempt to include the effects of discrimination on growth; nevertheless, they use gender differences instead of gender discrimination for testing their theories due to the difficult for measure discrimination.
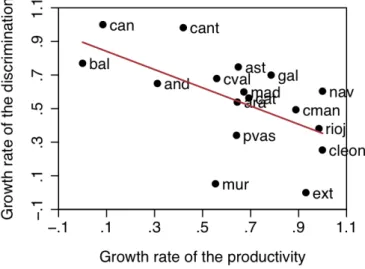
Figure 2 shows a clear relationship between the growth rate of the degree of gender wage discrimination and productivity for the Spanish regions.9 This relationship
6
Dollar and Gatti (1999) comment on the strongly negative coefficient of the fertility and they emphasize that “female education may well contribute to per capita income growth by reducing fertility and hence population growth”.
7 Her hypothesis is that gender discrimination against women in the market place reduces the available talent in an economy, which has negative economic consequences. Concentrating on the labour market, she examines three possible scenarios: the labour market equilibrium without discrimination; gender discrimination as an exogenous exclusion of females from managerial positions and gender discrimination as a complete exclusion of females from the labour market.
8 Seguino (2000) analyses the empirical impact of gender inequality on economic growth and he finds a positive relationship between gender inequalities and income growth. Confining the analysis to a set of semi-industrialized countries over twenty-one years (1975 to 1995), the data capture countries that have adopted an export orientation with a large share of exports produced in female-dominated manufacturing industries. The main hypothesis tested is that gender inequality which works to lower women’s wages relative to men’s is a stimulus to growth in export-oriented economies. Gender inequality leads to export expansion that leads to technical change resulting in economic growth. Busse and Spielmann (2006) confirm the same result.
9 Besides, the data has been standardized in order to avoid bias due to the magnitude of the variables. We standardized data as following:
is negative and it appears to be significant, i.e. and increase of the degree of discrimination results in a loss of productivity. But, does this relationship exist if we control for other variables? How should we include discrimination in the productivity function? We attempt to answer these questions in the following sections.
Figure 2: Relationship between the discrimination and productivity growth for the Spanish regions
2.
Methodology
In order to estimate the productivity function with discrimination we are going to develop the profit maximization problem describe by Becker (1957) but in aggregate terms. We assume an aggregate production function with constant elasticity of substitution (CES)10, with constant returns to scale and labour-augmenting technological change:
(1),
being yt the gross domestic product (GDP), Nt the employment, Kt the capital
stock, and Qt an index of labour quality (in this case, years of school completed). Where
a and c are positive, and b > -1.
standardized value which corresponds to the variable i for the region j, Sij the correspondent value not standardized, and mini and maxi correspond to the minimum and maximum.
Profit maximization under competition wt would be equal to the labour marginal
productivity (mpt), nevertheless under discrimination the mp would be equal to wt (1+dt)
(Becker, 1957). Using the production function (1) we get:
€ wt(1+d)=aQt yt QtNt ⎛ ⎝ ⎜ ⎞ ⎠ ⎟ 1+b (2)
Retaining the assumption of log linearity and rearranging the equation, this may be written:
(3)
being σ = 1/(1 + b) the elasticity of substitution. This equation rests on the hypothesis that labour is a freely variable input. To the contrary, empirical evidence show that varying labour entails adjustment costs and firms try to adjust gradually to the level implied by (2) rather than attempting to maintain it continually through time. That suggests a relation involving current and lagged output and employment, and the current real wage such:
being
3.
Empirical approximation
We analyse the case of gender discrimination since in our database the share of foreign people in labour market was minuscule, but we could do the same exercise with race discrimination.11
The most difficult aspect of the empirical approximation is to calculate discrimination. Difficulties for measuring discrimination12 in the labour market arise
11 Although the phenomenon of discrimination has common features, there are some differences depending on the group that suffers discrimination. For example women do not face the geographical concentration (ghettos) that ethnic groups suffer. In this case, we adapt the theoretical framework to gender discrimination, taking into account constraints imposed on women by the traditional time allocation due to domestic responsibilities.
because workers are not homogeneous and the characteristics that determine their individual performance, as cognitive and non-cognitive abilities (motivation, trust) or the scholar and familiar environment, are not observable. Additionally, observed differences between groups could appear as a result of free choice. There is not an agreement between researchers, and some consider that gender differences are due to discriminatory practices while others attribute it to differences in tastes or human capital investments. Different treatment based on different levels of productivity is not discriminatory. Some workers and occupations are more productive than others, reflecting different skills, qualifications and abilities. This leads to different returns at work and it is fair and efficient. Thus, a different treatment based on individual merit, such as talents, knowledge and skill is not discriminatory.13
From a technical point of view, we will say that wage discrimination exists when the gender wage gap cannot be attributed to differences in productivity. The traditional method to distinguish between wage differences due to productivity (attributes) or discrimination is the decomposition of Oaxaca (1973) and Blinder (1973). Nevertheless, we do not need just the discrimination for regions but also for industries, so we calculate individual discrimination and we aggregate it, as we need.
We estimate the individual discrimination14 relative to the wage a woman should earn is her attributes are paid at men’s prices (
€
ˆ
w fim), i.e. we estimate relative
discrimination ( € dfi) such that: € dfi = w ˆ fi m −w ˆ fif ˆ w mfi ⎛ ⎝ ⎜ ⎜ ⎞ ⎠ ⎟ ⎟
12 Before analysing the effects of discrimination on labour market outcomes, we should delimit the concept of discrimination. Then, what does discrimination mean? Discrimination in labour market means treating people differently because of characteristics that are not related to their merit or job requirements. These features include race, colour, sex, religion, political opinion, nationality and social origin. The International Labour Organization (ILO) defines discrimination in employment and occupation as “to treat people differently because of certain characteristics, such as race, colour or sex, which results in the impairment of equality of opportunity and treatment”. In other words, there is discrimination in labour market when two people are treated differently due to its race or sex, when race and sex do not have an effect on the productivity (Altonji and Blank, 1999).
13 From a legal point of view, a different treatment to meet the special needs of some individuals – and make sure that they have equal opportunities – is neither discriminatory. This is often known as affirmative action.
14 Wage that a woman should earn if her attributes are paid at men’s prices (
€
ˆ
w mfi) minus the wage she earn at women’s prices (
€
ˆ w fif)
Being and =0.5 . 15
After estimating the relative individual discrimination we have to use a measure in order to sum up all information to the indexes for industries and regions. Thus we adapt the poverty indexes of Foster, Greer and Thorbecke (1984) using the individual discrimination, as Del Rio et al. (2006) have proposed. These indexes show very desirable properties like continuity, dominion, symmetry, invariance to population replications, weak monotonocity and the weak principle of transferences and decomposability. The last property enables one to compute the indexes for subpopulations, allowing the estimation of degrees of discrimination for socioeconomic groups (industries in our case).
€ drα(vfi)= 1 n ⎛ ⎝ ⎜ ⎞ ⎠ ⎟
( )
dfi i=1 k*∑
α ,where k* would be the number of discriminated women and α a coefficient of “aversion to discrimination”. We use α = 1, so we aggregate individual degrees of discrimination in a simple way, i.e. all women have the same weight (in fact, this is equivalent to the second term of Oaxaca’s decomposition). Details of the databases used to estimate discrimination, productivity, wages and production are showed in the Annex.
We are not able to estimate a dynamic model since we have not enough observations, nevertheless we rearrange the equation and we can use the growth rates. We estimate to functions (including or not the production growth) to check the robustness of the results. Moreover, in both estimations we include regional and industries dummies to control the productivity effect due to differences in technology of different regions of industries.
15We estimate two ordinary Mincer wage equations by OLS, one for each sex, , i being each individual person, wi the individual hourly wage, an individual characteristics vector, β the estimated coefficients vector, and the error term. In the Mincerian equations we include both characteristics related to employees (potential experience, tenure and the level of studies completed) and job characteristics (occupation, time status, type of contract, firm size, type of aggreement and economic activity). In the annex we explain the variables in detail and the source, EES.
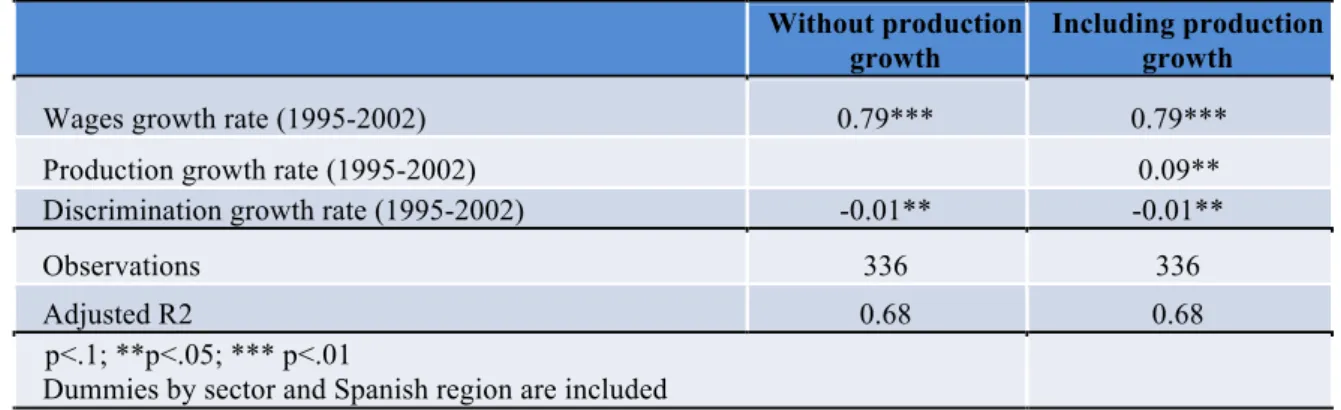
Estimations are robust and both equations show the same results. Estimations show that not only the wages and the production are significant variable for explaining the growth rate of the productivity, but also the discrimination growth. We get a negative and significant effect from the discrimination to the productivity growth.
Table 1: Results of the productivity function for Spanish regions Without production
growth
Including production growth
Wages growth rate (1995-2002) 0.79*** 0.79***
Production growth rate (1995-2002) 0.09**
Discrimination growth rate (1995-2002) -0.01** -0.01**
Observations 336 336
Adjusted R2 0.68 0.68
p<.1; **p<.05; *** p<.01
Dummies by sector and Spanish region are included
Thus, aggregated results would be consistent with the discrimination literature. As theory indicates the degree of discrimination has a negative impact on productivity for the Spanish regions, i.e. discrimination could have effects on competitiveness.
4.
Conclusions
A worry of the European Institutions is the low productivity growth of some member states such as Spain. Nevertheless, on the one hand, there are important differences in the productivity growth rates of the Spanish regions. On the other hand, discrimination theories point out productivity as an outcome of discrimination. For this reason the main aim of this paper was to show the linkage between productivity and gender wage discrimination.
Following the “taste for discrimination” by Becker (1957, 1971), an employer who has a taste for discrimination does not change their criterion of maximization profit, they include the disutility of hiring people from some groups (women) in their function. Although, the criterion of profit maximization has been not altered, the equal allocation of resources is different from neoclassic assumptions. Thus, on one hand, the factor of demand of discriminated workers would be lower. On the other hand, the cost
of producing a unit of product would be higher than the cost of producing without discrimination. Consequently, both the product by worker (productivity) and the female employment rate (discriminated group) would be lower. Preliminary results show a negative relationship between discrimination and productivity for the Spanish regions. But, does this result exist if we control for other variables?
Following this idea, we develop this maximization problem using a CES production function in order to get a productivity function, and to estimate if discrimination has effects on productivity. Results are in line with the literature and wages and production growth has significant and positive effects on productivity. Nevertheless, also the discrimination growth appears to be significant. Thus, results after control by other variables affecting productivity confirm that an increase of the degree of discrimination causes a decrease of productivity for the Spanish regions.
References
Aigner, D. J.; Cain, G. G. (1977): “Statistical theories of discrimination in labor markets”.
Industrial and labor relations review, 30:175-187.
Aláez, R; Ullibarri, M, (2000): Discriminación salarial por sexo: Un análisis del sector privado y sus diferencias regionales en España. ICE 789: 117–138
Altonji, J. G.; Blank, R. M. (1999): “Race and gender in the labor market” in Ashenfelter, O.; Layard, R. (eds.), Hanbook of labor economics, 3 (3): 3143-3259.
Arrow, K. (1973): “The theory of discrimination” in Ashenfelter, O. A.; Rees, A. (eds).
Discrimination in labor markets, Princeton University press, 3-33.
Baldwin, M.; Johnson, W. G. (1992): “A test of the measures of non-discriminatory wages used to study wage discrimination”. Economics Letters, 39(2): 223-227.
Barro, R. J.; Lee, J. W. (1994). “Sources of economic growth”. Carnegie-Rochester Conference Series on Public Policy, 40: 1-46.
Barro, R. J.; Sala-i-Martí, X. (1995): Economic growth. Mit press.
Becker, G. S. (1957) The Economics of Discrimination. University of Chicago Press, Chicago (revised in 1971).
Black, D. A. (1995): “Discrimination in a equilibrium search model”. Journal of labour economics, 13(2): 309-334.
Blinder, A. (1973): “Wage Discrimination: Reduced Form and Structural Estimates”. The Journal of Human Resources, 8(4): 436-455.
Burdett, K.; Mortensen, D. T. (1998): “Wage differentials, employer size, and unemployment”.
International Economic Review. 39 (2): 257-273.
Busse, M.; Spielmann, Ch. (2006): “Gender inequality and trade”. Review of International Economics, 14 (3): 362-379.
Cain, G. C. (1986): “The economic analysis of labour market discrimination”, in Ashenfelter, O.; Layard, R. (eds.), Hanbook of Labor Economics, vol. 1, North-Holland, Amsterdam. Cuadrado-Roura, J. R.; García-Greciano, B.; Raymond, J. L. (1999): “Regional convergence in productivity and productive structure: the Spanish case”. International Regional Science Review
22 (1): 35–53.
Dollar, D.; Gatti, R. (1999): Gender Inequality, Income, and Growth: Are Good Times Good for Women?. Gender and Development working paper nº 1
Esteve-Volart, B. (2000): Sex Discrimination and Growth, International Monetary Fund, working paper nº 84.
Esteve-Volart, B. (2004): Gender Discrimination and Growth: Theory and Evidence from India. Suntory and Toyota International Centres for Economics and Related Disciplines (STICERD), development economics Papers, nº 42
García-Mínguez, P.; Sánchez-Losada, F. (2003): “Statistical discrimination and growth: should we subsidize discriminated against workers?”. Economics Letters, 79(2): 255-261.
Gómez-Salvador, R.; Musso, A.; Stocker, M.; Turunen, J (2006): “Labour Productivity developments in the Euro Area” European Central Bank Occasional Paper no. 53.
Krugman, P. (1996) Making sense of the competitiveness debate, Oxford Review of Economic Policy, 12: 17-35.
Lucas. R. E. Jr.; Rapping, L. A. (1969): “Real Wages, Employment, and Inflation”. The Journal of Political Economy, 77(5): 721-754.
Manning, A. (2003): Monopsony in motion: imperfect competition in labour markets. Princeton University Press
Mincer, J. (1958): “Investment in Human Capital and Personal Income Distribution”. The Journal of Political Economy. 66(4): 281-302.
Oaxaca, R. L. (1973): “Male-Female Wage Differentials in Urban Labor Markets”.
International Economic Review. 14(3): 693-709.
Pena-Boquete, Y. (2009): “A comparative analysis of the evolution of gender wage discrimination: Spain vs. Galicia”. Papers in Regional Science. 88(1): 161-180.
Phelps, E. S. (1972): “The statistical theory of racism and sexism”. The American economic review, 62(4): 659-661.
Polachek, S. W.; Siebert, W. S. (1993): The economics of earnings. Cambridge University Press.
Porter, M. E. (1990): The Competitive Advantage of Nations. Free Press, New York. Robinson, J. (1933): Economics of imperfect competition, MacMillan. London.
Schwieren, C. (2003): The gender wage gap - due to differences in efficiency wage effects or discrimination? METEOR Discussion Paper. University of Maastricht.
Seguino, S. (2000): “Gender inequality and economic growth: A cross-country analysis”. World Development 28 (7): 1211-30.
Seguino, S. (2002): “Gender, quality of life, and growth in Asia 1970 to 1990”. The Pacific Review, 15 (2): 245-77.
Sibert, A (2007): “Labour Productivity Growth in the European Union”. Briefing paper for the Committee on Economic and Monetary Affairs (ECON) of the European Parliament for the quarterly dialogue with the President of the European Central Bank.
Thurrow, L. C. (1976): Generating inequality. The Macmillan Press.
World Bank (2001): Engendering Development: Through Gender Equality in Rights, Resources, and Voice. New York: Oxford University Press.
Annex
Estructura Salarial (EES, Wage Sructure Survey)
In order to calculate wage discrimiantion, the main source used is the Encuesta de Estructura Salarial (EES, Wage Structure Survey) elaborated by the INE for 1995 and 2002. It is a survey with a large number of observations, even though it does not represent the whole employed population. In fact, the reference population is constituted by employees working in establishments with at least ten workers involved in any economic activity other than agriculture, farming, fishing, Public Administration, Defence, Social Security, private households and extra-territorial organizations and bodies.16
We use this survey because it has a large sample size and it includes detailed information about wage-earners and about the establishments where they are employed. The Survey comprises a sample of workers at each firm and it consists of matched employer–employee data with a wealth of basic information used for our analysis on factors concerning the characteristics of the individual, job and workplace. Alternative surveys with individual level information on wages, like the ECHP, are all household surveys, thereby lacking the necessary matched employer-employee information. Their samples are significantly smaller and they don’t provide us with a regional dimension (with the only exception of ECHP in 2000). The richness of information in the EES data allows us to analyse the wage-determination process from both the demand and the supply side of the labour market.
Nevertheless, the use of this survey for the analysis of wage discrimination presents us with two main disadvantages. The first one is the lack of data concerning variables like working experience or marital status which are potentially significant for explaining the gender wage differential. However, the inclusion of marital status as a
16 The 1995 EES does not include the following activity groups: M (education), N (health and social work) and O (other community, social and personal service activities). All of these groups have been excluded from the analysis in order to maintain homogeneity between the two periods used in this work. Moreover, we have aggregated DB-DC activities and we have removed DF, since they had few observations.
determining factor of wage differentials is not widely accepted. Regarding working experience, we have calculated a proxy variable using age and education. A second disadvantage is that EES is limited to private sector wage-earners employed by medium and large size companies, excluding sectors such as agriculture, fishing or several services.17
Contabilidad Regional de España (CRE, Spanish Regional Accounts)
Regional Accounts are a specification of the National Accounts, i.e. Contabilidad Nacional de España (CNE, Spanish National Accounts) constitutes the conceptual and quantitative reference framework for the Contabilidad Regional de España (CRE). The CRE is a statistical operation that the Instituto Nacional de Estadística (INE, National Statistical Institute) has been carrying out since 1986. Its main objective is to offer a quantified, systematic and as complete as possible description of the regional economic activity in Spain. CRE does not have data about workers, but rather about jobs. It defines a full time job equivalent as the total number of hours worked divided by the annual average of hours worked in full time jobs. These concepts are considered more appropriate than the number of employees in order to approximate work factor consumption used in productive processes. Thus, it is more precise for estimating productivity because there are not problems about the equivalence of a part-time worker to a full-time worker and about double accounting of the workers employed in several jobs.
The Encuesta de Poblacion Activa (EPA, Active Population Survey)
The Encuesta de Poblacion Activa (EPA, Active Population Survey) is a quarterly household sample survey and it provides information on employment, unemployment and inactivity together with breakdowns by age, sex, educational attainment, temporary employment, full-time/part-time distinction and many other dimensions. Since 2005, in EPA the definitions of employment and unemployment, as well as other survey
17 The influence of these characteristics on the degree of wage discrimination is unclear. Not including public sector employees could lead to overestimating the degree of wage discrimination. Nevertheless, the lack of small-firm data and the inclusion of some private services sectors in which discrimination can be higher than average, could underrate the degree of wage discrimination. Both facts can be very important for the Galician economy in which 30% of wage–earners are employed in sectors not covered by the Survey. The incidence by sex of the excluded group is also quite diverse, 22% of male-wage-earning workers and 41% of female ones.
characteristics follow the definitions and recommendations of the International Labour Organisation (ILO).