RVC OPEN ACCESS REPOSITORY – COPYRIGHT NOTICE
This is the peer reviewed version of the following article:
Randau, M., Goswami, A., Hutchinson, J. R., Cuff, A. R. and Pierce, S. E. (2016) 'Cryptic complexity in felid vertebral evolution: shape differentiation and allometry of the axial skeleton', Zoological Journal of the Linnean Society. doi: 10.1111/zoj.12403
which has been published in final form at http://dx.doi.org/10.1111/zoj.12403.
This article may be used for non-commercial purposes in accordance with Wiley Terms and Conditions for Self-Archiving.
The full details of the published version of the article are as follows:
TITLE: Cryptic complexity in felid vertebral evolution: shape differentiation and allometry of the axial skeleton
AUTHORS: Randau, M., Goswami, A., Hutchinson, J. R., Cuff, A. R. and Pierce, S. E.
JOURNAL TITLE: Zoological Journal of the Linnean Society
PUBLISHER: Wiley
PUBLICATION DATE: March 2016 (online)
1 Contact information for proofs: [email protected]
1
Title: Cryptic complexity in felid vertebral evolution: shape differentiation and allometry of 2
the axial skeleton. 3
Short running head: Vertebral evolution in cats 4
Authors: Marcela Randau1*, Anjali Goswami1, John R. Hutchinson2, Andrew R. Cuff1,2, 5
Stephanie E. Pierce2,3. 6
Affiliation: 7
1 Department of Genetics, Evolution and Environment, University College London, United 8
Kingdom. 9
2 Department of Comparative Biomedical Sciences and Structure & Motion Laboratory, The 10
Royal Veterinary College, United Kingdom. 11
3 Department of Organismic and Evolutionary Biology and Museum of Comparative 12
Zoology, Harvard University, USA 13
*Correspondent: [email protected] 14
15
16
17
18
19
2 Abstract:
1
Members of the mammalian family Felidae (extant and extinct cats) are grossly 2
phenotypically similar, but display a 300-fold range in body size, from less than 1kg to more 3
than 300kg. In addition to differences in body mass, felid species show dietary and 4
locomotory specialisations that correlate to skull and limb osteological measurements, such 5
as shape or cross-section area. However, ecological correlates to the axial skeleton are yet 6
untested. Here, we build on previous studies of the biomechanical and morphological 7
evolution of the felid appendicular skeleton by conducting a quantitative analysis of 8
morphology and allometry in the presacral vertebral column across extant cats. Our results 9
demonstrate that vertebral columns of arboreal, scansorial, and terrestrial felids significantly 10
differ in morphology, and more so specifically in the lumbar region, while no distinction 11
based on dietary specialisation was found. Body size significantly influences vertebral 12
morphology, with clear regionalization of allometry along the vertebral column, suggesting 13
that anterior (cervicals and thoracics) and posterior (lumbar) vertebrae may be independently 14
subjected to distinct selection pressures. 15
Keywords: Allometry – Felidae – locomotion – morphology – vertebral column 16
17
18
19
20
21
3 Introduction:
1
The carnivoran family Felidae (Mammalia, Placentalia) includes ca. 37 living species of 2
grossly morphologically similar animals (Ewer, 1973; Johnson et al., 2006; MacDonald et al., 3
2010; Sunquist & Sunquist, 2002; Turner & Antón, 1996). With the exception of fur 4
patterning, body size is the greatest gross anatomical difference observed between species, 5
with the Felidae displaying a considerable body mass range from 1kg in the rusty-spotted cat 6
(Prionailurus rubiginosus) to over 300kg in the tiger (Panthera tigris). In addition to their 7
overall phenotypic similarity, felids are an exception to the general mammalian 8
biomechanical trend of size-correlated limb posture. According to this trend, increases in 9
body size drive increased limb erectness (i.e. joint extension) in order to maintain safe levels 10
of peak functional stresses acting on supportive tissues (Bertram & Biewener, 1990; 11
Biewener, 1989; Biewener, 2005). However, despite the 300-fold range in body mass in 12
felids, limb posture is remarkably uniform throughout the clade and, instead, some bone 13
allometry is observed in limb long bones’ cross-sections (Day & Jayne, 2007; Doube et al., 14
2009; Zhang et al., 2012). Indeed, it has been hypothesized that the lack of correlation 15
between body size and limb posture in felids may reflect a large-bodied ancestral condition 16
for the clade (Day & Jayne, 2007; Johnson et al., 2006; Mattern & McLennan, 2000; but see 17
Cuff et al., 2015). 18
Felids are also remarkably conservative in behavioural and ecological attributes, such as diet: 19
all felids are hypercarnivores specialised in vertebrate prey, with species differing mainly in 20
terms of prey size and prey-killing techniques (Carbone et al., 1999; Ewer, 1973; Sunquist & 21
Sunquist, 2002). Felid species are known to show different killing strategies in relation to 22
prey size, with bigger cats usually applying a sustained bite to the prey’s muzzle or neck, and 23
4 Macdonald & Loveridge, 2010). Interestingly, unlike other carnivorans such as canids, the 1
forelimbs of felids present a duality in function between locomotion and prey-killing 2
behaviour (Ewer, 1973; Gonyea, 1978; Leyhausen, 1979), and therefore, along with 3
differences in skull, mandible and dental shape, the shape of the forelimbs also reflect 4
diversification in prey size choice (Samuels & Van Valkenburgh, 2009a; Meachen-5
Samuels & Van Valkenburgh, 2009b; Meachen-Samuels, 2012; Slater & Van Valkenburgh, 6
2008; Slater & Van Valkenburgh, 2009). 7
Several recent studies have examined the shape, function, and evolution of mammalian limbs, 8
especially those of carnivorans (Alvarez, Ercoli & Prevosti, 2003; Meachen-Samuels, 2010; 9
Meachen-Samuels & Van Valkenburgh, 2009a; Samuels, Meachen & Sakai, 2013; Walmsley 10
et al., 2012). These studies have demonstrated that osteological measurements of the entire 11
limbs and of their individual segments are informative about locomotory habits, such that 12
qualitative reconstructions of the ecology of fossil species are possible by comparing their 13
morphology to better known living species. Within Felidae, these studies have additionally 14
shown that the limb morphology is informative about prey size specialisation and, 15
furthermore, that limb shape is related to hunting strategies in extant and, by inference, 16
extinct species (Meachen-Samuels & Van Valkenburgh, 2009b; Meachen-Samuels, 2012; 17
Meachen-Samuels & Van Valkenburgh, 2010). However, to date, the vertebral column has 18
been underrepresented in the morphological and biomechanical literature on felids and other 19
species, and is often treated as one functional segment, with few functional studies 20
considering the complexity and regionalisation of this structure in detail (but see Macpherson 21
and Ye (1998) and Jones (2015)). 22
The vertebral column has a critical role in body support against gravity, is connected to the 23
5 consecutive articulations that take active participation in locomotion and prey procurement 1
(Long, Adcock & Root, 2002; Macpherson & Fung, 1998; Macpherson & Ye, 1998; 2
Pridmore, 1992; Schilling, 2011). Different degrees of torsion, flexion-extension, and 3
bending capacities of the vertebral column are important components of movement at 4
different locomotor speeds and postures, and in the control of body deformations and 5
manoeuvres (Carlson, Halbertsma & Zomlefer, 1979; Gál, 1993b; Long et al., 1997; Molnar, 6
Pierce & Hutchinson, 2014; Pridmore, 1992; Smit, 2002). Changes in the size and angle of 7
vertebral processes reflect differences in the size of muscles, tendons and ligaments inserting 8
on those elements, and the relative length of centra is associated with the degree of movement 9
between two consecutive vertebrae (Koob & Long, 2000; Long et al., 1997; Pierce, Clack & 10
Hutchinson, 2011). Thus, morphological specialisations of vertebrae translate into functional 11
modifications in the flexibility and range of motion of the whole spine, as well as its role in 12
body support and general locomotor performance. 13
The vertebral column of placental mammals is largely constrained to a fixed number of 14
presacral segments, relative to other amniotes (Muller et al., 2010), with a few exceptions in 15
“southern” placental clades, Afrotheria and Xenarthra; Narita and Kuratani (2005). 16
Potentially due to this constraint in vertebral numbers, specialisation into discrete niches has 17
been accompanied by a diversification of vertebral shapes across placentals (Buchholtz, 18
2014; Buchholtz et al., 2012; Muller et al., 2010; Narita & Kuratani, 2005; Pierce et al., 19
2011). Although studies are limited, identification of correlated changes between vertebral 20
shape and various ecological attributes have extended our understanding of the behaviour of 21
living animals and aided in reconstructing the behaviour and ecology of extinct species 22
(Ánton & Galobart, 1999; Argot, 2003; Pierce et al., 2013; Pierce et al., 2011; Shapiro et al., 23
2005). Moreover, morphological specialisations of vertebrae have been associated with body 24
6 and large animals differ in the total length and flexibility of the lumbar column due to
1
different metabolic costs required to maintain stability and posture, with larger animals 2
having comparatively shorter, stiffer, and therefore more stable lumbar columns (Gál, 3
1993b). 4
In order to understand how extant felid ecomorphology and body mass have impacted the 5
size and shape of the postcranium as a whole, detailed data from the vertebral column are 6
required. Here, we investigate whether differences in ecological niche among felid species 7
are reflected in their vertebral shape. Specifically, we test if differences in the whole vertebral 8
column or in discrete regions of the spine (i.e. cervical, thoracic and lumbar regions) 9
discriminate the different locomotory styles and/or prey-size specializations observed in 10
extant cats. We also examine the effect of body size on felid vertebral evolution through 11
analysis of scaling across a large suite of biomechanically relevant measurements. In 12
accordance with Smeathers (1981), Gál (1993b) and most recently Jones (2015), we predict 13
that increases in felid body size are correlated with a decrease in the flexibility of the 14
vertebral column. Furthermore, based on these studies, we predict that this effect will be 15
regionally heterogeneous, with increased robustness and decreased flexibility focused 16
primarily at the posterior portion of the spine of larger species, while flexibility will be 17
maintained more anteriorly, providing a wider range of motion to the neck and thorax 18
associated with tackling prey. Combined, these analyses will allow us to assess the 19
importance of the vertebral column in the evolution of felid size, ecology, and locomotion. 20
21
Material and methods: 22
7 Species and specimens. – The data set is composed of 24 specimens representing 22 1
extant felid species, which is ~62% of total number of species in the family (Figure 1). The 2
chosen species embody the full phylogenetic breadth of extant felids, with each of the eight 3
identified clades (Johnson et al., 2006) represented by at least one species. The sample also 4
encompasses the full range of body sizes (e.g. Leopardus colocolo and Leopardus wiedii, 5
both at the small body mass end at 2 – 4kg, and Panthera tigris at the large body mass 6
extreme of up to 325kg) and ecologies (e.g. arboreal, scansorial, and terrestrial) displayed by 7
living felids (Meachen-Samuels & Van Valkenburgh, 2009b; Sunquist & Sunquist, 2002). 8
Specimens were chosen based on completeness, being disarticulated (which allows a greater 9
number of anatomical features to be observed and measured) and, whenever possible, being 10
wild caught (known captive-raised specimens are identified in Table 1). The specimens 11
sampled are held in the zoological collections at the Natural History Museum in London 12
(NHM), the University Museum of Zoology Cambridge (UMZC), and the Muséum National 13
d’Histoire Naturelle in Paris (MNHN) (Table 1). 14
Anatomical measurements. – All 27 pre-sacral vertebrae (seven cervicals, 13 thoracics, 15
and seven lumbars) of one to two specimens per species were measured with digital callipers 16
(accuracy of 0.01mm) for linear measurements and with a goniometer for angular 17
measurements (to the nearest degree). The measurements were particular to each of the three 18
regions of the vertebral column (cervical, thoracic, and lumbar) and only features present in 19
all species were used in statistical analyses. Because different regions have unique vertebral 20
features, different combinations of measurements were taken on separate sets of 21
morphologically similar vertebrae (Figure 2). In total, there were 28 measurement categories 22
(i.e. centrum length, neural spine angle) with a sum total of 309 variables across the column, 23
and an overall total of 6798 measurement values in the dataset. Missing values (e.g. where 24
8 basing the new values on observed instances for each specific variable. This method also 1
calculates regression values for the missing data and imputation is continued until 2
convergence (German & Hill, 2006; Ilin & Raiko, 2010). Approximately 2% of the total 3
measurement values were imputed in the dataset. While the linear measurements were used in 4
the statistical analyses presented here, all measurement, both linear and angular, were 5
explored through visualization of vertebral profiles (see below). 6
Measurements were selected based on their relevance for the flexibility and range of motion 7
of the vertebral column, their identification as important muscle attachment sites, and their 8
potential relevance for understanding how the spine responds to differences in body size (e.g. 9
presence of allometry). The measurements were grounded primarily on those by Pierce et al. 10
(2011), and supplemented with additional measures to capture morphological attributes 11
relevant for felids (Table 2). All measurements were taken by one observer (MR), repeated 12
three times, and averaged to produce the final dataset used in further analyses. Measurements 13
of the angles between the pre-zygapophyses and the accessory processes were removed from 14
the original dataset due to high error. 15
2. Data analyses: 16
Principal Component Analyses (PCA). – All linear measurements were log10 transformed 17
prior to analysis. Measurements were then phylogenetically size-corrected using log10 total 18
vertebral column length as a proxy for body size in R with the phytools package (Revell, 19
2009). This procedure removes the effects of body size from the data by using phylogenetic 20
regressions to calculate independent slopes for the clades. This is an important step when 21
analysing families such as Felidae where a clear phylogenetic bias is found for body size, and 22
larger-bodied species are concentrated in a few closely related genera (e.g. the Panthera 23
9 Phylogenetic relationships were based on a recent supertree analysis of carnivorans
1
(Nyakatura & Bininda-Emonds, 2012), which was cropped in Mesquite version 3.02 2
(Maddison & Maddison, 2014) to only include species represented in this study (Figure 1). 3
These measurements were analysed with a Principal Components Analysis (PCA) in PAST 4
version 2.17c (Hammer, Harper & Ryan, 2001) for five subsets of the original dataset: all 5
vertebrae (i.e. all 27 vertebrae), cervicals only (i.e. only the seven vertebrae of the cervical 6
region), thoracics only (i.e. only the 13 vertebrae of the thoracic region), lumbars only (i.e. 7
only the seven vertebrae of the lumbar region), and thoracics + lumbars combined (i.e. the 20 8
vertebrae composing the thoracic and lumbar regions, from T1 to L7). 9
In order to ensure that size had been removed prior to our PCA, and therefore that PCs were 10
uncorrelated with size, PC scores from significant PC axes (i.e. those with eigenvalues higher 11
than the Jollife cut-off) in the ‘all vertebrae’ PCA were regressed against log10 total vertebral 12
column length as a proxy for body size. The scores were regressed both across the full ‘all 13
vertebrae’ sample and per locomotory group (as this was the main trait influencing 14
morphospace occupation; see Results). This same procedure was repeated for the full ‘all 15
vertebrae’ sample while controlling for phylogeny, with independent contrasts (Felsenstein, 16
1985) calculated for the PC scores from significant axes and for total vertebral length using 17
the R package ‘ape’ (Paradis, Claude & Strimmer, 2004). This further step was performed in 18
order to ensure that size had been removed from our data even when phylogeny was taken 19
into account. Independent contrasts (for scores of each PC axis against vertebral column 20
length) were then subjected to Reduced Major Axis (RMA) regression in R using the ‘smatr’ 21
package (Warton et al., 2012). 22
To test how locomotor specialization affects vertebral shape, species were categorised by 23
10 evaluated in PCA morphospace (the full linear dataset and four regional linear subsets) using 1
convex hulls. Species assignment to locomotory categories are detailed in Figure 1 and Table 2
1 and were based on the studies of Meachen-Samuels and Van Valkenburgh (2009b) and 3
Sunquist and Sunquist (2002). Further, to explore the impact of prey specialization on 4
vertebral shape, the ‘cervicals only’ and the ‘all vertebrae’ subsets were qualitatively 5
examined in PCA morphospace by grouping species by prey size (i.e. small, mixed, and 6
large) according to the study by Meachen-Samuels and Van Valkenburgh (2009a). Finally, to 7
assess the effect of phylogenetic relatedness on vertebral morphology, species were also 8
categorised according to clade (‘Panthera’, ‘Bay cat’, ‘Caracal’, ‘Ocelot’, ‘Lynx’, ‘Puma’, 9
‘Leopard cat’, and ‘Domestic cat’ lineages based on Johnson et al., 2006; Figure 1) in the 10
resulting PCA morphospace. All qualitative assessments using PCA were followed by the 11
confirmatory analyses detailed below. 12
MANOVA and Phylogenetic MANOVA. – Differences in the area of morphospace 13
occupied by each of the locomotory, prey size, and clade groupings were further assessed 14
quantitatively using MANOVA. Locomotory and prey size groupings were also analysed 15
with phylogenetic MANOVAs (pMANOVAs) to account for the potentially confounding 16
effect of phylogeny. These pMANOVAs address the issue of non-independence due to 17
relatedness in species’ phenotypes by correcting the overestimation of degrees of freedom in 18
comparative cross-species tests (Garland et al., 1993). Specifically, the significance of the 19
standard test statistic is assessed using a Brownian motion model to simulate the distribution 20
of the relevant dependent variables along a given phylogenetic tree. MANOVAs and 21
pMANOVAs were performed on the PC scores of all axes that presented an eigenvalue equal 22
to or higher than the Jolliffe cut-off (i.e. the first nine PCs for the ‘all vertebrae’ analysis, 23
which were all higher than the cut-off value of 0.04595). The phylogenetic relationships used 24
11 standard and phylogenetic MANOVA analyses were performed in R software (R Foundation, 1
2013) using the ‘geiger’ and ‘stats’ packages (Harmon et al., 2014). 2
Vertebral profiles - To further examine variation along the vertebral column and 3
identify aspects of individual vertebrae and vertebral regions associated with niche 4
specialisation, vertebral profiles were plotted for a subset of 12 measurements: centrum 5
length, height and width, width of centrum lamina, lever arm and angle of the neural spine, 6
anteroposterior length of the tip of neural spine, lever arm and angles (anteroposterior and 7
dorsoventral projections) of the transverse process, length of interzygapophyseal distance, 8
and accessory process distance. In addition, variation in centrum shape was examined by 9
calculating the change in relative centrum length [2*centrum length/(centrum height + 10
centrum width)] throughout the vertebral column (Pierce et al., 2011). This measure of 11
centrum shape provides clearer information in regards to the flexibility and range of motion 12
of intervertebral joints (Buchholtz, 2001a; Buchholtz, 2001b). 13
To generate niche-specific vertebral profiles, log10 transformed, phylogenetically size-14
corrected linear measurements, and raw angles were averaged for all species in a 15
corresponding group, and plotted against vertebral number. Only measurement variables that 16
were found either on all vertebrae or on at least three or more consecutive vertebrae (e.g. 17
accessory processes, from T12 to L5) were plotted and no imputed variables were used in this 18
analysis. Statistical significance of the differences between vertebral profiles was evaluated 19
by performing ANOVAs on vertebral bins composed of seven vertebrae each (except bin ‘3’ 20
which was composed of only six vertebrae, from T8 – T13), corresponding to four bins at 21
25% vertebral intervals: bin ‘1’: atlas – C7; bin ‘2’: T1 – T7; bin ‘3’: T8 – T13; and bin ‘4’: 22
L1 – L7. 23
12 a) Vertebral column length and body mass – To test if vertebral column length is a 1
robust predictor of specimen body size (see below), and to examine how the whole 2
column scaled with body mass, generalised least squares (GLS) regressions of log10 3
body mass (based on average species body mass (from Cuff AR et al., 2015) were 4
made against log10 total presacral vertebral column length (C1-L7) (based on the sum 5
total of centrum lengths, without the intervertebral disc/space). The generalised least 6
squares regressions were carried out with and without phylogenetic correction under a 7
Brownian motion model of evolution using the ‘pGLS’ package (Martins & Hansen, 8
1997; Mao & Ryan, 2013) within R. We also investigated regional scaling by 9
performing phylogenetically-corrected GLS regressions of log10 body mass against 10
each of the separate log10 total lengths of the cervical, thoracic and lumbar regions. 11
Analyses to test if vertebral column length scaled isometrically with body mass were 12
made by comparing the obtained slopes to an isometry slope of 0.333 (i.e. length ~ 13
√𝑚𝑎𝑠𝑠 3
). 14
b) Individual vertebrae and total length – In addition, we also tested for allometric 15
changes within individual vertebrae. To control for phylogeny, independent contrasts 16
of log10 raw linear measurements and log10 total vertebral column length were 17
calculated using the same procedure cited above. Those independent contrasts (for 18
scores of each individual linear vertebral measurement against vertebral column 19
length) were then subjected to Reduced Major Axis (RMA) regression in R using the 20
‘smatr’ package (Warton et al. 2012). Analyses to test if these individual linear 21
vertebral measurements scaled isometrically with total vertebral length were made by 22
comparing the obtained slopes to an isometry slope of 1 (i.e. length ~ length1). 23
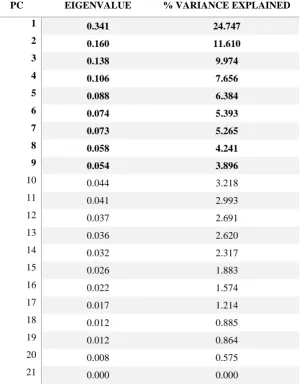
13 Principal Component Analysis, MANOVA and Phylogenetic MANOVA. – The ‘all 1
vertebrae’ PCA revealed nine PCs which were significant according to the Jolliffe cut-off 2
value of 0.04595 (Table 3), and the sum of the variance explained by those reached almost 3
80% (i.e. 79.166%) of the total variance. Regressions of all significant PC scores from the 4
‘all vertebrae’ PCA on log10 total vertebral column length, before and after phylogenetic 5
correction and between locomotory groups, demonstrated that shape variables were 6
statistically uncorrelated with size (r2 << 0.4, and p >> 0.05) and that the effects of size 7
variation were removed prior to PCA. 8
PC1xPC2 showed a large area of overlap between the terrestrial and scansorial groups, but a 9
clear clustering of arboreal species in a distinct area of morphospace (Figure 3A). There was 10
a much better separation of all three locomotory groups in PC1xPC3 (Figure 3B), with only a 11
very small overlap between the terrestrial and scansorial groups. The vertebral features which 12
were most relevant to contributing to this result in terms of high correlation coefficients (i.e. r 13
> 0.6, following Pierce et al. (2011)) are detailed in Table 4. While most variables exhibited 14
high PC1 loading correlation values, PC3 was only highly correlated with measurements of 15
neural spine anteroposterior length at tip in the thoracic and lumbar regions, and centrum 16
height in the lumbar region. 17
Clade groupings in the ‘all vertebrae PCA’ were significant as a clustering factor when 18
analysed with MANOVA, showing that among the species studied here, closely related taxa 19
tended to be more similar in their axial skeletal morphology. The ‘all vertebrae PCA’ 20
revealed that the clustering of species by their locomotory groups was indeed statistically 21
significant, both with (phylogenetic p << 0.05) and without (p << 0.05) phylogenetic 22
correction. Prey size groups in the ‘all vertebrae’ morphospace were non-significant (p >> 23
14 The ‘thoracics only’, ‘lumbars only’, and the ‘thoracics + lumbars’ subset analyses revealed 1
clustering similar to the ‘all vertebrae’ PCA (not shown). MANOVA results calculated from 2
the ‘lumbars only’ subset showed that locomotory groups occupied different areas of 3
morphospace, both with and without phylogenetic correction (p < 0.05). However, for both 4
the ‘thoracics only’ and ‘thoracics + lumbars’ subsets, significant statistical difference 5
between locomotory groups was only achieved when phylogeny was taken into account. 6
However, comparison of all significant results with a Bonferroni corrected p = 0.0065 7
resulted in only the ‘all vertebrae’ and ‘lumbars only’ subsets exhibiting significant 8
separation between locomotory clusters. 9
The 'cervicals only' analyses did not reveal any clear association of taxa by locomotory or 10
prey size groupings, and the respective phylogenetic MANOVA again confirmed the non-11
significance of these groups (locomotory groups: p and phylogenetic p >> 0.05; prey-size 12
groups: p and phylogenetic p > 0.05). Results for all MANOVAs and pMANOVAs are 13
shown in Table 5. 14
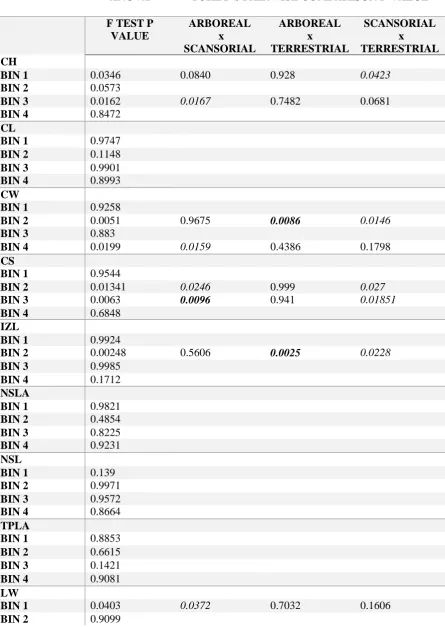
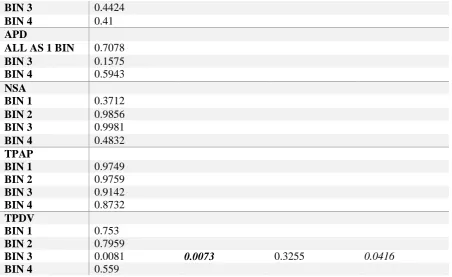
Vertebral profiles. – As locomotory mode was the only examined ecological trait 15
found to have a significant influence on morphospace occupation, average vertebral profiles 16
were created for species designated arboreal, scansorial, or terrestrial. The profiles revealed 17
similar overall trends along the vertebral column, with some localised differences in the 18
shape of individual vertebral features (Figure 4A-M). After Bonferroni correction, only the 19
ANOVAs of four pairwise comparisons between group profiles were statistically significant 20
(Table 6): centrum width (CW) between arboreal and terrestrial species at bin ‘2’, with 21
terrestrial species having lower values for CW or more narrow vertebrae; centrum shape (CS) 22
between arboreal and scansorial groups at bin ‘3’, with the scansorial group displaying 23
15 (IZL) between arboreal and terrestrial groups at bin ‘2’, for which the terrestrial group
1
presented the shortest IZL; and the transverse process dorsoventral projection (TPDV) 2
between arboreal and scansorial categories at bin ‘3’, where the scansorial species had the 3
lowest TPDV angle values (i.e. the least ventrally directed). 4
Scaling: 5
a) Vertebral column length and body mass - The GLS for log10 total pre-sacral vertebral 6
column length against log10 body mass showed a relationship significantly different 7
from isometry (slope=0.267; r2 = 0.815, p ≪ 0.05), but after phylogenetic correction, 8
the relationship was weaker (r2 = 0.483) and the regression slope was not significantly 9
differently from isometry (Table 7). All individual vertebral column regional 10
regressions (i.e. cervical, thoracic and lumbar lengths) had similarly weak correlation 11
values (r2 = 0.483) and possessed slopes that were not significantly different from an 12
isometric relationship (Table 7). 13
b) Within individual vertebrae - Phylogenetically-corrected scaling analyses of 14
individual linear vertebral measurements revealed 64 cases of significant allometric 15
scaling, i.e. with a regression slope different from 1 (Table 8, complete table in Supp 16
Table 1): 61 positive and three negative. There was clear regionalisation of vertebral 17
allometry: out of 64 instances, 19 (18 positive and one negative) were in the cervical 18
region, 34 (33 positive and one negative) in the thoracic region, and only 11 (ten 19
positive and one negative) in the lumbar region. These allometric measurements could 20
be further divided into five categories: centrum-related (30 instances), neural spine-21
related (25 instances), zygapophyseal-related (six instances), inferior lamella-related 22
16 Out of the 19 allometric instances in the cervical region, 16 were found in the five similarly-1
shaped post-axis vertebrae (i.e. C3 – C7). All of the post-axis cervical vertebrae exhibit a 2
positive allometric relationship in terms of centrum length and height. Whereas C4 and C5 3
displayed the exact same instances of allometric change (centrum length, centrum height, 4
length of the inferior lamella, and interzygapophyseal length), C6 showed the lowest number 5
of instances (centrum length and centrum width only). The atlas had a unique combination of 6
allometric changes, while the axis only presented positive allometric change in centrum 7
height. 8
Within the thoracic region, allometry was observed in almost all vertebrae for two primary 9
features: centrum height, which was positively allometric from T1-T12; and neural spine 10
lever arm, which was positively allometric from T5-T13 (although absent on T8). Although a 11
positively allometric relationship was also found for the neural spine anteroposterior length at 12
its tip for most thoracic vertebrae, six of these had weak correlation values between the 13
variables (i.e. r2 < 0.45). Within the thoracic region, there appears to be two sub-groups of 14
vertebrae that showed the same combination of allometric features: T2 – T3 (centrum length 15
and centrum height, both showing positive allometry), and T10 – T12 (centrum height, and 16
neural spine lever arm, both also showing positive allometry). 17
The presence of allometry was weakest in the lumbar region. Although all seven lumbar 18
vertebrae presented instances of allometry, these were restricted to only one measurement in 19
most cases: the neural spine lever arm, always demonstrating positive allometry with total 20
vertebral column length. In addition to this, L5 and L7 also showed positive allometry on the 21
length at the tip of the neural spine, L4 presented negative allometry on its lamina width, and 22
L7 shows positive allometry with respect to centrum height. 23
17 Shape and ecology.–
1
Here, we quantitatively analysed the morphology of the entire pre-sacral vertebral column in 2
felids to test whether morphological differentiation of the vertebral column across species is 3
driven by body size and/or ecologically derived traits, such as locomotory mode and prey-4
hunting specialization, as has been previously demonstrated for felid limbs (Gonyea, 1978; 5
Meachen-Samuels & Van Valkenburgh, 2009b; Meachen-Samuels, 2012). Our study shows 6
that linear shape variation in the felid vertebral column significantly discriminated terrestrial, 7
arboreal, and scansorial species, demonstrating that locomotory specialization, but not prey 8
size, has fashioned vertebral column evolution within felids. Locomotor differentiation was 9
statistically significant only when phylogenetic relationships were taken into account, and 10
only when either ‘all vertebrae’ were analysed together or when the analysis was restricted to 11
the lumbar vertebrae. In a study comparing the relative lengths of limbs and axial skeletons of 12
species of large-bodied felids, Gonyea (1976) suggested that locomotory specialisation was 13
reflected by changes in the length of the lumbar region (but see scaling results below). This 14
result indicates that, although size-independent changes in shape are somewhat dispersed 15
throughout the whole vertebral column, wide-spread changes in the lumbar vertebra are 16
particularity important for locomotor specialization. 17
Although there was significant differentiation of locomotory groups across all principal 18
components, there was also clear overlap between scansorial and terrestrial species on most 19
PCs (Figure 3). Such morphological similarities between these locomotory groups may 20
reflect a hypothesized scansorial ancestral condition for felids, as has been reconstructed for 21
Proailurus, the earliest fossil felid (Peigné, 1999; Turner & Antón, 1996), or that all living 22
species have the ability to climb (Ewer, 1973; MacDonald et al., 2010; Sunquist & Sunquist, 23
18 the cheetah, Acinonyx jubatus, which is more cursorial than other felids (Ewer, 1973;
1
MacDonald et al., 2010; Sunquist & Sunquist, 2002), and the highly arboreal margay, 2
marbled cat, and clouded leopard; Leopardus wiedii, Pardofelis marmorata,and Neofelis 3
nebulosa,respectively; with their broad feet and very flexible ankles (MacDonald et al., 4
2010; Sunquist & Sunquist, 2002). 5
This relative similarity in the felid axial skeleton was also demonstrated by our vertebral 6
column profile analyses (Figure 4). The profile plots revealed a strong general resemblance 7
between locomotory groups, with a few instances of significant statistical difference between 8
them (Table 6), and primarily in the thoracic region. These instances were found in 9
comparisons between the arboreal group’s profile and the other two locomotory groups, 10
suggesting that arboreality may require distinct morphological specialisation of the axial 11
skeleton. Our results indicate that arboreal species present greater passive stiffness in the 12
thoracic region due to larger values of centrum width and shape (Figure 4C-D) (Koob & 13
Long, 2000; Long et al., 1997; Pierce et al., 2011; Shapiro, 2007). This may, however, be 14
counterbalanced by a greater propensity for intervertebral mobility (i.e. sensu range of 15
motion) granted by a larger interzygapophyseal length (IZL) in the anterior thoracic region 16
(Figure 4L) (Jenkins, 1974; Pierce et al., 2011). Contrary to the profile plots, our PC analyses 17
recover the lumbar region as holding the majority of the locomotory signal. This discrepancy 18
may indicate that unlike similar analyses (e.g. Jones & German, 2014; Molnar et al., 2014; 19
Pierce et al., 2011), univariate measures are not sufficient to discriminate between felid 20
locomotor specialisations, and that such distinction is best achieved with more complex, 21
multidimensional shape analyses. 22
Prey-killing techniques, which if reflective of prey size choice, can subdivide species based 23
19 Samuels & Van Valkenburgh, 2009a; Meachen-Samuels & Van Valkenburgh, 2009b;
1
Meachen-Samuels & Van Valkenburgh, 2010; Slater & Van Valkenburgh, 2008). However, 2
prey size was not significantly associated with vertebral shape in this study, counter to our 3
expectations for the cervical vertebrae. This result may be a reflection of the measurements 4
chosen in this study, which were based on biomechanical traits relevant for locomotory 5
modes (Pierce et al., 2011) or that variation in vertebral shape across felid evolution is not 6
closely tied to variations in prey-killing techniques. To more fully understand the effect of 7
prey specialization on the vertebral column of felids, most specifically on the cervical 8
vertebrae, further investigation of vertebral shape using more sophisticated analytical 9
techniques (e.g. geometric morphometrics) would be advantageous. 10
Shape and body size.– 11
Our analyses revealed widespread allometry in the vertebral column of extant felids, a pattern 12
consistent with Doube et al. (2009), who found similar scaling in the appendicular skeleton. 13
Therefore, body size, which is often the most conspicuous difference when grossly 14
comparing the skeletons of distantly related felid species, has a great influence on the overall 15
morphology of the vertebral column. In light of the suggestions of shorter and stiffer lumbar 16
regions in larger mammals (Smeathers 1981, Gál 1993b, and recently Jones 2015), and also 17
taking into account the postural uniformity in felids through increases in body size (Day & 18
Jayne, 2007; Doube et al., 2009; Zhang et al., 2012), we had initially hypothesized that, as 19
felid species increase in size, there would be an increase in vertebral column stiffness. 20
Further, we hypothesized that this increase in stiffness would be particularly evident in the 21
posterior column due to the necessity to support greater body mass. In keeping with this, the 22
total length of the vertebral column in living felid species was shown to be highly correlated 23
20 variables (i.e. the vertebral column is relatively shorter in larger species). This result agrees 1
with the recent findings of allometric shortening of the thoracolumbar region in felids by 2
Jones (2015). However, the relationship found here was not maintained after phylogenetic 3
correction, and the length of the whole vertebral column, or of discrete vertebral column 4
regions, displayed a relationship with body mass that was not significantly different from 5
what is expected from isometry. In contrast, Jones (2015) found that her evolutionary 6
negatively allometric patterns were consistent prior to and after phylogenetic correction, both 7
for total thoracolumbar length and for the individual thoracic and lumbar regions. The cause 8
of this disagreement between analyses is unclear, but may lie in the different phylogenetic 9
methods used (i.e. independent contrasts in Jones (2015) vs. phylogenetic GLS here), or 10
because here we use average species body mass rather than an estimate of body mass based 11
on a regression equation from limb dimensions. 12
Compared to our whole vertebral column results, analyses of individual vertebral 13
measurements showed extensive intravertebral allometry, with most vertebral dimensions 14
being positively allometric when corrected for phylogeny (i.e. relatively larger in larger 15
species), particularly in the thoracic region (Table 7). The most prevalent allometry was 16
centrum height, being present in over 2/3 of the vertebral column (19 out of 27 vertebrae), 17
from the atlas to T12 and L7. Increased height of the centrum in larger felid species suggests 18
greater stability in the dorsoventral plane in the cervical and thoracic region. Jones (2015) 19
also found centrum height to be positively allometric in the thoracic region; however, she 20
also found this measurement to be positively allometric in the mid-lumbar region. Our 21
analyses found no support for allometric scaling of centrum dimensions in the lumbar region, 22
except for L7. The most prevalent allometry in the lumbar vertebrae was the neural spine 23
lever arm; longer neural spines in larger animals will increase passive stiffness due to the 24
21 for dorsoventral bending capacity of the lumbar region (Long et al., 1997; Pierce et al., 2011), 1
which may contribute to stride length. Therefore, our data imply that larger felid species 2
increase passive stiffness in the lumbar region via acquisition of greater muscle mass and 3
ligament leverage, rather than changes in centrum dimensions. 4
The three main groups of allometric variables - centrum-related, neural spine-related, and 5
zygapophyseal-related - appear to dominate in different regions of the column (i.e. before and 6
after the anticlinal vertebra T11): whereas the neural spine-related allometries were almost 7
equally spread throughout the vertebral column, the centrum and zygapophyseal-related 8
allometries were concentrated in the cervical and thoracic regions, with few instances in the 9
lumbar vertebrae. Allometry has been suggested to be a strong factor contributing to 10
morphological integration (Klingenberg, 2008; Klingenberg & Marugán-Lobón, 2013), and 11
the pattern of regionalization of specific allometric trends would be consistent with the 12
presence of modularity in the vertebral column (i.e. existence of sets of characters that covary 13
more strongly between themselves due to shared function or proximity, and present some 14
evolutionary independence from other traits (Olson & Miller, 1958)). Morphological, 15
developmental, and functional modularity has been studied in the mammalian skeleton, with 16
many examples focusing on the skull (Goswami, 2006; Goswami et al., 2012; Meloro & 17
Slater, 2012; Piras et al., 2013) but also on the vertebral column and limbs (Buchholtz, 2014; 18
Buchholtz et al., 2012; Fabre et al., 2014; Goswami, Weisbecker & Sanchez-Villagra, 2009; 19
Polly, Head & Cohn, 2001). 20
Based on the distribution of allometries recovered here, we propose the hypothesis of the 21
presence of two major functional modules in the felid vertebral column: an anterior module 22
composed of the cervical and thoracic vertebrae, and a posterior or lumbar module. 23
22 previously suggested diaphragmatic module for the mammalian column (Buchholtz, 2014), 1
and we additionally propose a functional ‘anticlinality module’ composed of the anticlinal 2
vertebra (T11) and the immediate surrounding vertebrae (T10 and T12). These hypothesized 3
modules within the felid vertebral column are an interesting starting point for further analysis 4
of morphological integration and morphological/functional regionalization of the felid 5
vertebral column using more appropriate methodologies (e.g. Fabre et al., 2014; Goswami & 6
Polly, 10; Head & Polly, 2015; Klingenberg & Marugán-Lobón, 2013) 7
Conclusion: 8
Comparative functional studies on animals with similar musculoskeletal anatomy are 9
important to understand the form-function relationship (e.g. Irschick (2002) and Nyakatura 10
and Fischer (2010)), and such studies allow researchers to better understand the behaviour of 11
living organisms and infer the habits of extinct species (Hutchinson, 2012; Moon, 1999). The 12
work we present here provides a new perspective on how extant felids have adapted their 13
postcranial skeleton to deal with ecological specialisations over a wide range of body mass, 14
irrespective of having a relatively conservative morphology. Specifically, our results show 15
evidence for hitherto-underappreciated differentiation in vertebral shape in Felidae, which 16
reflects specialisation for locomotion mode (arboreal, scansorial, and terrestrial). 17
Furthermore, there is evidence for extensive allometric scaling within individual vertebrae. In 18
particular, evolutionary increases in body size have driven stabilisation of the anterior axial 19
skeleton (cervical and thoracic vertebrae) through widespread modification of vertebral form. 20
In contrast, size-correlated stabilisation of the lumbar region seems to be primarily 21
accomplished by means of increases in epaxial muscle mass in felids. The heterogeneous 22
23 modularity beyond traditional regionalisation boundaries, which will be tested in future 1
studies. 2
Acknowledgements 3
We thank P. David Polly and an anonymous reviewer for their constructive reviews of this 4
manuscript. For access to specimens, we thank M. Lowe and R. Asher at the University 5
Museum of Zoology, Cambridge; R. Portela Miguez at the Natural History Museum, London; 6
and C. Lefèvre at the Muséum National d’Histoire Naturelle, Paris. We thank Dr Mark Bell 7
and Dr Claire Peart for their help with the R scripts. We also thank the Adaptive group at 8
University College London for their helpful input during the preparation of this manuscript. 9
This work was supported by Leverhulme Trust grant RPG 2013-124 to AG and JRH and the 10
National Science Foundation award EAR-1524523 to SEP. 11
12
Bibliography 13
Alvarez A, Ercoli MD, Prevosti FJ. 2013. Locomotion in some small to medium-sized mammals: a 14
geometric morphometric analysis of the penultimate lumbar vertebra, pelvis and hindlimbs. 15
Zoology (Jena) 116: 356-371. 16
Antón M, Galobart A. 1999. Neck function and predatory behavior in the scimitar toothed cat 17
Homotherium latidens. Journal of Vertebrate Paleontology 19: 771-784. 18
Argot C. 2003. Functional-adaptive anatomy of the axial skeleton of some extant marsupials and the 19
paleobiology of the paleocene marsupials Mayulestes ferox and Pucadelphys andinus. J 20
Morphol 255: 279-300. 21
Bertram JE, Biewener AA. 1990. Differential scaling of the long bones in the terrestrial carnivora and 22
other mammals. J Morphol 204: 157-169. 23
Biewener AA. 1989. Scaling body support in mammals: limb posture and muscle mechanics. Science 24
245: 45-48. 25
Biewener AA. 2005. Biomechanical consequences of scaling. J Exp Biol 208: 1665-1676. 26
Boszczyk BM, Boszczyk AA, Putz R. 2001. Comparative and functional anatomy of the mammalian 27
lumbar spine. The Anatomical Record 264: 157–168. 28
Buchholtz EA. 2001a. Swimming styles in Jurassic ichthyosaurs. Journal of Vertebrate Paleontology 29
21: 61-73. 30
Buchholtz EA. 2001b. Vertebral osteology and swimming style in living and fossil whales (Order: 31
Cetacea). Journal of Zoology 253: 175-190. 32
Buchholtz EA. 2014. Crossing the frontier: a hypothesis for the origins of meristic constraint in 33
24 Buchholtz EA, Bailin HG, Laves SA, Yang JT, Chan MY, Drozd LE. 2012. Fixed cervical count and the 1
origin of the mammalian diaphragm. Evol Dev 14: 399-411. 2
Carbone C, Mace GM, Roberts SC, Macdonald DW. 1999. Energetic constaints on the diet of 3
terrestrial carnivores. Nature 402: 286-288. 4
Carlson H, Halbertsma J, Zomlefer M. 1979. Control of the Trunk during Walking in the Cat. Acta 5
Physiologica Scandinavica 105: 251-253. 6
Cuff AR, Randau M, Head JJ, Hutchinson JR, Pierce SE, Goswami A. Big cat, small cat: reconstructing 7
body size evolution in living and extinct Felidae. Journal of Evolutionary Biology28 :1516-8
1525. 9
Day LM, Jayne BC. 2007. Interspecific scaling of the morphology and posture of the limbs during the 10
locomotion of cats (Felidae). J Exp Biol 210: 642-654. 11
Doube M, Wiktorowicz-Conroy A, Christiansen P, Hutchinson JR, Shefelbine S. 2009. Three-12
dimensional geometric analysis of felid limb bone allometry. PLoS One 4: e4742. 13
Ewer RF. 1973.The Carnivores. Cornell University Press. 14
Fabre AC, Goswami A, Peigne S, Cornette R. 2014. Morphological integration in the forelimb of 15
musteloid carnivorans. J Anat 225: 19-30. 16
Felsenstein J. 1985. Phylogenies and the comparative method. Am Nat 125: 1-15.Gál JM. 1993a. 17
Mammalian spinal biomechanics II. Intervertebral lesion experiments and mechanisms of 18
bending resistance. Journal of Experimental Biology 174: 281-297. 19
Gál JM. 1993b. Mammalian spinal biomechanics. I. Static and dynamic mechanical properties of 20
intact intervertebral joints. J Exp Biol 174: 247-280. 21
Galis F, Carrier DR, van Alphen J, van der Mije SD, Van Dooren TJ, Metz JA, ten Broek CM. 2014. 22
Fast running restricts evolutionary change of the vertebral column in mammals. Proc Natl 23
Acad Sci U S A 111: 11401-11406. 24
Garland T, Dickerman AW, Janis CM, Jones JA. 1993. Phylogenetic analysis of covariance by 25
computer simulation. Systematic Biology 42: 265-292.German A, Hill J. 2006.Data analysis 26
using regression and multilevel/hierarchical models (Analytical methods for social research). 27
Cambridge University Press: New York. 28
Gonyea WJ. 1976. Adaptive differences in the body proportions of large felids. Acta Anat (Basel) 96: 29
81-96. 30
Gonyea WJ. 1978. Functional implications of felid forelimb anatomy. Acta Anat (Basel) 102: 111-121. 31
Goswami A. 2006. Cranial modularity shifts during mammalian evolution. Am Nat 168: 270-280. 32
Goswami A, Polly PD. 2010. Methods of studying morphological integration and modularity. In: 33
Alroy J and Hunt G, eds. Quantitative methods in paleobiology: The paleontological society 34
papers. 213-243. 35
Goswami A, Polly PD, Mock OB, Sanchez-Villagra MR. 2012. Shape, variance and integration during 36
craniogenesis: contrasting marsupial and placental mammals. J Evol Biol 25: 862-872. 37
Goswami A, Weisbecker V, Sanchez-Villagra MR. 2009. Developmental modularity and the 38
marsupial-placental dichotomy. J Exp Zool B Mol Dev Evol 312B: 186-195. 39
Halpert AP, Jenkins FA, Jr., Franks H. 1987. Structure and scaling of the lumbar vertebrae in African 40
bovids (Mammalia, Artiodactyla). Journal of Zoology 211: 239-258. 41
Hammer Ø, Harper DAT, Ryan PD. 2001. PAST: Paleontological statistics software package for 42
education and data analysis. Palaeontologia Electronica 4: 9. 43
Harmon L, Weir J, Brock C, Glor R, Challenger W, Hunt G, FitzJohn R, Pennell M, Slater G, Brown J, 44
Uyeda J, Eastman J. 2014. Analysis of evolutionary diversification. 45
Head JJ, Polly PD. 2015. Evolution of the snake body form reveals homoplasy in amniote Hox gene 46
function. Nature 520: 86-89. 47
Hutchinson JR. 2012. On the inference of function from structure using biomechanical modelling 48
and simulation of extinct organisms. Biol Lett 8: 115-118. 49
Ilin A, Raiko T. 2010. Practical approaches to principal component analysis in the presence of 50
25 Irschick DJ. 2002. Evolutionary approaches for studying functional morphology: examples from 1
studies of performance capacity. Integr Comp Biol 42: 278-290. 2
Jenkins FA. 1974.Primate locomotion. Academic Press: New York ; London. 3
Johnson WE, Eizirik E, Pecon-Slattery J, Murphy WJ, Antunes A, Teeling E, O'Brien SJ. 2006. The late 4
Miocene radiation of modern Felidae: a genetic assessment. Science 311: 73-77. 5
Jones KE. 2015. Evolutionary allometry of the thoracolumbar centra in felids and bovids. J Morphol. 6
Jones KE, German RZ. 2014. Ontogenetic allometry in the thoracolumbar spine of mammal species 7
with differing gait use. Evol Dev 16: 110-120. 8
Klingenberg CP. 2008. Morphological Integration and Developmental Modularity. Annual Review of 9
Ecology, Evolution, and Systematics 39: 115-132. 10
Klingenberg CP, Marugán-Lobón J. 2013. Evolutionary Covariation in Geometric Morphometric Data: 11
Analyzing Integration, Modularity, and Allometry in a Phylogenetic Context. Systematic 12
Biology 62: 591–610. 13
Koob TJ, Long JH. 2000. The vertebrate body axis: Evolution and mechanical function. American 14
Zoologist 40: 1-18. 15
Leyhausen P. 1979.Cat behavior: the predatory and social behavior of domestic and wild cats. New 16
York, NY: Garland. STMP Press. 17
Long JH, Adcock B, Root RG. 2002. Force transmission via axial tendons in undulating fish: a dynamic 18
analysis. Comp Biochem Physiol A Mol Integr Physiol 133: 911-929. 19
Long JH, Jr., Pabst DA, Shepherd WR, McLellan WA. 1997. Locomotor design of dolphin vertebral 20
columns: bending mechanics and morphology of Delphinus delphis. J Exp Biol 200: 65-81. 21
MacDonald D, Macdonald DW, Loveridge AJ. 2010.The Biology and Conservation of Wild Felids. 22
Oxford University Press. 23
Macpherson JM, Fung J. 1998. Activity of thoracic and lumbar epaxial extensors during postural 24
responses in the cat. Experimental Brain Research 119: 315-323. 25
Macpherson JM, Ye Y. 1998. The cat vertebral column: stance configuration and range of motion. 26
Experimental Brain Research 119: 324-332. 27
Maddison WP, Maddison DR. 2014. Mesquite: a modular system for evolutionary analysis. 3.01 ed. 28
Mattern MY, McLennan DA. 2000. Phylogeny and speciation of felids. Cladistics 16: 232-253. 29
Martins EP, Hansen TF. 1997. Phylogenies and the comparative method: A general approach to 30
incorporating phylogenetic information into the analysis of interspecific data. Am Nat 149: 31
646-667. 32
Meachen-Samuels J. 2010. Comparative Scaling of Humeral Cross-Sections of Felids and Canids 33
Using Radiographic Images. Journal of Mammalian Evolution 17: 193-209. 34
Meachen-Samuels J, Van Valkenburgh B. 2009a. Craniodental indicators of prey size preference in 35
the Felidae. Biological Journal of the Linnean Society 96: 784-799. 36
Meachen-Samuels J, Van Valkenburgh B. 2009b. Forelimb indicators of prey-size preference in the 37
Felidae. J Morphol 270: 729-744. 38
Meachen-Samuels JA. 2012. Morphological convergence of the prey-killing arsenal of sabertooth 39
predators. Paleobiology 38: 1-14. 40
Meachen-Samuels JA, Van Valkenburgh B. 2010. Radiographs reveal exceptional forelimb strength 41
in the sabertooth cat, Smilodon fatalis. PLoS One 5: e11412. 42
Meloro C, Slater GJ. 2012. Covariation in the skull modules of cats: the challenge of growing saber-43
like canines. Journal of Vertebrate Paleontology 32: 677-685. 44
Molnar JL, Pierce SE, Hutchinson JR. 2014. An experimental and morphometric test of the 45
relationship between vertebral morphology and joint stiffness in Nile crocodiles (Crocodylus 46
niloticus). Journal of Experimental Biology 217: 758-768. 47
Moon BR. 1999. Testing an inference of function from structure: snake vertebrae do the twist. J 48
26 Muller J, Scheyer TM, Head JJ, Barrett PM, Werneburg I, Ericson PG, Pol D, Sanchez-Villagra MR. 1
2010. Homeotic effects, somitogenesis and the evolution of vertebral numbers in recent and 2
fossil amniotes. Proc Natl Acad Sci U S A 107: 2118–2123. 3
Narita Y, Kuratani S. 2005. Evolution of the vertebral formulae in mammals: a perspective on 4
developmental constraints. J Exp Zool B Mol Dev Evol 304: 91-106. 5
Nyakatura JA, Fischer MS. 2010. Functional morphology and three-dimensional kinematics of the 6
thoraco-lumbar region of the spine of the two-toed sloth. J Exp Biol 213: 4278-4290. 7
Nyakatura K, Bininda-Emonds OR. 2012. Updating the evolutionary history of Carnivora 8
(Mammalia): a new species-level supertree complete with divergence time estimates. BMC 9
Biol 10: 10-12. 10
Olson EC, Miller RL. 1958.Morphological Integration. University of Chicago Press: Chicago. 11
Paradis E, Claude J, Strimmer K. 2004. APE: analyses of phylogenetics and evolution in R language. 12
Bioinformatics 20: 289-290. 13
Peigné S. 1999.Proailurus, l'un des plus anciens Felidae (Carnivora) d'Eurasie: systématique et 14
évolution. Bulletin de la Société d'Histoire Naturelle de Toulouse. 135: 125-134. 15
Pierce SE, Ahlberg PE, Hutchinson JR, Molnar JL, Sanchez S, Tafforeau P, Clack JA. 2013. Vertebral 16
architecture in the earliest stem tetrapods. Nature 494: 226-229. 17
Pierce SE, Clack JA, Hutchinson JR. 2011. Comparative axial morphology in pinnipeds and its 18
correlation with aquatic locomotory behaviour. J Anat 219: 502-514. 19
Piras P, Maiorino L, Teresi L, Meloro C, Lucci F, Kotsakis T, Raia P. 2013. Bite of the cats: 20
Relationships between functional integration and mechanical performance as revealed by 21
mandible geometry. Systematic Biology 62: 878–900. 22
Polly PD, Head JJ, Cohn MJ. 2001. Testing modularity and dissociation: The evolution of reginal 23
proportions in snakes. In: Zelditch ML, ed. Beyond heterochrony: The evolution of 24
development. 1st ed. United States of America: Wiley-Blackwell. 392. 25
Pridmore PA. 1992. Trunk Movements during Locomotion in the Marsupial Monodelphis-Domestica 26
(Didelphidae). J Morphol 211: 137-146. 27
R Foundation. 2013. The R Project for Statistical Computing. 3.0.2 ed. 28
Ren L, Miller CE, Lair R, Hutchinson JR. 2010. Integration of biomechanical compliance, leverage, 29
and power in elephant limbs. Proc Natl Acad Sci U S A 107: 7078-7082. 30
Revell LJ. 2009. Size-correction and principal components for interspecific comparative studies. 31
Evolution 63: 3258-3268. 32
Samuels JX, Meachen JA, Sakai SA. 2013. Postcranial morphology and the locomotor habits of living 33
and extinct carnivorans. J Morphol 274: 121-146. 34
Schilling N. 2011. Evolution of the axial system in craniates: morphology and function of the 35
perivertebral musculature. Frontiers in Zoology 8: 1-19. 36
Shapiro L. 1995. Functional morphology of indrid lumbar vertebrae. Am J Phys Anthropol 98: 323-37
342. 38
Shapiro LJ. 2007. Morphological and functional differentiation in the lumbar spine of lorisids and 39
galagids. Am J Primatol 69: 86-102. 40
Shapiro LJ, Seiffert CV, Godfrey LR, Jungers WL, Simons EL, Randria GF. 2005. Morphometric 41
analysis of lumbar vertebrae in extinct Malagasy strepsirrhines. Am J Phys Anthropol 128: 42
823-839. 43
Slater GJ, Van Valkenburgh B. 2008. Long in the tooth: evolution of sabertooth cat cranial shape. 44
Paleobiology 34: 403-419. 45
Slater GJ, Van Valkenburgh B. 2009. Allometry and performance: the evolution of skull form and 46
function in felids. J Evol Biol 22: 2278-2287. 47
Slijper EJ. 1946.Comparative biologic-anatomical investigations on the vertebral column and spinal 48
musculature of mammals. North-Holland Pub, Amsterdam. 49
27 Smit TH. 2002. The use of a quadruped as an in vivo model for the study of the spine - biomechanical 1
considerations. Eur Spine J 11: 137-144. 2
Sunquist M, Sunquist F. 2002.Wild Cats of the World. University of Chicago Press. 3
Turner A, Antón M. 1996.The big cats and their fossil relatives: an illustrated guide to their evolution 4
and natural history. Columbia University Press: New York. 5
Walmsley A, Elton S, Louys J, Bishop LC, Meloro C. 2012. Humeral epiphyseal shape in the felidae: 6
the influence of phylogeny, allometry, and locomotion. J Morphol 273: 1424-1438. 7
Warton DI, Duursma RA, Falster DS, Taskinen S. 2012. smatr 3 - an R package for estimation and 8
inference about allometric lines. Methods in Ecology and Evolution 3: 257-259. 9
Wroe S, Chamoli U, Parr WC, Clausen P, Ridgely R, Witmer L. 2013. Comparative Biomechanical 10
Modeling of Metatherian and Placental Saber-Tooths: A Different Kind of Bite for an Extreme 11
Pouched Predator. PLoS One 8: 1-9. 12
Zhang KY, Wiktorowicz-Conroy A, Hutchinson JR, Doube M, Klosowski M, Shefelbine SJ, Bull AM. 13
2012. 3D morphometric and posture study of felid scapulae using statistical shape 14
28
Figure legends:
29
Figure 2: Vertebral measurements: (A-C) atlas, (D-E) axis, (F) C6, and (G-J) L2 Abbreviations. LDA: Length of dorsal arch; Pre_Z-D: Prezygapophyseal distance; Post_Z-D: Postzygapophyseal distance; TPLA: Transverse process lever arm; WDA: Width of dorsal arch. B. LVA: Length of ventral arch; WVA: Width of ventral arch. C. HNC: Height of the neural canal. D. DW: Dens width. E. DA: Dens angle; DL: Dens length; NSL: Neural spine anteroposterior length at tip. F. LIL: Length of inferior lamella. G. CL: Centrum length; IZL: Interzygapophyseal length; NSL: Neural anteroposterior length at tip; NSLA: Neural spine lever arm. H. APD: Accessory process distance; CH: Centrum height; CW: Centrum width; NSLA: Neural spine lever arm. I. TPDV: Transverse process dorsoventral angle; TPLA: Transverse process lever arm. J. LW: Lamina width; TPAP: Transverse process
30
31
Figure 4: Vertebral profile plots of locomotory groups (i.e., arboreal, terrestrial, and scansorial
32
Tables:
Table 1. List of species studied with their corresponding specimen information, including sex, assigned locomotory group, prey size specialization and clade (Johnson et al., 2006; Meachen-Samuels & Van Valkenburgh, 2009a,b), and museum specimen numbers.
SPECIES SEX PREY SIZE PHYLOGENETIC
LINEAGE LOCOMOTORY GROUP MUSEUM IDENTIFICATION NUMBER Acinonyx jubatus
Unidentified Large ‘Puma’ Terrestrial NHM 1940.1.20.17
Caracal aurata
Female Mixed ‘Caracal’ Terrestrial NHM 1965.8.26.3
Felis chaus Female Small ‘Domestic cat’ Terrestrial NHM 1892.5.22.1
Felis lybica Male Small ‘Domestic cat’ Scansorial NHM 1940.1.20.12 Herpailurus
yagouarundi
Male Small ‘Puma’ Scansorial NHM 1932.2.14.1
Leopardus colocolo
Unidentified Small ‘Ocelot’ Scansorial NHM 1848.6.26.8 - 126.B
Leopardus geoffroyi
Male Small ‘Ocelot’ Terrestrial NHM 32.2.14.1
Leopardus pardalis
Unidentified Mixed ‘Ocelot’ Scansorial UMZC K.6022 (934A)
Leopardus wiedii
Unidentified Small ‘Ocelot’ Arboreal NHM 1846.4.21.8 - 123B
Leopardus wiedii
Unidentified Small ‘Ocelot’ Arboreal NHM 1849.11.7.2 – 933a
Leptailurus serval
Unidentified Small ‘Caracal’ Terrestrial NHM 1845.9.25.23 133c
Leptailurus serval*
Female Small ‘Caracal’ Terrestrial NHM 2006.550
Lynx canadensis
Unidentified Mixed ‘Lynx’ Scansorial UMZC K.6682 (937 I)
Lynx lynx Male Large ‘Lynx’ Scansorial MNHN 1973-83 Neofelis
nebulosa
Female Mixed ‘Panthera’ Arboreal MNHN 1961-217
Otocolobus manul*
Female Small ‘Leopard cat’ Terrestrial MNHN 2009-251
Panthera leo Male Large ‘Panthera’ Terrestrial NHM 1931.1.13.1 Panthera
pardus
Female Large ‘Panthera’ Scansorial NHM 1938.4.21.11
Panthera tigris
Female Large ‘Panthera’ Terrestrial NHM 1884.1.22.6
Panthera uncia*
Female Large ‘Panthera’ Scansorial NHM 1967.6.29.1
Pardofelis temminckii
Unidentified Mixed ‘Bay cat’ Scansorial MNHN 1941-293
Prionailurus bengalensis
Unidentified Small ‘Leopard cat’ Scansorial NHM 1860.4.23.18
1309B Prionailurus
viverrinus
Male Small ‘Leopard cat’ Terrestrial NHM 75.2287
Puma concolor
33 Table 2. List of all measurements taken on each vertebra. C, cervical vertebra; T, thoracic vertebra; L, lumbar vertebra.
Measurements in italics were not included in subsequent statistical analyses due to higher measurement error.
VERTEBRA MEASUREMENT ABBREVIATION
ATLAS Length of ventral arch LVA
Width of ventral arch WVA
Length of dorsal arch LDA
Width of dorsal arch WDA
Transverse process lever arm TPLA
Interzygapophyseal length IZL
Pre-zygapophyseal distance Pre-Z_D
Post-zygapophyseal distance Post-Z_D
Height of neural canal HNC
AXIS Length of centrum CL
Height of centrum CH
Width of centrum CW
Neural spine lever arm NSLA
Interzygapophyseal length IZL
Dens length DL
Dens width DW
Dens angle DA
Transverse process anteroposterior angle TPAP
C3 – C7 Length of centrum CL
Height of centrum CH
Width of centrum CW
Neural spine lever arm NSLA
Transverse process lever arm TPLA
Neural spine anteroposterior length at tip NSL
*C3-C6 ONLY Length of inferior lamella LIL
Interzygapophyseal length IZL
Width of lamina LW
Neural spine angle NSA
*C3-L7 ONLY Pre-zygapophyseal angle Pre-ZA
*C3-C6 ONLY Inferior lamella dorsoventral angle ILDV
*C3-C6 ONLY Inferior lamella anteroposterior angle ILAP
*C5-C7 ONLY Transverse process dorsoventral angle TPDV
*C5-C7 ONLY Transverse process anteroposterior angle TPAP
T1 – T13 Length of centrum CL
Height of centrum CH
Width of centrum CW
Neural spine lever arm NSLA
Transverse process lever arm TPLA
Interzygapophyseal length IZL
Width of lamina LW
Neural spine angle NSA
Neural spine anteroposterior length at tip NSL
*T1 – T10 ONLY Transverse process dorsoventral angle TPDV
*T1 – T10 ONLY Transverse process anteroposterior angle TPAP
*T12 – T13 ONLY Accessory process distance APD
T12 – T13 ONLY Accessory process dorsoventral angle APDV
T12 – T13 ONLY Accessory process anteroposterior angle APAP
L1-L7 Length of centrum CL
Height of centrum CH
Width of centrum CW
Neural spine lever arm NSLA
Transverse process lever arm TPLA
Interzygapophyseal length IZL
Width of lamina LW
Neural spine angle NSA
Transverse process dorsoventral angle TPDV
34 Neural spine anteroposterior length at tip NSL
*L1-L5 ONLY Accessory process distance APD
*L1-L5 ONLY Accessory process dorsoventral angle APDV
*L1-L5 ONLY Accessory process anteroposterior angle APAP
Table 3: PCA results from the ‘all vertebrae’ analysis. PCs with an eigenvalue higher than the Jolliffe cut-off of
0.046 are marked in bold.
PC EIGENVALUE % VARIANCE EXPLAINED
1 0.341 24.747
2 0.160 11.610
3 0.138 9.974
4 0.106 7.656
5 0.088 6.384
6 0.074 5.393
7 0.073 5.265
8 0.058 4.241
9 0.054 3.896
10 0.044 3.218
11 0.041 2.993
12 0.037 2.691
13 0.036 2.620
14 0.032 2.317
15 0.026 1.883
16 0.022 1.574
17 0.017 1.214
18 0.012 0.885
19 0.012 0.864
20 0.008 0.575
21 0.000 0.000
Table 4: Vertebral measurements that display high (i.e. >0.6) correlations on PC axes for the ‘all vertebrae’ PCA
VERTEBRA MEASUREMENT WITHHIGH PC LOADINGS (I.E., CORRELATION >0.6)
PC AXES WITH HIGH LOADINGS CORRELATIONS
ATLAS Length of ventral arch PC1
Length of dorsal arch PC1
Length of transverse process PC1
AXIS Length of centrum PC4