http://www.sciencepublishinggroup.com/j/ijaaa doi: 10.11648/j.ijaaa.20190504.12
ISSN: 2472-1107 (Print); ISSN: 2472-1131 (Online)
Unexpected Seismic Damage vs. SLS Building Code
Anomalies
Thomas Allan Moore
Structural Engineering Division, IDS, Dunedin, New Zealand
Email address:
To cite this article:
Thomas Allan Moore. Unexpected Seismic Damage vs. SLS Building Code Anomalies. International Journal of Architecture, Arts and Applications. Vol. 5, No. 4, 2019, pp. 89-104. doi: 10.11648/j.ijaaa.20190504.12
Received: September 29, 2019; Accepted: November 9, 2019; Published: November 22, 2019
Abstract:
The 1992 advent of the Serviceability Limit State (SLS) was for the purpose of eliminating structural and non-structural damage to buildings subjected to small or moderate SLS Earthquakes (EQs). However, moderate direct non-structural damage and large indirect losses occurred to many medium-rise concrete-framed buildings as a result of small or moderate EQ ground motions in Christchurch CBD 2010 and in Wellington CBD 2013 and 2016. This is shown to be because of SLS flaws in the New Zealand (NZ) building code, (compared with international codes.) Theses flaws explain most of this unexpected damage. It is important to note that if the SLS flaw was not present in the building code and an Sp factor of 1.0 had been used in the design then a more robust building would have resulted and some of the damaged blamed on incompetent engineering may not have occurred. A cost-benefit study is performed here to measure the benefits of correcting the SLS building code flaw. This is important because the Reserve Bank calculates there is now a 30% increase in New Zealand’s projected annualised average loss due to earthquakes. This vulnerability is mostly due to the SLS flaws in the building code, but is also due to deficiencies in engineering building design.Keywords:
Flawed Design, Serviceability Limit State, Structural Damage, Earthquakes, Cost-benefit Analyses, Drift Limit, Building Losses, Structural Performance Factor1. Introduction
Most NZ buildings experienced zero fatalities in recent EQs, by design. However, the large monetary losses and disruption from small and moderate seismic events has been crippling. The 2010-2011 sequence of Canterbury earthquakes left the community with more than $NZD40 billion in losses (20% GDP), demolition of approximately 60% of multi-storey concrete buildings (3 storeys and up,) and closure of the Core Business District (CBD) for more than 2 years [1] Direct damage and large indirect losses occurred to many medium-rise buildings, especially to pre-2004’ precast concrete-framed buildings, as a result of small or moderate EQ ground motions in Christchurch CBD 2010 [1-3] and in Wellington CBD 2013 and 2016 [4-6].
A precedent for a proposed SLS level 1 upgrade was set when Christchurch upgraded to a 50 year recurrence SLS following the 2011 earthquakes [7].
Many modern buildings in NZ have been engineered with only ‘passing regard’ for SLS [8] nor the goal of eliminating
disruption from moderate EQs [9, 10] The proliferation of SLS building damage, and large indirect losses [1] has arisen in NZ primarily because of the specification of a too-small 25 year SLS limit demand, and because the Structural Performance factor (Sp) is specified in NZ as 0.7 for SLS, resulting in a further 30% reduction of the SLS demand. There are also vulnerabilities in ‘pre-2004’ precast floor-to-beam connection detailing [3].
Although the building code NZS1170 was developed in 2004, more recently concrete floor detailing codification/guidance has a chequered history of efforts to upgrade; such as with NZS3101, including draft details in 2006, one of which was subsequently withdrawn, University of Canterbury submitted revisions in 2010, and a draft DBH/MBIE guidance was submitted in 2011, and subsequent guidance-only upgrades have been coming out since 2016. MBIE’s group is still working on agreeing on both assessment of performance and calibration of dilation numbers with drift.
buildings to sustain no structural damage and no, or minimal non-structural damage - with no indirect losses such as occupancy and function disruption due to moderate EQs. An SLS criteria based on a seismic event with a 50-100 year recurrence interval is specified frequently internationally, e.g. in Japan and Europe [10, 11].
2. Cost-benefit Method
A cost-benefit analyses are performed here to measure the benefits of correcting the SLS building code flaw by calculating annualised building loses for a 25, 50, and 100 year EQ return period of the design SLS ground motion. This requires the collection of relevant data, especially direct and indirect losses and loss ratios.
Cost-benefit analyses show that the unexpected NZ building losses may be substantially reduced by using a 50 year rather than the current 25 year SLS limit and/or by specifying Sp = 1. The thus proposed ‘maxi-50 year SLS’ with a drift limit of 0.25%, has the same elastic seismic demand as the 100 year international SLS event [10, 11] (with Sp = 0.7,) and will minimise non-structural and business disruption losses. Much of this damage resulted from the February 2011 M6.3 EQ that, although of short duration, had unusually large peak spectral accelerations in the nearby CBD.
Furthermore, the extent of severe EQ damage or demolition in more than 72 mid-rise buildings in the Wellington CBD due to the small to moderate November 14 2016 ground motions from the distant Kaikōura earthquake raises concerns about the SLS limit designed for these buildings being inadequate in terms of both elastic strength and stiffness [6].
There was a drought of damaging EQs in NZ between 1942 and 2010. This has perhaps resulted in a bias toward thinking small and moderate EQs are not a large threat to the NZ society and its economic well-being. Over that period the engineer’s goal was to design and construct buildings that would allow people to get out alive following a large EQ event. If the building subsequently needed to be demolished, so be it.
When the earthquakes were small or moderate with modest direct damage, but resulted in large indirect losses, losses that were so severe as to require the building to be demolished, or closed-down for many months, then so be it.
There has been much direct damage to pre-2004 precast concrete frame buildings in recent moderate NZ EQs, similar to precast damage from the Northridge EQ of 1994. This moderate damage required expensive repairs, and incurred substantial tenant and business disruption losses exceeding the assigned insured value of the building [1] Consequently, a vulnerability of pre-2004 precast concrete frame structures in NZ to small or moderate EQs is evident. Specific precast design flaws prompted damage, as discussed below. However, such structural design flaws mask the wide extent of general frame building system vulnerability to small or moderate EQs, in the form of both modest direct damage and large
indirect losses.
Closures of buildings can last several months or even years – as is the case for the ‘red-zone’ of the Christchurch CBD. Damage data from the subject NZ earthquakes [1, 5] indicates that indirect losses tend to increase exponentially as restoration time is extended and often exceed the direct losses. A frequent scenario has direct losses at say 40% of replacement cost (insured value,) while the insurance pay-out was 80%-120% to cover indirect losses - at twice the direct losses.
The extent of reported seismic damage due to small and moderate CBD ground motions in NZ from 2010 to 2016 [1-7] suggests that the NZ SLS design limit is specified as too small. Disruptive seismic damage has occurred recently in urban NZ, and will continue at frequent intervals. Seismic damage will initiate for medium-rise buildings in NZ’s dominant urban population of precast concrete frame buildings at approximately half of the 50-100 year SLS threshold damage limit load specified in building codes overseas. Furthermore, such small damaging EQ events will, on average, recur every 25 years.
A quandary arises because the impetus of the 1980s deregulation resulted in a force from the public and building developers to keep the cost of construction down. This political force led to the development of precast columns, beams and flooring systems to speed up construction and hence reduce costs. Consulting NZ engineers practicing at that time have stated, ‘If you advocated stiffer, stronger buildings in the 1980s and 1990s, you would not have a job as a structural engineer.’
A precedent for an SLS upgrade was set when Christchurch City and surrounding districts upgraded the SLS damage threshold earthquake from a 25 year to a 50 year recurrence event following the 2011 earthquakes [7] This local SLS upgrade was not applied across NZ at that time – and was cancelled in 2017.
2.1. Overview of Performance Issues in NZ
Current NZ building codes seek to minimise life-loss during rare large EQs, but do not minimise damage or focus on mitigating business interruption and economic impacts or ensure reparability of buildings after small or moderate ground motions.
There is now also an additional need for specific NZ regulation for the repair of earthquake damaged buildings (and earthquake-prone buildings,) to compensate for the revealed weakness in some of the existing NZ building stock.
Compliance with the new-building Ultimate Limit State (ULS) standards for large 500 year seismic events may have generally been achieved for a 50 year building life, but the inadequate SLS limits are failing building tenants and owners at smaller events.
those buildings damaged by the earthquakes.
A significant number of modern (both pre-and post-2004) mid-rise precast frame buildings with a low to moderate Loss Ratios were deemed uneconomic to repair because of indirect losses equalling or exceeding direct losses, were declared a total insurance loss, and consequently demolished [1-3, 5] Thus the frequently preferred method of dealing with damage to both pre- and post-2004 buildings was often demolition of concrete frame buildings, but this has a particularly high social, economic, and environmental impact due to disruption and waste. There is less data from retrofitted precast Wellington buildings because only limited retrofit to meet level 1 and level 2 improved detailing had been implemented at the time of the 2016 EQ.
The large indirect losses and lack of reparability dictated the course of response. Variables such as insurance coverage, business strategies, perception of risk, building regulations, compliance costs, and government decisions have strongly influenced the post-EQ response for many such damaged buildings [1].
The Canterbury Earthquake Recovery Authority (CERA) reported that approximately 150 ‘significant’ medium-rise buildings (generally commercial and multi-unit residential buildings located in the Christchurch CBD,) were demolished due to the Christchurch 2010-2011 EQ sequence. This represents about 65% of the significant buildings in the CBD [1].
At least 17 buildings subjected to the Wellington November 2016 EQ were demolished. Sixty other medium-rise Reinforced Concrete (RC) buildings were temporarily closed for further investigation or repair.
Furthermore, an important amendment to the NZ Building Act was published following the February 2011 Christchurch earthquake so the repair of earthquake damage is considered as an ‘alteration,’ and this triggers fire and accessibility upgrades. The consequence is that even minor repairs of earthquake damage at low Loss Ratios often require the installation of expensive new fire systems and/or access ramps/lifts, especially for older buildings.
2.2. Compare Drift with EQ Damage
Storey drift is a measure of the maximum lateral deformation experienced by a building, and has been shown to correlate to the damage observed in structural components [12-13] and deformation-sensitive non-structural elements.
SLS goals may be achieved by limiting inter-storey drift, but there has been a diversity of practice in this regard, and drift limits deployed in NZ are often more liberal than international codes allow [5, 10, 12] and so can result in greater direct damage as a result of deploying lower stiffness elements in the design of modern NZ buildings [14]
For example, analytical inelastic models of post-1976 medium-rise RC frame buildings typical of the Christchurch inventory were estimated have a full-yield drift of 0.6% [15] The idealized bilinear load-deflection curve [15] has the first onset of yield at approximately 75% of full yield at the change of slope of the graph so the estimated drift is 0.45%
at first yield - larger than the elastic code limit at SLS of 0.25%, so NZ frame buildings may be more flexible than desired to control non-structural damage.
Figure 1. MBIE building, transverse floor accelerations, Nov 16. Credit [6].
Data from the recent 2016 Wellington CBD ground motions from the Kaikōura EQ at SLS on those sites having firmer soils have shown that frame buildings often suffered building drifts in excess of NZ SLS material standards for new construction [2, 4, 5]:
Concrete buildings: 0.25% per NZS 3109. Steel buildings: 0.20% per NZS 3404.1.
An analytical study of a 12-storey RC frame [12] revealed that when the applied time history load was scaled so one of the inter-story drifts in the modelled frame reached 0.5% in at least one structural element, a damaging rotation of five times the yield limit was exceeded. Substantial structural damage occurred – and only the beams in the ninth and tenth stories did not form post-yield plastic hinges. Furthermore, yielding had initiated in columns, including at least two of the first story columns. When the inter-story drift limit was reduced to 0.2%, post-yield rotation occurred in some elements but not to the extent of rotating as much as even twice the yield limit - with only first exceedance of yield rotation occurring anywhere in the frame [12].
2.3. Amplified Accelerations at Upper Floors
The SLS upper floor acceleration limits are intended to control damage to sensitive building elements such as floor mounted equipment. However, in practice the design methods and limits for anchoring equipment vary significantly [12].
Figure 2. BNZ building, transverse floor accelerations, 3 EQs. Credit [6].
In contrast to the relatively good performance of the MBIE building, the BNZ building (founded on softer soils,) was designed for 1.6 to 2.5 times the demand for softer class D and class E soils than for firmer class C soils, but was severely damaged. The BNZ building experienced a peak floor acceleration of approximately 0.8G at its roof as shown in Figure 2.
The BNZ building experienced both structural and non-structural damage. The extent of non-non-structural damage may be controlled by deploying good detailing of connections to the structure that are designed according to the Parts and Portion item provisions of the NZS1170.5 (2204) building guidelines (aka secondary and critical non-structural items.) These provisions seek to replicate the manner in which such non-structural elements may experience greater accelerations when located at upper floors.
2.4. Influence OF Sp on Losses
The introduction of Structural Performance factor Sp in 1992 [9], was for the purpose of effectively reducing the total ductility demands at ULS but should not be used at SLS and adds to the building losses. The 1995-2004 NZS Standards accordingly resulted in reduction of the stiffness of frame buildings: The Concrete Structures standard in 1995 also reduced the recommended section stiffness, especially for beams, resulting in a given frame being less stiff and with higher period, and hence reduced earthquake demand [9]. This stiffness reduction resulted in excessive storey drifts for some reinforced concrete frames, and hence EQ damage at SLS limits. Such stiffness reduction in the design of modern NZ buildings has been recognised in 2009 as ‘out of line with overseas practice,’ and requires justification [14].
NZS1170 ‘Design for Serviceability’ Clause 4.4.4 has specified since 1992 that a structural performance factor of Sp = 0.70 be used for serviceability level shaking. There has therefore been a reduction in the SLS seismic design forces since 1992 through the NZ code specification of Sp = 0.7.
The specified purpose of the Sp factor according to
NZS1170.5:2004 C4.4 is to consider that: a) Earthquake actions leading to peak response are likely to occur only once per seismic event, and are unlikely to lead to significant damage; b) Individual elements are typically stronger that predicted by analysis due to over-design; c) The total structural system capacity is typically stronger than needed (Redundancy, contribution of non-structural elements such as partitions); d) The energy dissipation capacity of the structural system is generally greater than assumed (due to foundation damping and non-structural elements).
These argued reasons for the Sp factor = 0.7 are not valid for the SLS state because [9].
This concept is based on the idea that inelastic cycles will result in strength and stiffness deterioration. Therefore, if the maximum magnitude of the cycle occurs more than once there will be more damage, and hence a greater probability of failure, than if it occurs only once - as dubiously assumed.
Test specimens subject to increasing magnitudes of displacement in both directions allow distributed cracks to form in both directions of loading. One major cycle of loading may be more critical because the distributed cracks may not form, and one larger crack may occur over which rebar fracture is more likely than in the cyclic case. This situation is therefore more critical than that considering multiple cycles of increasing displacements. This situation has been observed in the Christchurch 2010 and 2011 earthquakes, in the Chilean earthquake of 2010, and predicted analytically [9].
Therefore to deploy a Sp value of less than unity for all materials and systems would appear to require more robust justification than has been provided to date.
Individual structural elements are generally stronger than the required minimum strength predicted by analysis. In some cases the members will be significantly stronger than that needed in design. However, they may also be weaker than the nominal or ‘ideal’ values. For this reason a strength reduction factor is used and a projected larger than nominal member strength cannot be used as justification for a Sp factor less than unity at the SLS limit.
The presence of non-structural elements and redundancy in many structures does contribute to added strength and stiffness. In addition, the presence of floor slabs and of gravity systems have not been included explicitly in the structural analysis of many structures. However, it is the structural elements that must sustain the load, so this does not persuade in favour of using Sp = 0.7 in the design of structural elements. The non-structural elements may be beneficial in reducing some of the demands on the main seismic resisting frame. This justifies the use of the Sp factor at the ULS limit – but is certainly not applicable to the SLS limit [9].
3. Ground Motion Data
3.1. Ground Motion Data – Christchurch 2010
The amplitude of design SLS ground motion is relates directly to building stresses and deformations at normal SLS limits and is compared with on-site ground motions from the EQs of interest.
Typical ground motions in the Christchurch CBD in 2010 and 2011 were recorded [15-18] Samples of records from the 2010 event are shown in Figure 3. The 2010 motions in the CBD are of only moderate magnitude, but had a long duration.
The September 4, 2010, Darfield, Christchurch earthquake is one of the most topical of the recent NZ seismic events because the ground motion in the distant CBD generally had a PGA of approximately 0.2G on class D soils in the CBD [15-18].
The geometric mean of the four elastic acceleration response spectra ground motion records shown in Figure 3 equals approximately 0.3G at T = 0.8 seconds and 0.2G at T = 1.2 seconds. This motion is equivalent to the class D soil pre-2011 ULS design spectra between 0.5-1.5 seconds at Z = 0.22 [15] or approximately twice the pre-2011 25 year SLS event.
Damage in the CBD modern medium-rise RC buildings due to 2010 ground motions in the Christchurch CBD was consistent with the expectations of an event having 2/3 of the pre-2011 ULS ground motion spectra at ductility of 1 per NZS1170.5:2004 [13] = 0.12G to 0.23G at a period range of 0.8 to 1.2 seconds. The recorded motions documented in Figure 3 correspond to approximately twice the pre-2011 SLS limit at Sp = 0.7 of 0.11G at soil class E at a period of 1.2 seconds and even larger than twice the SLS limit of 0.08G at T= 1.2 second at soil class D.)
Signs of incipient brittle failure modes, and inelastic deformation of lightly reinforced beam-column joints and columns, were evident within the weaker pre-1976 RC frame buildings during this 2010 event. Residual joint crack widths of 2-3 mm were measured in some buildings, indicating maximum frame distortion of 0.75% to 1.0% inter-storey drift based on tests [13] This drift or deformation is excessive and 3-4 times the SLS drift limit for a ground motion only twice the SLS limit.
Detailed inspections of these mid- to high-rise RC buildings would be necessary in order to comprehensively evaluate damage and performance of these structures. Unfortunately a much larger EQ ground motion hit the CBD less than 6 months later, on February 22, 2011 and as a result much of the prior uncollected data was compromised.
The SLS spectral acceleration for the pre-2011 mini-SLS is approximately half the recorded 2010 spectral ground motions in the longer period range of 0.8-1.2 seconds. Evidently there was amplification of the recorded ground motions at the longer periods caused by the great depth of gravels and other soft materials underlying the city [18].
Figure 3. Acceleration Spectra at Christchurch Hospital (CHHC) and City Council Building and the Resthaven Home REHS from the 4 September 2010 EQ vs. MCE and ULS at Sp =1, Ductility =1, Soil D. Credit [15].
3.2. Ground Motion Data – Wellington
Ground motions recorded from the 2016 seismic event at the sites of the GNS, NMIT and Wellington Hospital buildings are presented in Figures 4, 5 and 6, along with the 25 year SLS event with Sp = 0.7 (‘mini-SLS’) on both firmer class C and softer class D soils.
These recorded site ground motions shown In Figures 4, 5 and 6 are estimated to correspond to a 25 year event that resulted in mostly non-structural damage on class C and D soils – but resulted in more damage than would have occurred overseas with a 25 year recurrence EQ when international building codes have a 40% or larger design SLS forces.
Figures 4, 5 and 6 show typical ground Spectral Accelerations (SA) at firmer sites (but sites nearby to Statistics House,) were small to moderate - were in the range of 0.15G to 0.3G, and generally 0.15G to 0.18G - at a period of 0.8 seconds on class D soils. This compares with the similar 25 year SLS design SA of 0.16G to 0.23G at ductility of 1.0 for SLS at a range of Sp = 0.7-1.0.
Figure 5. Recorded Ground Motions vs. dashed 25 year mini- SLS with Sp = 0.7 for NMIT Buildings. Credit: [6].
Figure 6. Response Spectra at Wellington Hospital, from November 2016 EQ, compare with.25 year mini- SLS (dashed) at ductility= 1.25 and Sp = 1, vs ULS Spectra at.
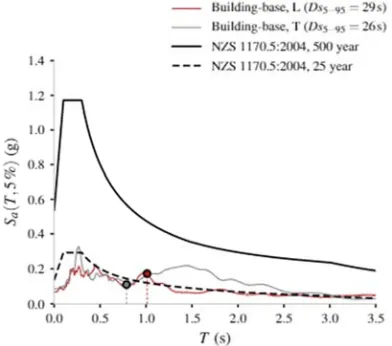
Figure 7. Response spectra for the Wellington MBIE Building for the November 14 2016 EQ compared with 25 year mini-SLS at Sp =1and ductility= 1.25 per NZS 1170.5:2004 vs. 500 year ULS at Sp= 2 and ductility = 1, assumed Soil type D Credit [6].
Figures 7 and 8 show the recorded ground motions from the 2016 seismic event on assumed soft class D soils - or very soft class E or Thorndon Basin soils, are shown in to be approximately 50 percent larger than the 25 year SLS event with Sp = 0.7 (‘mini-SLS’). The Figure 7 motions for the MBIE site correlate well with the class E soil SLS spectra. These larger ground motions are estimated to correspond to a 50 year event that would not have resulted in significant damage overseas when 50 year (or even 100 year) international SLS building codes having at least a 40% or greater design SLS force.
Figure 8. 5% damped acceleration response spectra at Thorndon Fire Station and BNZ Building strong motion stations vs ULS, Sp=1, Ductility – 1, Soil type D assumed to calculate ULS. Credit [4].
The five-storey Statistics House was one of the more severely damaged Wellington buildings in November 2016. The building elastic period was calculated to be a high 0.8 seconds, and increased to 1.2 seconds as the concrete beams cracked-up.
The recorded Spectral Accelerations (SA) shown in Figures 7 and 8 were greater, equal to approximately 0.33G per Figures 7 and 8, at a period of 0.8 seconds and located on the undesirable site soil amplifying conditions of the Thorndon Basin [4-6] This recorded motion is 50% larger than the comparable SLS motion at assumed class E soils of 0.21G for Sp = 0.7. The recorded motions for many Wellington CBD softer soil sites indicated several cycles of inelastic demands, (see Figures 7 and 8.) However, there is reportedly no apparent relationship between the damage and whether or not the building was located on reclaimed land [5].
The damage from ground motions recorded at nearby Thorndon Basin deep soil sites shown in Figure 8 correlate with a class E soil - that are considered to represent an upper bound to the ground motions experienced at the Statistics House site during the November 14 2016 EQ [4] This is based on their generally similar soil profiles and geology, source-to-site distance, and close distance (<2km) to Statistics House.
nearest to the Statistics House site (and others in the Wellington region) per Figure 7 (to a lesser extent,) and Figure 8. Basin-edge effects had been suggested as a potential damage issue. NZS1170.5:2004 does not require basin-edge effects to be considered. However, it is suspected that the ground motion at Statistics House was amplified because seismic waves refracted off the perimeter of this localised geological basin [4].
Although it evident that amplification of ground motions occurred on some sites containing thick deposits of soft soils, including those associated with reclaimed land, such amplification, as shown in Figure 8, is not believed to have been significant at the Statistics House reclaimed site [4] However, it may have been at a few other Wellington sites and resulted in greater damage compared with Statistics House.
4. Building Response Data
4.1. Drift Data – Christchurch
Lateral drifts recorded from the 2010 Christchurch EQ are in the range 0.25%-1.0% and are sufficient to initiate failure modes (depending on the geometry of the lateral resisting frame,) according to recent NZ tests [19]. Recent research [12], has indicated that the onset of damage may be expected at low drifts - above 0.2%.
4.2. Drift Data – Wellington
The peak Storey Drift Ratios SDRs in Wellington Hospital and the MBIE building are shown in Figures 9 and 10, and were generally 0.2 % over the entire height of the building – with localised exceptions. There was no major structural damage and mostly non-structural damage [5], as expected at conforming drifts. However, the BNZ building (Custom Quay,) experienced a maximum peak SDR of 1.8 % at the third floor [6], on Thorndon Basin soils, as shown in Figure 10. This indicates the building lacked adequate stiffness. Substantial damage was suffered.
Figure 9. Inter-storey Drift from 3 Wellington EQs - 2013 Seddon, 2013 Lake Grassmere, November 14 2016 Kaikoura, at Wellington Hospital. Credit: [6].
Note that enforcement of the 0.25% SLS drift limit in NZ building design would address one of the issues around excessive NZ building damage.
Observations of damage to drift-sensitive non-structural components like glazing and panels in the BNZ and the MBIE building may be compared with the computed peak SDRs to develop corresponding fragility data and Loss Ratios.
5. Damage Information
5.1. Building Damage Data - Christchurch
Older RC buildings pre-1976 suffered minor to moderate damage such as cracking, plastic hinges and joint shear failure. Modern post-1976 frame buildings had considerable non-structural and contents damage. However, structural damage was generally limited to cracking in precast flooring systems due to beam elongation, stairways, and gravity load elements – due to inadequate detailing to tolerate the displacement demands.
The non-structural elements damaged in RC buildings were: stairs, internal walls, fire-walls, wall linings, ceilings, windows, and facades.
Several instances of column damage and wide structural cracks on precast concrete flooring units and along the transverse beam and floorings unit of a parking garage suggest that beam elongation up to 5-10 mm occurred in these elements. This suggests yielding of reinforcing bars and formation of plastic hinges. The residual crack widths in the beams also sometimes indicated more than 5 mm elongation at a beam-column joint [1-3].
Residual cracks in the beams indicate elongation of the beams similar to the building responses to the 2016 Wellington EQ, as discussed below.
Depending on the geometry of the lateral resisting frame, moderate 0.25% to 0.5% lateral drift may be sufficient to propagate potential failure modes according to recent test results [9].
One of the more concerning Christchurch EQ outcomes in 2010 was the amount of substantial damage suffered by taller modern RC structures in the moderate CBD ground motion [1-3] A significant portion of the CBD higher-rise buildings were designed following the 1976 NZS4203 loading standards. These buildings can have substantially higher design strength than those designed circa the 1992 standards or to the current NZS1170:5:2004 standards. The ground motion was approximately twice the amplitude of the pre-2011 25 year mini-SLS limit calculated with Sp = 0.7. Several buildings suffered damage requiring months and even years of repair, some of which caused substantial disruption to tenants. In the worst cases this involved building demolitions.
5.2. Damage Data – Wellington
It has been demonstrated that the Wellington CBD experienced damaging ground motions approximately equal
to the ‘mini-SLS’ limits on firmer soil sites, and fifty percent larger ground motions that the larger SLS limits on softer soil sites. Owners of 72 Wellington medium-rise concrete frame buildings with characteristics similar to the EQ-damaged Statistics House were ordered to undertake more invasive testing by the Wellington City Council. Seventeen buildings required demolitions, and 64 required closures or expensive and disruptive repairs [4-6].
Statistics House suffered substantial structural damage in the November 2016 EQ. It has a normal use IL2, assumed soil type D, and a calculated elastic period of 0.8 seconds. The base shear design coefficient for the ‘mini-SLS’ state is Csls = 0.16G at Sp = 0.7. This SLS design limit is 27% less than the recorded demand accelerations on assumed type D soils of 0.15G to 0.3G at a period of 0.8 seconds, with an average of 0.22G. When Csls is calculated with Sp = 1. Then Csls = 0.23G, equal to the recorded accelerations.
The observed damage contravenes the building code intent that the SLS event should demark the threshold of damage - rather than the occurrence of significant structural damage, disruptive repairs, or demolition.
Fifty-seven percent of these Wellington buildings had structural damage and 100% had non-structural damage [5, 6].
In addition to unseating of floor slabs, typical damage consisted of concrete beam yielding – and sometimes cracking or excessive stressing of concrete columns. This damage often started at a relatively low level of seismic demand in Wellington during both 2013 at ground motions less than ‘mini-SLS’ [5] and at 2016 motions [4-6] - and similarly in Christchurch during 2010 and 2011 seismic events [1-3].
Most of the structural damage in Wellington 2016 was concentrated in beams of moment-resisting frames. Beam elongation was identified in at least 16 buildings (22%) - predominantly affecting those buildings with unrestrained corner columns that were being pushed out from the building with unanticipated shear forces. Approximately 24% of the buildings (17) had distributed floor and/or frame damage in various locations, including beam elongation and in some cases significant column damage. A further 26% had relatively localised floor or frame damage, and another 7% only suffered isolated concrete floor damage. The balance of 43% of such buildings had non-structural damage only - to precast concrete cladding panels, stairs, ceiling systems and plasterboard linings. This earthquake damage was observed in concrete frame buildings with precast hollow-core flooring mostly constructed during the 1980s and 1990s [5].
Thorndon Basin. Calculations [4], indicate that the overall strength of the building frames was less than required - only about 75% of required strength. This shortfall in both the frame strength and elastic stiffness contributed to the damage:
The reinforced concrete beams developed plastic hinges due to repeated earthquake cycles. Therefore the beams lengthened through cracks opening as the longitudinal reinforcement in the beam yielded, which was only partially recoverable in cycles of reversing loads - and geometric lengthening, as the contact points in compression between one end of the beam and the other are on the diagonal of the beam.
This development of plastic hinges in the concrete beams of many such buildings led to frame dilation, meaning that the frames grew in length. Some of this lengthening was not recoverable, even though the buildings may have partially self-centred under cyclic loading (as happened with Statistics House). Beam elongation forced the columns apart at each end of the beam, inducing unanticipated column shear forces - for duration of 25-30 seconds and so for many cycles – sometimes of inelastic demand.
The MBIE panel [4] suggests that ‘the stiffness of the frames was less than it should have been, apparently due to the underestimation of the seismic demand (that can be ascribed to the SLS code flaw,) and was a contributing factor to the relatively poor performance that resulted from a moderate seismic event.’
The most extreme concrete floor cracking was at the first floor and at the sliding floor supports in the end bays of the longitudinal frames of Statistics House. There was also widespread damage to secondary and non-structural building elements and contents [4].
There was also substantial non-structural damage to ceilings and MPE equipment.
Sixty-one percent of all such buildings on site class B (rock) exhibited no or minor damage, while 59% of such buildings on site class D exhibited distributed or local damage, indicating a trend of an increase in likelihood of damage with sites founded on deeper softer soils. Six of the eight buildings with significant damage were reportedly located on site class D, with the remaining two located on Site Class C - but very close to the boundary with site class D [5] This suggests that it is timely to consider if the design spectra should be increased for class D and E soils relative to class B soils. Note that a specified SLS drift limit of say 0.25% is irrespective of site soil so buildings constructed on softer soils require a much stiffer building to maintain the same drift limit.
6. Discussion of Eal Results
6.1. Initial Cost vs. SLS Recurrence Interval
An Estimated Annual Loss (EAL) of only 1.3% of the total RC frame building replacement cost, including non-structural elements, has been projected [20] for a hypothetical 100 year SLS event instituted in NZ. Such projections are performed
for a 25 year and 50 year SLS event to compare with the actual damage, and thus deduce the equivalent SLS limit.
There were approximately 35 medium-rise buildings damaged in the small 2013 Wellington earthquakes and 72 damaged in the moderate 2016 Wellington ground motion [4, 5] which were approximately equal to the 25 year SLS limit at firmer soil sites. They were damaged firstly because the buildings were designed for less than half of international seismic standards due to a designated a small 25 year SLS event that defines the threshold of structural damage and many damaged buildings were located on softer soils – the amplifying effect of which the building code evidently fails to properly account for.
The buildings were also damaged because they were designed using Sp = 0.7 rather than Sp = 1, and because some of the buildings were designed with drifts greater than code-specified 0.25% limits.
They were also damaged because precast floor connections, as designed, have a structural vulnerability.
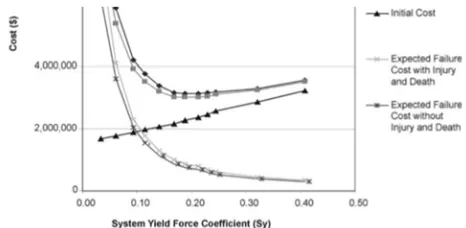
The use of SLS in structural design is a meaningful way of safeguarding against several conflicting desires, such as minimum total Initial Construction Cost (IC) versus minimum future losses from small to moderate SLS seismic events.
The total cost of initial construction, IC, increases as the design base shear is increased from a 25 year to a 100 year SLS event may be calculated according to the simple method of Wen [21]:
Initial Cost, IC = $1800/sq. m. + $3500.SA (1)
This equation is derived from Figure 11, where SA is the Spectral Acceleration demand = 0.08G, 0.12G, and 0.17G at 25, 50, and 100 year SLS limits for class C soil in Wellington. It is the slope of this graph that is relevant.
When SA = 0.08G; IC1 = $2190/sq. m. When SA = 0.17G; IC2 = $2395/sq. m.
Figure 11. Initial Structural Shell Construction Cost versus Lateral Seismic Force for nine story steel frame building in Los Angeles CBD, 2001. Credit: Wen [21].
The increased cost IC2-IC1 = $205/sq. m. = 9% of the initial cost IC for the 100 versus 25 year event in Wellington.
only used to compare costs for different SLS recurrence intervals and so any errors in in the assumption of a linear cost to ground motion intensity relationship over a range of 0.08G to 0.17G SA demand will be minor on this basis.
Thus equation (1) indicates that the increase in total building construction cost due to an increase from 25 year SLS limit base shear from 0.08G to 0.17G at 100 year SLS is 9%. Such construction cost data is plotted in Table 1. This additional construction cost typically results from the stronger beams and columns required for the seismic frames in the elastic range.
Table 1. Percentage of Additional Shell Construction Cost for 50 year and 100 year versus 25 year SLS Event at Class C Wellington site and Class D Christchurch site.
50 year SLS 100 year SLS
Wellington Site 1.6 3
Christchurch 3.7 20
Average 2.7 14.5
6.2. Loss Ratio Results - Non-Structural & Indirect Losses
The total Loss Ratio is the ratio of the repair cost to restore the functionality of a building post-earthquake to the replacement cost, and generally includes both structural and non-structural MPE damage, but does not include the substantial indirect costs. Repair costs are not scaled-up to account for shortage of resources and price increases immediately following an earthquake.
Mean structural-only Loss Ratio for modern medium and high rise concrete frame buildings under MMI VIII shaking are approximately 7% from California data [8, 22, 23]. Data based on drifts of NZs predominantly precast concrete frame buildings suggest that structural Loss Ratios of up to 30% are applicable in NZ [8].
NZ laboratory tests [19, 24, 25, 26], indicate that the NZ inventory of pre-2004 precast concrete frame building have design detail deficiencies that cause larger structural damage in small and moderate EQs. The performance of retrofitted or repaired buildings with precast floors, retrofitted according to Amendment No. 3 to the New Zealand Concrete Design Code NZS 3101 that was recommended in 2004, has been studied in the laboratory [19, 25], and analytically [19, 26]. Substantial improvement in seismic performance has been calculated when particular improved precast floor to beam connections compared with pre-2004 precast floor seating details are used:
A substantial reduction of direct EQ Loss Ratio is calculated when improved precast floor detailing is deployed [19, 26], However, retrofit measures required to achieve such a reduction in the existing inventory have typically not been completed because of the technical difficulties and the direct and indirect cost of retrofit repairs.
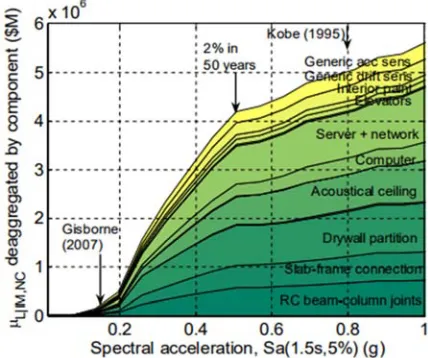
Direct economic losses in structures during small to moderate SLS ground motions are generally dominated by damage to non-structural components and contents rather than structural components [20], and so such damage is also included here.
Figure 12. De-aggregation of the mean direct loss given no collapse relationship to contributions from different components. Credit: [20].
6.3. Direct Loss Results
Available NZ direct Loss Ratios are presented in the form of combined direct structural and non-structural repair costs. Figure 12 illustrates the de-aggregation of the mean direct loss to contributions from different building components.
The total direct structural and non-structural seismic loss has been calculated to be an Estimated Annual Loss (EAL) of only 1.3% of the total cost IC of constructing concrete frame buildings in NZ due to a 100 year SLS event - based on data from laboratory tests and analytical studies [20, 24-26]
This 100 year EAL data [26] can be extrapolated to 50 and 25 year SLS limits:
It is conservatively estimated that the additional cost to design for 100 year SLS with Sp = 0.7 (equivalent to a 50 year event with Sp = 1,) versus 25 year SLS is associated with increasing the design seismic base shear by a factor of 2.25 and this will require an additional one time initial total construction cost IC of 14.5% for a 100 year SLS event, but only 2.7% for a 50 year SLS event in Wellington.
It is calculated that a medium-rise building designed in the highest Seismicity Zones Z = 0.4, such as for Wellington, with a normal use IL2, a period of 1.0 seconds and foundation soil type C will, at the SLS event, experience an increase of design base shear coefficient Csls from 0.08G to 0.12G to 0.17G at Sp= 0.7 when the SLS recurrence interval is increased from 25 years to 50 years to 100 years respectively. (This data is also applicable to zones of lower seismicity such as in Christchurch with seismic Zone Z = 0.3 or Auckland with Z = 0.13 because the design forces scale down in direct proportion to Z.)
It is appropriate to use the lognormal seismic loss model developed by GNS Science [20, 25, 26], to further develop a probabilistic financial risk assessment framework to estimate the EAL from previously developed NZ Loss Ratios and fragility data for concrete frame buildings with precast hollow core floors seated on the building frames according to the pre-2004 standard.
indicates Damage State DS3 dominates - rather than the occurrence of any severe DS4 damage as observed in Wellington on November 14 2016, suggesting that calibration of this 2006 data may be required now that additional damage data is available.
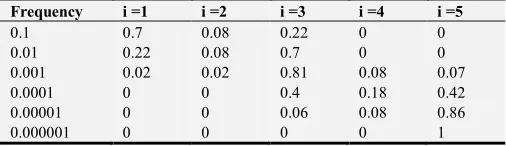
Table 2. Probability of a given Damage State DSi; i =1to 5 for Pre-2004 Buildings with Precast Floors. Credit: [26].
Frequency i =1 i =2 i =3 i =4 i =5
0.1 0.7 0.08 0.22 0 0
0.01 0.22 0.08 0.7 0 0
0.001 0.02 0.02 0.81 0.08 0.07
0.0001 0 0 0.4 0.18 0.42
0.00001 0 0 0.06 0.08 0.86
0.000001 0 0 0 0 1
Table 2 shows the probabilities of being in a specific Damage State DSi for such medium-rise buildings. For example, the second row in Table 2 indicates that if an earthquake of annual frequency of fa = 0.01 (i.e. return period of 100 years) strikes, the probability of DS1 (no damage) in buildings with the vulnerable pre-2004 precast-floor connection detailing is 22%; the corresponding probabilities for medium-destructive Damage States (DS2 and DS3) occurring is 7% and 70% respectively.
Table 3. Loss Ratios for different Damage States DS1, DS2, DS3, DS4, and DS5 vs. Loss Ratio. Credit [26].
DS1 DS2 DS3 DS4 DS5
Range 0 0.05-0.15 0.2-0.4 1.0 1.0
Assign LR 0 0.1 0.3 1 1
This means that when an EQ with an annual frequency of fa = 0.01 strikes, there is 70% probability that the damage to this class of precast frame buildings will be in mildly destructive range DS3 (in the range of Loss Ratios LR3
according to Table 3), and 0% for severely damaged Damage State DS4 with a Loss Ratio of LR4=1.0.
6.4. Loss Ratio VS. Damage State
The assigned ranges of Loss Ratios LR for different Damage
States DSi are shown in Table 3. Irreparable damage under DS4 state demands replacement because repair may be uneconomic; hence the Loss Ratio LR = 1 is used for DS4. Similarly for DS5
representing collapse, so the assigned Loss Ratio is 1. The financial risk is sensitive to the assigned values of Loss Ratios, especially the value for DS3 and DS4. Hence, judgement was applied by researchers in selecting the initial 2006 Loss Ratio values [26], and in making upgrades here.
Damage data is also available from an analytical inelastic model of typical medium-rise RC frame precast buildings in Christchurch subjected to the approximately 1000 year February 2011 EQ [15]. The probabilities of being in a given Damage State DSi for this inventory of buildings are shown on line 3 of Table 4. Attention is focussed on post 1976 medium-rise precast buildings for which damage data and can be compared with Table 2.
Table 4. Estimated Probability of Damage States DSi for RC Frames in
Christchurch at 1000 year EQ event.Credit [15].
DS1 DS2 DS3 DS4 DS5
Low-rise post 1978 3 31 24 16 27
Low-rise pre 1978 3 16 25 20 36
Med.-rise post 1978 0 21 57 14 8
Med.-rise pre 1978 0 2 28 45 25
Damage data from line 3 of Table 4 for medium-rise post-1976 RC precast frames at a 1000 year event shows:
DSi = (0.0, 0.21, 0.57, 0.14, 0.08) i =1-5
Compare damage data from Line 3 of Table 2 for a 1000 year recurrence event for generic RC frames [26]:
DSi = (0.02, 0.02, 0.81, 0.08, 0.07) i = 1-5
Note that Table 4 data is based on a Damage States DS1 corresponding to a yield drift limit of 0.6%, and DS4 corresponds to a ULS drift limit of 2.5% - different from the definitions of Damage States versus Loss Ratios shown in Table 3 and used in Table 2, but similar. A better correlation between Tables 2 and 4 can be achieved if (DS3, DS4) data from line 3 of Table 2 is changed from (0.81, 0.08) to (0.70, 0.19) to match closer with line 3 of Table 4. (The data from these couplets must total 1)
Table 2 data may be modified to more closely match the Wellington loss data such as for Line 2 of Table 2: The line 2 DS4 loss data from Table 2 specifies 0.0% probability of occurrence of 100% Loss Ratio when in reality pre-collapse demolition occurred with more than 100% loss for several RC frame ‘pre-2004’ precast buildings during the 2016 Wellington ground motions. This ground motion had a recurrence interval of approximately 25 years and at least 17 of the RC frame buildings had distributed floor and/or frame damage in various locations, including beam elongation and in some cases severe column damage corresponding to DS4 damage. Several buildings were demolished. A further 21 buildings had relatively localised floor or frame damage corresponding to Damage State DS3. Therefore the 2006 line 2 Damage Data DSi corresponding to a 100 year event [26], (70%, 0%) for (DS3, DS4), is subjectively updated to (47%, 23%).
Table 5. Damage Data DSi for 100 year event modified from Line 2 of Table 2 for 17% more damage.
f=0.01 DS1 DS2 DS3 DS4 DS5
Table 2, line 2 0..22 0.08 0.70 0 0
Modified 0.22 0.08 0.47 0.23 0
6.5. Quantified Financial Loss
repair costs to the variation of damage according to the ground motions and soil conditions at the subject building sites.
The cost-benefit of avoiding EQ losses by substituting a design 25 year recurrence interval with a 50 year and 100 year interval is calculated by using the assigned probability of loss L(DSi) for the range of damage states DSi for various 25 to 100 year seismic SLS events. The contribution of different Damage States DSi to the financial loss has been calculated [26], and is shown in Table 6 below as the ratio of total direct probable financial loss to the total replacement cost for different damage states when EQs strike with a range of annual frequencies. This financial data enables a direct comparison of 25 year, 50 year, and 100 year recurrence SLS projections of total losses per event.
Table 6 is derived from the Table 2 data and shows the probability of loss L(DSi) is greater for DS4 and DS5 than for other damage states at recurrence frequencies of between 0.001 and 0.00001. However because the larger probabilities of loss L(DSi) are multiplied by very small frequencies of occurrence to estimate total losses, these larger L(DSi) contribute less to the total probable building losses from seismic events. Irrespective, they are added to calculate LR
for each recurrence interval.
Table 6. Probable financial Loss Ratio L(DSi) for Pre-2004 buildings.Credit: [26].
Frequency L(DS1) L(DS2) L(DS3) L(DS4) L(DS5) Total LR
0.1 0 0.004 0.006 0 0 0.07
0.01 0 0.004 0.21 0 0 0.214
0.001 0 0.001 0.243 0.06 0.07 0.374
0.0001 0 0 0.12 0.135 0.426 0.675
0.00001 0 0 0.018 0.06 0.86 0.938
0.000001 0 0 0 0 1 1
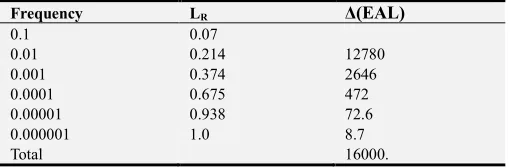
Table 7. EAL from a summation of seismic events for pre-2004 buildings. Note that 80% of the loss derives from the assigned 100 year SLS event, f= 0.01. Credit: [26].
Frequency LR ∆(EAL)
0.1 0.07
0.01 0.214 12780
0.001 0.374 2646
0.0001 0.675 472
0.00001 0.938 72.6
0.000001 1.0 8.7
Total 16000.
The resulting data in Table 7 for pre-2004 RC buildings is derived as the product of the probability of loss integrated over frequency of occurrence of a given seismic event, obtained by roaming Table 2 in conjunction with Table 6 and integrating frequency of occurrence with the assigned probability of loss L(DSi) from table 6 over the range of frequencies and Loss Ratio LR at Damage State DSi from Table 2.
In the case of buildings designed to pre-2004 standards, smaller EQs with a frequency of 0.005 (or less,) dominate the total financial loss due to earthquakes. The Estimated Annual Loss EAL for earthquakes of a given probability may be computed from the last column of Table 7 as the sum of the contributions of the five quantified damage states and the
probability of occurrence. The total ∆(EAL) is dominated by the frequent small earthquakes.
Table 7 shows the total direct financial loss incurred by all minor earthquakes with a 0.1 or higher annual frequency (recurrence intervals of 10 years or less,) is 7% of the total cost and is mostly due to repairable damage in precast-floored buildings with vulnerable detailing of pre-2004 standards. This NZ data may be interpolated to calculate EAL data for a 25 year return period as follows:
The effective ∆(EAL) = 0.9(LRi + LRj)/2 x Fk (2)
Where LRi, LRj are probabilities of loss at consecutive
damage states DSi and DSj respectively and Fk is the frequency of the seismic event for the subject EQ frequency F at interval k in Table 7
Considering the 100 year SLS event data from Table 7, 80% of the total Estimated Annual Loss EAL is calculated as the risk posed by frequent but small-to-moderate EQs - those with an annual frequency in the range between 0.01 and 0.1 - i.e. return periods between 10 and 100 years. [26]
The Table 2 data only applies specifically to a location with a 100 year SLS criterion where the buildings are designed to be stronger than designed in NZ, designed to have no significant damage at smaller seismic events with less than a 100 year recurrence interval, and therefore must be extrapolated to apply to weaker buildings designed with 25 and 50 year SLS limits.
The total EAL can be calculated by integrating the probabilities of loss L(DSi) over all possible annual frequencies of the seismic hazard; i.e. between 0 and 1. The resulting general differential equation in continuous form is presented in references [20, 26].
The required integration of the general equation defining financial loss may be conveniently achieved graphically with a semi-log plot.
Therefore when a population of medium-rise frame buildings with precast floors, designed for a 100 year SLS event, are subjected to the natural full range of seismic events ranging from f = 0.01 to f = 0.0001, it is calculated that the Estimated Annual Loss, EAL = $16,000 per $1 million invested or 1.6% per Table 7 [26] It is then calculated that 80% of this EAL (equals 1.3% of equivalent annual investment, or $12,780 per $1 million,) is due to the proposed 100 year design SLS event [26].
The corresponding EAL for typical weaker NZ buildings, resulting from a 25 SLS year event defining the threshold of damage, may be calculated by multiplying the 100 year loss, $12,780/$mil (= 1.3%,) by four to account for quadrupling the recurrence from 100 to 25 years, and then multiplying by a scale factor 0.51* to account for the scaling down and smaller building damage loss for the smaller 25 year SLS event versus the larger 100 year SLS event. The 0.51* factor is derived is follows:
The total loss ratio LR for a 25 year SLS event may be
calculated by linear interpolation between a total loss ratio LR
of 0.214 at f = 0.01 and LR = 0.07 at f = 0.1: The result is an
= 0.025) so the scale factor = 0.11/0.214 = 0.51*, assuming a linear distribution of loss versus frequency plotted on a semi-logarithmic scale in the range f = 0.1 to 0.01.
It is calculated that the EAL from designing for the smaller more frequent SLS event with a 25 year recurrence interval rather than the 100 year SLS event is $12,780 x 4 x 0.51* = $26,300 per $1 million of investment or 2.6% per year for a 25 year SLS event.
It is similarly estimated that the EAL for total annual losses that result from a 50 year SLS earthquake event rather than the 100 year SLS event is $12,780 x 2 x 0.65= $16,640 (1.7%) of direct costs per $1 million of investment.
Published research [26] measures Loss Ratios for buildings without retrofitted or upgraded precast concrete floors. The resulting data is used here to represent the damage states reported from the November 2016 ground motions in Wellington where some irreparable DS4 levels of damage occurred.
The EQ losses calculated here for NZ pre-2004 concrete frame buildings with precast floors are larger than calculated overseas [20] with an unmodified total direct Estimated Annual Loss (EAL) of more than 2.6% at a 25 year SLS and a Life Cycle Cost of 2.6% x 50 years, which is in excess of 100% of the original construction.
Note from line 2 of Table 6, or the ‘total’ column of Table 7, that the total financial loss has been calculated as 0.214 at 0.01 annual rate SLS event.
It is calculated that the Estimated Annual Loses must be increased by 17% to account for the upgrading modification on line 2 of the loss data at Damage State DS4 shown in Table 5.
6.6. Quantified Indirect Losses
Indirect losses such as tenancy and business interruption have typically not been included in loss estimates until recently [20] Recent estimates [8, 27, 28] and HZUS case study surveys suggest that even at small ground motions, indirect losses such as tenant disruption are a minimum of 50% of the direct damage loss - and the indirect losses grow as the ground motion increases to exceed the direct costs [27] Marquis [28] has collated data that indicates that the insurance companies covering the losses in the red zone of Christchurch in 2010– 2011 typically were insured to 250% of their estimated replacement value (sum insured) with a minimum of 24 months and often 36 months of business interruption insurance cover based on average data from a case study of 17 medium-rise buildings [28] However the average repair/replacement cost was 325% of the initial replacement cost assigned, or 30% greater than the sum insured. This difference between actual replacement or repair cost ratio and the assigned Loss Ratios used above must be added to the indirect losses.
A frequent scenario for NZ insurance companies suffers direct losses at say 40% of assigned initial replacement cost (insured value) while the insurance pay-out was approximately 120% of this value to cover indirect losses – indirect losses at often 200% of the direct losses.
It is assumed here that indirect losses are equal to (100%) of the direct damage losses in the SLS range of ground motions for medium-rise RC buildings in central business districts. Any error in this assumption will be diluted because this loss data is only used for comparison among various loss scenarios including this same assumption of indirect losses being equal to the direct damage.
Downtime (business disruption) and other indirect losses may often exceed 100% of direct damage, may reach 200% whence the EAL data in table 8 below would need to be increased by 150%.
Significantly improved seismic performance of buildings could be achieved either by (i) improving component fragilities via modifying connection details for non-structural components connected to the structural frame; fastening acceleration sensitive mounted components, base isolating expensive components (e.g. servers, electrical equipment); or (ii) by reducing seismic demands throughout the structure for the same level of ground shaking via increased viscous and hysteretic damping using dissipation devices or base isolation devices.
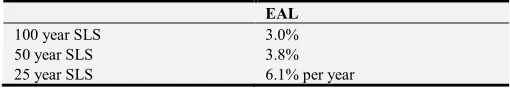
The EAL loss is estimated to approximately double to 2.6% when indirect costs such as tenancy disruption and adjunct business disruption are included [8, 22, 23, 27, 28] The EAL data for 25, 50 and 100 year SLS limits is modified in Table 8 after doubling the numbers to account for indirect losses and after applying a further 17% adjustment to account for the calibration of the Loss Ratio data at (DS3, DS4) to Wellington damage observations from the 2016 EQ.
Table 8. EAL for Structural + Indirect Losses versus Recurrence Interval for various Design SLS events in NZ.
EAL
100 year SLS 3.0%
50 year SLS 3.8%
25 year SLS 6.1% per year
7. Discussion of Other Explanations of
Damage
It has been shown in this paper that unexpected damage of modern buildings occurred due to recent small and moderate earthquakes in New Zealand because of SLS flaws in the NZ building code, (compared with international codes.) This explains at least part if not all of this damage.
However, engineering standards are reported as falling in NZ [29-30] and questions are being raised about whether the building code is fit for purpose [30] It is important to note that if the SLS flaw was not present in the building code and an Sp factor of 1.0 had been used in the design then a more robust building would have resulted and some of the damaged blamed on incompetent engineering may not have occurred.
buildings failed in the 2010-2011 Christchurch/Canterbury Earthquake sequence and in Wellington during the 2016 Kaikoura Earthquake, the code must be flawed or faulty. The director of the Australasian arm of Munich Re says the reinsurance giant is "pretty grumpy" about the poor resilience of New Zealand's buildings [30] The Reserve Bank calculates there is a 30% increase in New Zealand’s projected annual average loss due to earthquakes [30].
Building Minister Jenny Salesa, head of MBIE, has stressed that the biggest overhaul of building regulations in 15 years is underway [31]. MBIE says the current voluntary Chartered Professional Engineers (CPEng) scheme doesn't “serve its purpose” in measuring engineering competence [31] The proposed reforms will attempt to establish a voluntary certification overseen by MBIE along with stronger sanctions for engineers acting unethically or doing substandard work [31].
Unfortunately, unexpected damage to modern medium rise office buildings due to recent NZ earthquakes is also reported as entirely due to inadequate engineering design because of misunderstandings of irregularity, torsion, elongation, ratcheting, diaphragm action, geology, and the importance of geotechnical investigations [32] Design engineers also sometimes failed to understand the response of soil types and foundations to earthquakes [32] The consequential design errors are claimed to exclusively explain all the unexpected failure modes and structural damage that has occurred due to small and moderate earthquakes such as at only SLS loading [32].
Local building-consenting authorities have also been apportioned blame: For example, a NZ engineering principal has claimed Wellington City Council ignored written concerns about the seismic design of the BNZ building's floors in permitting the construction of the quake-damaged BNZ building years prior to the 2016 earthquake [33].
There is also a claim that the construction industry is to blame: “The government's latest MBIE review of building rules cannot hope to address severe problems in the construction industry” [34] This follows evidence from a concrete scanning company that hundreds of major buildings have not been built according to plan [34]. There has also been blame ascribed to the construction industry around construction deviating from the building plans. Design engineers are required, however, to sign Producer Statements at the end of a project stating it has been built in compliance with the Building Code and consented plans.
Local engineer, John Scarry, said the poor building construction performance resulted from "100 percent legislative and bureaucratic failure" over the last three decades [34] He dismissed the review of building laws and regulations underway by MBIE as an "industry group hug. The problem is beyond bureaucratic repair because it is due to a lack of engineering technical competence." [35]
Investigation prompted by poor building performance has found system-wide problems and that basic mistakes are slipping through auditing systems, quality assurance, peer review - and that construction monitoring needs to be addressed in a systematic way [35] “There is currently no
technical auditing program for structural engineering design in the building sector,” Hamish McKenzie, President of the Structural Engineering Society says [35].
The excessive seismic building damage in NZ is due to both flaws in the building code, and to deficient engineering. It is concerning that industry leaders, such as Engineering NZ [31] and the Royal Commission [32] apparently seek to contradict ICNZ [30] and MBIE [31] by avoiding the recognition that the NZ building code is flawed - such as due to SLS and Sp flaws discussed here, and so has contributed majorly to the unexpected damage.
8. Conclusions
Cost-benefit analyses show that building EQ losses may be reduced most efficiently by both correcting the precast floor-to-beam connection and other structural design flaws, and by using a 50 year rather than the current 25 year SLS limit while specifying Sp = 1 at the SLS limit loading. The thus proposed ‘maxi-50 year SLS’ with a drift limit of 0.25%, has the same elastic seismic demand as the 100 year SLS event deployed internationally [10, 11] (with Sp = 0.7) and so will normalise structural, non-structural, and indirect business disruption losses. These proposed changes to the NZ building code could generally have reduced to minimal levels, or eliminated damage for ‘pre-2004’ and post-2004 medium-rise RC concrete frame buildings in what were small to moderate seismic ground motions in 2010 and 2016 in the Christchurch and Wellington city CBD’s respectively.
However, there are particular damaging issues that remain to be resolved such as the effects of softer soils, geotechnical basin effects, and how to economically retrofit buildings; particularly ‘pre-2004’ precast floor connections.
There is an initial one-time cost increase of approximately 2.7% per new medium-rise RC building to change to an equivalent 50 year SLS in NZ with 40% greater elastic seismic demand. However, this initial cost is recouped with an estimated annualised loss (EAL) reduction of (6.1% - 3.8% from Table 8) = 2.3% annualised reduction of EQ loss from upgrading the SLS limit.
It is more cost-effective to upgrade the current 25 year SLS limit to an equivalent 50 year limit (with a 40% increase of elastic seismic demand,) rather than a 100 year limit (with a doubling of elastic SLS seismic demand.) because a lower initial investment in construction cost is required - although a similar rate of return on investment may be achieved from both the 50 and 100 year SLS EQ loss reduction options.
However, NZS 1170.5:2004 and the current materials standards specify an unsubstantiated Sp = 0.7 for serviceability. This should be changed to Sp = 1, with a further 40% increase of SLS elastic seismic demands if both upgrades are applied – equivalent to a 100 year limit with a doubling of design forces.
![Figure 1. MBIE building, transverse floor accelerations, Nov 16. Credit [6].](https://thumb-us.123doks.com/thumbv2/123dok_us/1010979.1601033/3.595.322.535.123.322/figure-mbie-building-transverse-floor-accelerations-nov-credit.webp)
![Figure 2. BNZ building, transverse floor accelerations, 3 EQs. Credit [6].](https://thumb-us.123doks.com/thumbv2/123dok_us/1010979.1601033/4.595.62.271.74.276/figure-bnz-building-transverse-floor-accelerations-eqs-credit.webp)