Article
Gene Prioritization Through Consensus Strategy,
Enrichment Methodologies Analysis and Networking
for Osteosarcoma Pathogenesis
Alejandro Cabrera-Andrade 1,2,3*, Andrés López-Cortés 3,4, Gabriela Jaramillo-Koupermann 5, César Paz-y-Miño 4, Yunierkis Pérez-Castillo 1,6, Cristian R. Munteanu 3,7, Humbert González-Díaz 8,9, Alejandro Pazos 3,7, Eduardo Tejera 1,10*
1 Grupo de Bio-Quimioinformática, Universidad de Las Américas, Quito 170125, Ecuador;
[email protected] (A.C.-A.); [email protected] (Y.P.-C.); [email protected] (E.T.)
2 Carrera de Enfermería, Facultad de Ciencias de la Salud, Universidad de Las Américas, Quito 170125, Ecuador
3 RNASA-IMEDIR, Computer Sciences Faculty, University of A Coruna, A Coruña 15071, Spain; [email protected] (C.R.M.)
4 Centro de Investigación Genética y Genómica, Facultad de Ciencias de la Salud Eugenio Espejo,
Universidad UTE, Quito 170129, Ecuador; [email protected] (A.L.-C.); [email protected] (C.P-y-M.)
5 Laboratorio de Biología Molecular, Subproceso de Anatomía Patológica, Hospital de Especialidades Eugenio Espejo, Quito 170403, Ecuador; [email protected] (G.J.-K.)
6 Escuela de Ciencias Físicas y Matemáticas, Universidad de Las Américas, Quito 170125, Ecuador
7 Biomedical Research Institute of A Coruña (INIBIC), University Hospital Complex of A Coruña (CHUAC), A Coruña 15006, Spain; [email protected] (A.P.)
8 Department of Organic Chemistry II, University of the Basque Country UPV/EHU, Leioa 48940, Spain 9 IKERBASQUE, Basque Foundation for Science, Bilbao 48011, Spain; [email protected]
(H.G.-D.)
10Facultad de Ingeniería y Ciencias Agropecuarias, Universidad de Las Américas, Quito 170125, Ecuador * Correspondence: [email protected] (A.C.-A.); [email protected] (E.T.)
Abstract: Osteosarcoma is the most common subtype of primary bone cancers, affecting mostly
adolescents. In recent years, several studies have focused on elucidating the molecular mechanisms of this sarcoma; however, its molecular etiology has still not been determined with precision. Therefore, we applied a consensus strategy with the use of several bioinformatics tools to prioritize genes involved in its pathogenesis. Subsequently, we assessed the physical interactions of the previously selected genes and applied a communality analysis to this protein-protein interaction network. The consensus strategy prioritized a total list of 553 genes. Our enrichment analysis validates several studies that describe the signaling pathways PI3K/AKT and MAPK/ERK as pathogenic. The gene ontology described TP53 as a principal signal transducer that chiefly mediates processes associated with cell cycle and DNA damage response It is interesting to note that the communality analysis clusters several members involved in metastasis events such as MMP2 and
MMP9 and genes associated with DNA repair complexes, like ATM, ATR, CHEK1, and RAD51. In
this study, we could identify well-known pathogenic genes for osteosarcoma and prioritized genes that need to be further explored.
Keywords: gene prioritization; osteosarcoma; communality analysis; pathogenesis; early
recognition
1. Introduction
In recent years, high-throughput technologies have focused on studying the molecular etiology of osteosarcoma (OS) worldwide [1-5]. Valuable information has been gained about whole genetic groups that describe cellular and molecular changes in OS [6, 7]. Despite this, there has not been an agreement about specific driver genes for OS etiology, nor have new biomarkers been proposed to be used as therapeutic targets.
OS tumors are characterized by being heterogeneous and showing high rates of somatic structural variations. Their heterogeneity is closely related to their high rates of mutations, which are comparable to breast tumors and leukemia [8-10]. Moreover, cytogenetic abnormalities in OS tumors, including chromosomal segment loss, rearrangement, and amplification with karyotypic complexity in the absence of recurrent clonal translocations have been described [11, 12]. This acute chromosomal instability and widespread deregulation in cell signaling pathways could be the main limitations for the description of specific gene drivers associated with OS. It is therefore necessary to develop an integrative study focused on the biology of systems described for this tumor.
The use of prioritization strategies, through computational tools that use multiple heterogeneous data sources, allows for the improvement in gene detection related to complex traits or specific clinical phenotypes [13, 14]. In addition, applying the functional enrichment analysis has proven to be a very efficient approach in gene prioritization, because it describes important metabolic interactions which aid in explaining the pathogenesis of a given disease [15, 16]. Thus, we used several bioinformatics tools in order to prioritize genes that describe oncological signaling pathways for OS and also applied a consensus strategy with the aim to specify and postulate new pathogenic mechanisms that explain the onset and development of this sarcoma.
2. Results
2.1. Consensus prioritization
We chose nine bioinformatics methods that fulfilled two main criteria: full availability in web service platform and only requiring the disease name (or OMIN code, 259500 for OS) for gene prioritization. In total, the combination of all methodologies resulted in 15,809 genes.
The validation strategy for gene prioritization was performed from the identification of specific genes involved in the OS pathogenesis. For this, we took into consideration pathogenic OS genes defined by a literature review of two types of studies: meta-analysis, based on publications and case reports for OS patients (named as G1 genes), and gene description in animal models and in OS cell lines (named as G2 genes). Thereby, we identified 75 pathogenic OS genes from the available literature, of which 47 were classified as G1, and 41 as G2 (Supplementary Table S1).
Table 1. Identification (in %) of pathogenic genes in each OS approach.
Methods 1% 5% 10% 20%
G1 G2 G1-2 G1 G2 G1-2 G1 G2 G1-2 G1 G2 G1-2
BioGraph 0 0 0 0 18.2 12.5 40 45.5 37.5 60 54.6 50 CIPHER 7.7 6.7 8.7 7.7 6.7 8.7 23.1 20 17.4 30.8 26.7 26.1 DisGeNET 9.5 16.7 10.8 21.4 30.6 21.5 42.9 58.3 46.2 57.1 77.8 64.6 Genie 37.8 36.1 35.3 62.2 61.1 57.4 75.6 69.4 70.6 86.7 75 80.9 GLAD4U 0 0 3.6 19.1 33.3 25 42.9 50 46.4 57.1 66.7 64.3 GUILDify 10.9 7.5 8.2 13 7.5 9.6 21.7 17.5 19.2 34.8 25 30.1 Phenolizer 33.3 36.6 30.1 57.8 61 53.4 62.2 61 56.2 77.8 75.6 72.6 PolySearch 0 0 0 11.1 14.3 7.1 11.1 28.6 14.3 11.1 28.6 14.3 SNPs3D 10 10.5 6.3 10 42.1 25 40 57.9 50 75 73.7 71.9 Consensus 66 61 60 87.2 80.5 81.3 89.4 82.9 84 93.6 85.4 88
On the other hand, the mean ranking of the pathogenic genes detected in the top 1% of the list is 49.3 (Table 2), which means that 45 G1-G2 genes are located in the top 50 positions. This mean is higher than that calculated for the other prioritization methodologies given that the number of pathogenic genes detected is greater. However, it is interesting to note that the number of genes and the ranking average are similar, which indicates that the majority of these pathogenic genes are found in the top positions.
Table 2. Rank of pathogenic genes in each OS approach.
Methods 1% 5% 10% 20%
G1 G2 G1-2 G1 G2 G1-2 G1 G2 G1-2 G1 G2 G1-2
BioGraph - - - - 3.5 3.5 7 6 6.3 9.5 7.3 8 CIPHER 2 7 4.5 2 7 4.5 41.3 43 32.8 58 59 57.7 DisGeNET 5.3 4.2 4.7 12.1 10 11.1 23.9 23.6 25.2 31.6 31.4 33.7 Genie 17 14.6 16.5 44 41.6 42.6 88.2 75 91.3 148.5 113.2 151.9 GLAD4U - 1 1 4 4.2 4 8.6 6.6 8.2 13.3 10.2 13 GUILDify 15.8 8.3 16.7 42.6 8.3 43.3 366.5 536.4 491.2 873.8 973.9 972.1 Phenolizer 44.3 28 36.4 150.4 120.9 148 200.9 120.9 182.5 477.5 429.2 513.2 PolySearch - - - 2 2 2 2 2.5 2.5 2 2.5 2.5
SNPs3D 1.5 1.5 1.5 1.5 6.4 4 17.8 10.9 14.4 27.1 16.2 21.6 Consensus 54.5 41.6 49.3 126.1 108.2 128 152.9 131.2 157.7 241.4 174.7 239.3
This initial prioritization generated an initial amount of 15,809 genes, so a rational cut-off was applied. The maximum variation between Ii and the gene ranking was 0.7609, corresponding with a ranking value of 553. Therefore, this cut-off reduces a list of 15,809 members to a consensus of 553 genes (Supplementary Table S2), which corresponds to 3.5% of the total. The rate of pathogenic detection of the consensus was 87.2 % for G1 (41 out of 47), 80.5 % for G2 (33 out of 41) and 81.3 % for G1 and G2 (61 out of 75), higher than the other methods in the top 5% onwards.
2.2. Enrichment analysis of OS related genes and the protein-protein interaction network
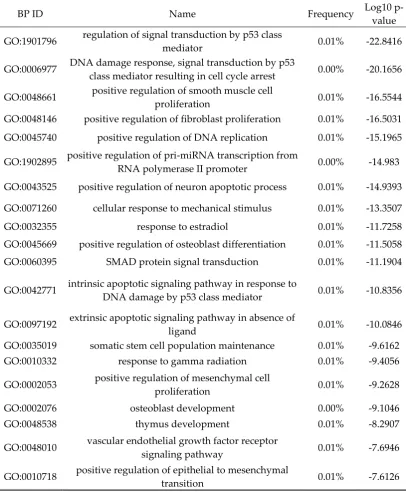
A gene ontology (GO) analysis and pathway enrichment analysis were applied in order to describe biological functions from the consensus genes, by using David Bioinformatics Resource [17,
Table 3. Some biological processes by enrichment analysis in OS consensus genes.
BP ID Name Frequency Log10 p-value GO:1901796 regulation of signal transduction by p53 class
mediator 0.01% -22.8416 GO:0006977 DNA damage response, signal transduction by p53
class mediator resulting in cell cycle arrest 0.00% -20.1656 GO:0048661 positive regulation of smooth muscle cell
proliferation 0.01% -16.5544 GO:0048146 positive regulation of fibroblast proliferation 0.01% -16.5031 GO:0045740 positive regulation of DNA replication 0.01% -15.1965 GO:1902895 positive regulation of pri-miRNA transcription from
RNA polymerase II promoter 0.00% -14.983 GO:0043525 positive regulation of neuron apoptotic process 0.01% -14.9393 GO:0071260 cellular response to mechanical stimulus 0.01% -13.3507 GO:0032355 response to estradiol 0.01% -11.7258 GO:0045669 positive regulation of osteoblast differentiation 0.01% -11.5058 GO:0060395 SMAD protein signal transduction 0.01% -11.1904
GO:0042771 intrinsic apoptotic signaling pathway in response to
DNA damage by p53 class mediator 0.01% -10.8356
GO:0097192 extrinsic apoptotic signaling pathway in absence of
ligand 0.01% -10.0846 GO:0035019 somatic stem cell population maintenance 0.01% -9.6162 GO:0010332 response to gamma radiation 0.01% -9.4056 GO:0002053 positive regulation of mesenchymal cell
proliferation 0.01% -9.2628 GO:0002076 osteoblast development 0.00% -9.1046 GO:0048538 thymus development 0.01% -8.2907 GO:0048010 vascular endothelial growth factor receptor
signaling pathway 0.01% -7.6946 GO:0010718 positive regulation of epithelial to mesenchymal
transition 0.01% -7.6126
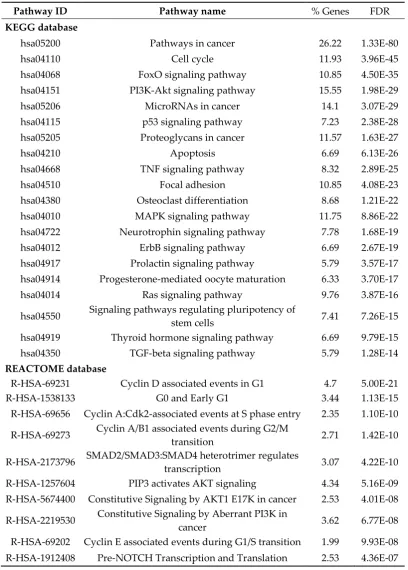
Table 4. Pathways enrichment analysis using KEGG and Reactome databases in OS consensus genes.
Pathway ID Pathway name % Genes FDR
KEGG database
hsa05200 Pathways in cancer 26.22 1.33E-80 hsa04110 Cell cycle 11.93 3.96E-45 hsa04068 FoxO signaling pathway 10.85 4.50E-35 hsa04151 PI3K-Akt signaling pathway 15.55 1.98E-29 hsa05206 MicroRNAs in cancer 14.1 3.07E-29 hsa04115 p53 signaling pathway 7.23 2.38E-28 hsa05205 Proteoglycans in cancer 11.57 1.63E-27 hsa04210 Apoptosis 6.69 6.13E-26 hsa04668 TNF signaling pathway 8.32 2.89E-25 hsa04510 Focal adhesion 10.85 4.08E-23 hsa04380 Osteoclast differentiation 8.68 1.21E-22 hsa04010 MAPK signaling pathway 11.75 8.86E-22 hsa04722 Neurotrophin signaling pathway 7.78 1.68E-19 hsa04012 ErbB signaling pathway 6.69 2.67E-19 hsa04917 Prolactin signaling pathway 5.79 3.57E-17 hsa04914 Progesterone-mediated oocyte maturation 6.33 3.70E-17 hsa04014 Ras signaling pathway 9.76 3.87E-16 hsa04550 Signaling pathways regulating pluripotency of
stem cells 7.41 7.26E-15 hsa04919 Thyroid hormone signaling pathway 6.69 9.79E-15 hsa04350 TGF-beta signaling pathway 5.79 1.28E-14
REACTOME database
R-HSA-69231 Cyclin D associated events in G1 4.7 5.00E-21 R-HSA-1538133 G0 and Early G1 3.44 1.13E-15 R-HSA-69656 Cyclin A:Cdk2-associated events at S phase entry 2.35 1.10E-10 R-HSA-69273 Cyclin A/B1 associated events during G2/M
transition 2.71 1.42E-10 R-HSA-2173796 SMAD2/SMAD3:SMAD4 heterotrimer regulates
transcription 3.07 4.22E-10 R-HSA-1257604 PIP3 activates AKT signaling 4.34 5.16E-09 R-HSA-5674400 Constitutive Signaling by AKT1 E17K in cancer 2.53 4.01E-08 R-HSA-2219530 Constitutive Signaling by Aberrant PI3K in
cancer 3.62 6.77E-08 R-HSA-69202 Cyclin E associated events during G1/S transition 1.99 9.93E-08 R-HSA-1912408 Pre-NOTCH Transcription and Translation 2.53 4.36E-07
The enriched biological processes of the 553 genes describe terms associated with positive DNA replication, cellular proliferation and apoptotic events, in which TP53 is one of the most relevant signal transducers. In addition, more specific sarcoma–related terms are listed, such as smooth muscle cell and fibroblast proliferation, osteoblast differentiation and development, and positive regulation of mesenchymal cell proliferation.
top positions, for instance FOXO, PI3K/AKT, TP53, MAPK, Neurotrophin and cell cycle. Moreover, the REACTOME database lists events mainly related to cell cycle regulation such as Cyclin D-associated events in G1, G0 and Early G1, Cyclin A: Cdk2-D-associated events at S phase entry and Cyclin A/B1 associated events during G2/M transition.
2.3. Protein-protein interaction analysis
We evaluated the physical interactions of the members of the consensus list by including the protein interactions described for Homo sapiens from the STRING database [20]. The protein-protein interaction (PPI) generated an osteosarcoma-PPI network (OS-PPI) of 505 nodes from the 553 consensus genes (91.3 %). The node degrees of the 58 pathogenic genes (named as G1 and G2) detected in this network were higher than the non-pathogenic ones (39.05 and 19.25 respectively), showing statistical differences when applying the non-parametric Mann-Whitney U Test (p < 0.001). Therefore, a higher node degree given by this interaction signifies a greater probability of association to pathogenesis within the prioritized genes.
2.4. Communality analysis and pathway enrichment
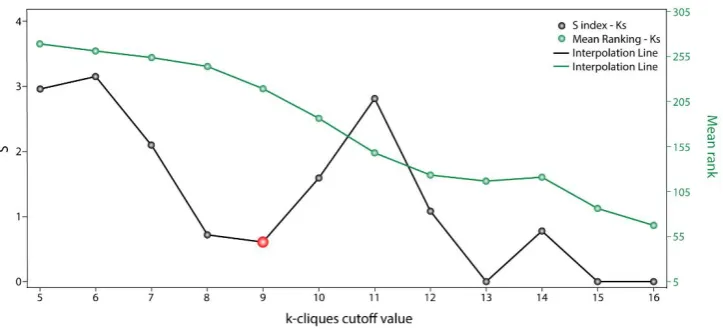
The communality analysis was carried out using the clique percolation method. The clustering data through communality analysis was obtained with Cfinder [21], which defined “k-cliques” based on the interaction degree of each node from the OS-PPI network and the extent to which different communities overlapped in said network. The clique percolation method allowed us to detect 14 k-cliques and 86 possible communities with a composition of between 17 and 465 genes. The early minimum in Sk variation with respect to k-parameters (Figure 1) revealed that k=8 and k=9 have similar gene distributions within communities (Sk index 0.719 and 0.609, respectively). Both k-cliques are suitable for further analysis, however we chose k=9 because it had a better Mean_rank (218.89) than k=8 (243.95). Moreover, k=9 is composed of 13 communities and 245 genes (44.3% of the 553 OS genes).
Figure 1. Sk scoring with respect to each k-clique cutoff value. Communality analysis by clique percolation method. Values of Sk (black points) and Mean Rankings (green points) with respect to each k-clique cutoff value.
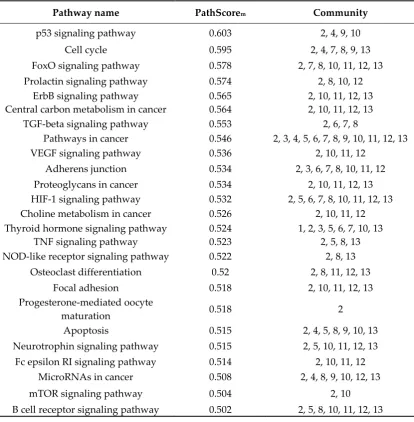
Table 5. Pathways enrichment analysis of k=9 communities and their associated weights.
Pathway name PathScorem Community
p53 signaling pathway 0.603 2, 4, 9, 10 Cell cycle 0.595 2, 4, 7, 8, 9, 13 FoxO signaling pathway 0.578 2, 7, 8, 10, 11, 12, 13 Prolactin signaling pathway 0.574 2, 8, 10, 12
ErbB signaling pathway 0.565 2, 10, 11, 12, 13 Central carbon metabolism in cancer 0.564 2, 10, 11, 12, 13
TGF-beta signaling pathway 0.553 2, 6, 7, 8
Pathways in cancer 0.546 2, 3, 4, 5, 6, 7, 8, 9, 10, 11, 12, 13 VEGF signaling pathway 0.536 2, 10, 11, 12
Adherens junction 0.534 2, 3, 6, 7, 8, 10, 11, 12 Proteoglycans in cancer 0.534 2, 10, 11, 12, 13 HIF-1 signaling pathway 0.532 2, 5, 6, 7, 8, 10, 11, 12, 13 Choline metabolism in cancer 0.526 2, 10, 11, 12 Thyroid hormone signaling pathway 0.524 1, 2, 3, 5, 6, 7, 10, 13
TNF signaling pathway 0.523 2, 5, 8, 13 NOD-like receptor signaling pathway 0.522 2, 8, 13
Osteoclast differentiation 0.52 2, 8, 11, 12, 13 Focal adhesion 0.518 2, 10, 11, 12, 13 Progesterone-mediated oocyte
maturation 0.518 2
Apoptosis 0.515 2, 4, 5, 8, 9, 10, 13 Neurotrophin signaling pathway 0.515 2, 5, 10, 11, 12, 13
Fc epsilon RI signaling pathway 0.514 2, 10, 11, 12 MicroRNAs in cancer 0.508 2, 4, 8, 9, 10, 12, 13 mTOR signaling pathway 0.504 2, 10 B cell receptor signaling pathway 0.502 2, 5, 8, 10, 11, 12, 13
Figure 2. Clustering analysis for the k=9 communities. Blue circles represent cluster 1, purple circles cluster 2, yellow circles cluster 3 and purple circles represent cluster 3
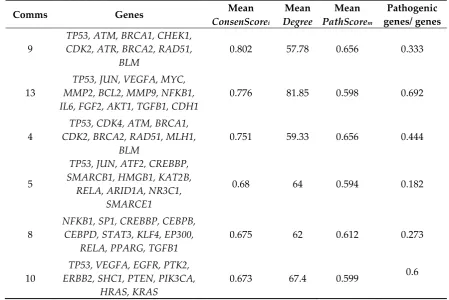
Communities 4, 5, 8, 9, 10 and 13 have groups from 9 to 13 genes and in total contain 47 prioritized genes. The genetic distribution among the communities is almost specific and only communities 4 and 9 present a high similarity (77%) regarding gene composition (Table 6). Only TP53 is shared in 5 of the 6 communities, which denotes its centrality in this prioritization.
Table 6. Gene distribution in the most relevant communities in k=9-clique
Comms Genes Mean
ConsenScorei
Mean
Degree
Mean
PathScorem
Pathogenic genes/ genes
9
TP53, ATM, BRCA1, CHEK1, CDK2, ATR, BRCA2, RAD51,
BLM
0.802 57.78 0.656 0.333
13
TP53, JUN, VEGFA, MYC, MMP2, BCL2, MMP9, NFKB1, IL6, FGF2, AKT1, TGFB1, CDH1
0.776 81.85 0.598 0.692
4
TP53, CDK4, ATM, BRCA1, CDK2, BRCA2, RAD51, MLH1,
BLM
0.751 59.33 0.656 0.444
5
TP53, JUN, ATF2, CREBBP, SMARCB1, HMGB1, KAT2B,
RELA, ARID1A, NR3C1, SMARCE1
0.68 64 0.594 0.182
8
NFKB1, SP1, CREBBP, CEBPB, CEBPD, STAT3, KLF4, EP300,
RELA, PPARG, TGFB1
0.675 62 0.612 0.273
10
TP53, VEGFA, EGFR, PTK2, ERBB2, SHC1, PTEN, PIK3CA,
HRAS, KRAS
0.673 67.4 0.599 0.6
effectors are described in communities 5 and 8. The genes ARID1A, SMARCE1 and SMARCB1, specific to community 5, are mainly associated with chromatin remodeling.
Given the close metabolic relationship between communities 5, 8, 10 and 13, it is not surprising that JUN, NFKB1, VEGFA, TGFB1, CREBBP and RELA are shared among them. However, communities 4 and 9 are isolated from the rest of clusters and only have TP53 in common. The genetic composition of both communities is specific with one biological process: DNA repair. ATM, CHEK1,
ATR, BRCA1, BRCA2, RAD51, BLM and MLH1 belong to DNA repair complexes associated with
cellular response to DNA damage stimuli, DNA repair and double-strand break repair via homologous recombination. Altogether, the genetic distribution of these communities is in accordance with the GO analysis obtained from our consensus list (Table 3).
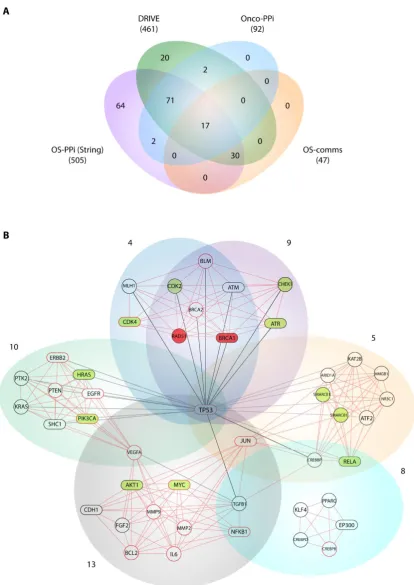
The 47 genes grouped into the 6 communities defined above represent the most important prioritized members within this study, so we developed a sub-network based on these results (OS-comms network). The centrality index calculated in this sub-network was significantly correlated with the node degree (Degreei) of the same genes in the original OS-PPI network (r = 0.317, p = 0.03).
2.5. Gene validation
As a validation strategy, we compare our consensus list with the DRIVE project (deep RNAi interrogation of visibility effects in cancer) [22] and with cancer-focused protein-protein interaction network (OncoPPI) [23] data. The data generated by the DRIVE project described 83.5% of our 553 consensus genes (Supplementary Table S8). Of these 461 genes, 20 were determined as essential, 70 as active and 371 as inert. On the other hand, the OncoPPI network recognized 92 of our prioritized genes (16.6%) and its centrality index showed a significant correlation with the same gene in our OS-PPI network (r = 0.445, p < 0.001) (Supplementary Table S9).
3. Discussion
As shown in Table 1, the detection rate of our consensus prioritization strategy was higher than all the bioinformatics tools employed in this analysis. Moreover, the mean rank of the pathogenic genes detected in the top 1% of the list was 49.3. Table 2 indicates that, in average, the 45 G1-G2 genes were located in the top 50 positions. These results confirm that this methodology does indeed improve the detection and prioritization of pathogenic genes as had been previously described in other pathologies [24, 25].
As a first approach, the prioritization strategy resulted in a consensus list of 553 genes and the 10 top ranked genes were TP53, RB1, CHEK2, RUNX2, E2F1, MDM2, CDKN1A, JUN, CCNA2 and
CDKN2A. TP53, RB1, CHEK2 and MDM2 were ranked in 1st, 2nd, 3rd and 6th positions, respectively
and also the arrangement of the pathogenic genes in this list show a distribution in the top positions. So far, the gene ranking along this prioritization reflects a proper gene weighting based mainly on this consensus strategy. These genes had been previously described in OS pathogenesis. Early studies focused on the molecular biology of OS were carried out in individuals with familial syndromes, which predisposed them to this tumor. Germline inactivation of RB1 and TP53 were initially described in patients with hereditary retinoblastoma and Li-Fraumeni syndrome, respectively [26,
27], and subsequently in sporadic sarcomas [28, 29]. Given that these two suppressors are central proteins in controlling the cell cycle, later studies briefly described many others that interacted with them. Mouse double minute 2 (MDM2), for example, is a protein that binds to RB1 and inactivates TP53 [30]. Its amplification is an event that occurs in primary OS (3-25%) and it is overexpressed in metastases and recurrences [31, 32]. CHEK2 is another protein that is part of a DNA damage check-point, works as a stabilizer of TP53 and shows a 7% frequency of mutations in OS patients [33, 34]. The biological processes derived from the GO analysis of the 553 genes described TP53 as a principal signal transducer that mediates processes associated with cell cycle, DNA damage response, DNA replication and intrinsic/extrinsic apoptotic signaling regulation. Additionally, more specific biological processes were described, for instance fibroblast proliferation, osteoblast differentiation and development, and mesenchymal cell proliferation and transition. In accordance with our results, previous studies have identified similar biological processes related to OS, where the following are considered OS-associated terms: cell cycle regulation (mainly mediated by RB1 and TP53), osteoblast differentiation (mediated by RUNX2), DNA damage, stress response, epigenetic processes, mitosis, cell motility functions and members involved in OS cell proliferation (weighting NFKB signaling, NFKBIE and RELA members) [3, 35-37]. Taken together, these processes suggest that the consensus list evidences genes associated with osteogenesis, cell differentiation and transition to bone cell types. In addition, the terms derived from the pathway enrichment analysis (Table 4) are in accordance with these biological processes.
The information used by STRING allowed us to define the degree of physical interaction of the consensus list members and calculate their centrality index. This centrality index was used as a variable to evidence the contribution rate of the pathogenic genes to a common biological purpose. Thus, the greater the centrality for a node within the OS-PPI network, the greater the probability of its contributing to pathogenesis. This association was validated by analyzing the genes defined as pathogenic (G1-G2), in which significant differences were observed in comparison with the rest of the consensus genes (p <0.0001). The centrality index calculated from the 503 nodes included in the protein-protein interaction network determined TP53 as the most central node, followed by AKT1,
MYC, JUN, EP300, CREBBP, CCND1, CDKN1A, STAT3 and RB1. Furthermore, this degree allowed
for the defining of more specific clusters and prioritizing gene communities associated with OS pathogenesis. Thus, k-9 was determined as the clique with the best gene distribution among all the resulting communities (𝑆𝑘 index 0.719) and communities 4, 5, 8, 9, 10 and 13 as the most important
groups of genes within our study.
The pathway enrichment analysis for the k=9-clique results, almost in its entirety, in the same terms obtained from the initial consensus list. This confirms that the gene filtered through communality analysis comprised almost the same biological processes. Considering the PathScorem
significance in this enrichment analysis. In different cancer types, PI3K/AKT, Ras-MEK-ERK, IKK and AMPK are the most important signaling pathways interacting with FOXO [38]. Gain of function of P13K and RAS, or PTEN disruption, are oncogenic events which promote a loss of function in the Forkhead Box transcription factors (FOXO) [39]. Interestingly, loss of its expression promotes impaired osteogenic differentiation, suggesting that FOXO1 is involved in osteoblastogenesis and osteoclastogenesis [40-42]. Moreover, FOXO members have an important role in cell fate decision, via triggering the expression of death receptor ligands like FASLG, TNF apoptosis ligand and some BCL-2 family members (BCLBCL-2L1, BNIP3, BCLBCL-2L11) [43-46]. FOXO expression in OS tumors is low or even lacking altogether, leading to tumor progression and cell cycle arrest [47]. The fact that FOXO enhances its weight within our enrichment analysis demonstrates its importance as a signaling pathway in the pathogenesis of OS. Furthermore, the close relationship between the FOXO signaling pathway and cell cycle, events of osteoclast differentiation and apoptosis via TNF signaling pathway is evidenced in the pathway enrichment analysis applied to the consensus list and to the k=9 clique.
Our consensus strategy seeks to specify a group of genes that describe the molecular etiology of OS. In this sense, the use of all the strategies previously described prioritizes to a great extent the 47 genes arranged in the communities 4, 5, 8, 9, 10 and 13. From these six communities, BRCA1, AKT1,
ATR, CDK4, HRAS, MYC, PIK3CA, RELA, STAT3 are genes validated by DRIVE and Onco-PPI
(19.1%), RAD51, CDK2, CHEK1, SMARCB1, SMARCE1 are validated only by DRIVE (10.6 %), and
ATM, CDH1, EGFR, EP300, ERBB2, JUN, NFKB1, SHC1, TP53, SP1 by Onco-PPI (21.3%). The
sub-network generated from these communities (OS-comms sub-network) reflects closely interrelated genes at cellular interaction level (Figure 3b) and also groups of genes immersed in important oncological processes. Tamborero et al. [48] from exome sequencing data of 3,205 tumors in the Cancer Genome Atlas (TCGA) research network proposed 291 high-confidence cancer driver genes acting on 12 different cancer types. Although in this study, data from samples of bone tumors were not taken into account, their results show members of the PI3K signaling pathway as central onco-drivers, ATR-BRCA1 as regulatory nodes of repair processes associated with TP53, CHEK1 and AKT as the main regulators of cell cycle in function of CDK1A, CDK1B and activators for downstream pathways such as FOXO. This experimental data supports our findings, where PIK3CA, AKT1, PTEN, HRAS and
SHC1 were nodes highly connected within our OS-comms network. Nodes that connect to
communities 10 and 13 describe genes representative of our weighted tumorigenic pathways PI3K/AKT and MAPK/ERK.
The findings reported here suggest that PI3K/AKT and MAPK/ERK are the main signaling pathways deregulated for OS. Several reports have shown that these pathways are responsible for controlling cellular processes related to proliferation, growth, differentiation and apoptosis [49, 50]. In fact, the Ras/Raf/MEK/ERK pathway is hyperactivated in 30% of human cancers [51] and nearly 67% of OS shows aberrant ERK activation [52]. The extra cellular-signal-regulated kinases (ERK) promote cell proliferation, cell survival and metastasis particularly by its upstream activation from EGFR and the G protein-coupled receptor Ras [53]. The presence of SHC1, EGFR, HRAS, PIK3CA,
ERBB2 within community 10 support this scenario for OS. In addition, the high connectivity of the
matrix metalloproteases MMP2 and MMP9 in community 13 suggest a metastasis event in function of these signaling pathways.
IL6, FGF2, VEGFA, EGFR and ERBB2, are pathogenic nodes dependent on the centrality of PI3K/AKT
and MAPK/ERK. This finding could be related to aspects of invasiveness and prognosis, mainly in tumors that present deregulation in these two signaling pathways.
In addition to evidencing the previous findings, communities 4, 5 and 9 include genes widely described in processes of homologous recombination (HR), base excision repair and chromatin modification. Cells’ DNA damage response principally involves maintaining chromosome integrity and genome stability, and implies recognition of DNA lesions, followed by an activation of checkpoints in the cell cycle that promotes cellular signaling cascades related to DNA repair. While the ATM-CHEK2 pathway is responsible for the initiation of cellular responses to double-strand breaks [65, 66], ATR-CHEK1 responds to DNA replication stress by means of the phosphorylation of several substrates in response to agents such as UV and X-ray among others [67]. ATM, ATR and
CHEK1 show a high centrality index in the OS-comms network, interacting in addition with BRCA1
and RAD51, described as essential genes, and with the cyclin dependent kinases CDK2 and CDK4, described as active ones according to the DRIVE validation. Checkpoint activation by ATM mainly controls G1/S, whereas ATM and ATR contribute to establishing and maintaining the S and G2/M checkpoints [68]. Either by activation of ATR-CHEK1 or ATM-CHEK2, DNA damage signaling promotes inhibition of CDK activity and therefore activation of G1/S, intra-S, and G2/M checkpoints [69]. Consequently, it is likely that such nodes associated with DNA repair, such as ATM, ATR,
CHEK1, BLM, RAD51 and MLH1 (as shown in our pathway enrichment analysis), together with those
previously described (BRCA1 and BRCA2) from exome sequencing [70] have important implications regarding the deregulation of the cell cycle evidenced in OS.
While it is true that the nodes described for communities 4 and 9 are mainly related to repair and cell cycle control events, the HR repair complex is involved in a hallmark event for sarcomas such as alternative telomere maintenance (ALT). Several molecular details of this mechanism still remain unknown; however, two distinctive telomere phenotypes are described for ALT in human telomerase-negative cells (ALT cells) such as long and heterogeneous telomere DNA and the promyelocytic leukemia (PML) body [71], together forming the ALT-associated promyelocytic leukemia body (APB). The PML body is a nuclear made up of proteins which form amongst the chromatin and is related to a wide range of cellular processes including tumors formation, cellular senescence, and DNA repair [72, 73]. Numerous lines of evidence strongly suggest that the ALT pathway is dependent on HR since several proteins involved in DNA double-strand break (DSB) are localized at APBs [74-77]. It is significant that proteins localized at APBs like PML, DNA helicases of the RecQ family (BLM, WRN and RECQL4), RAD51 and RAD52 (member of the MNR complex) rank highly in our prioritization. In this sense, the members belonging to HR complexes are described as repair complexes in response to DNA damage. They are relevant to the pathogenesis of the OS, not only as factors immersed in cell cycle control as previously discussed, but also because they are involved in processes of chromosome stability given by telomere maintenance [78-81]. Consistent with the literature, where bone tumors are termed as highly heterogeneous, highly mutable and genetically unstable, members described in communities 4 and 9 (TP53, ATM, ATR, CHEK1, BLM,
BRCA1, BRCA2, RAD51, MLH1, CDK2, CDK4) explain many of these key features within OS, and can
also be associated with important clinical characteristics such as tumor aggressiveness, metastasis and poor survival.
What is more, the gene composition of communities 4 and 9, and more specifically to their ATM,
ATR, CHEK1 and RAD51 genes, suggest that the HR repair complex is an important group of genes
within the pathogenesis of the OS. Its deregulation can influence tumorigenic events characteristic of this sarcoma as generalized disruption in the cell cycle and ALT mechanisms. Hence, it is necessary to experimentally validate these results, taking into account not only the patient’s age group, but also genetic factors that can influence the molecular behavior of these bone tumors, such as racial and ethnic factors.
4. Materials and Methods
4.1. Prioritization methods and consensus strategy
The bioinformatics methods used in this study were Biograph [82], Cipher [83], DisGeNET [84], Génie [85], GLAD4U [86], Guildify [87], Phenolizer [88], PolySearch [89] and SNPs3D [90].
The strategy applied to integrate the gene scores obtained in each independent method is similar to that previously described [24, 25]. Thus, we normalized each gene (denoted as i) from the ranked list obtained from each method (denoted as j) (GeneNi,j which means, the normalized score of the gene “i” in the method “j”). The final score by gene (ConsenScorei) was considered as the average normalized score and the number of methods which predict the gene (denoted as ni):
ConsenScorei=√( (ni-1)
9-1 ) ( 1
j∑jGeneNi,j )
This equation refers to the geometric mean between the average score of each gene derived from each method, and the normalized score according to the number of methods that predict the association of the gene and the disease.
The pathogenic OS genes were used to calculate Ii=FPTPi
i+1ConsenScorei, where TP and FP are the
true and false positive values (up to the ranking value of the gene i), respectively. According to that which has been previously described [24, 25], the maximum value of Ii can be taken as the maximum
compromise between the TP and FP rates compensated with the ranking index of each gene.
4.2. Protein-protein interaction network analysis
The physical interactions of the members of the consensus list were revised from the STRING database, only taking into consideration interactions with a confidence cut-off of 0.9. With this information, we generated a OS-PPI network with zero node addition. Network visualization and analysis was carried out through the Cytoscape software [91].
4.3. Communality and pathway enrichment analysis
In order to determine the best k-clique in the communality analysis, we used the index “S” [24,
25]: Sk=|mean(Ng
k)-median(N g k)|
Nck , where Ng
k and N c
k are the number of genes in each community and the
number of communities for a defined k-clique cut-off value.
Additionally, we applied the partitional algorithm K-means in order to define our best communities within a k-clique. The variables used for the clustering were the means of ConsenScorei,
Degreei and PathScorem for each community within the k-clique. The Degreei variable refers to the
node’s degree centrality index calculated for each gene from the OS-PPI network and the PathScorem
is outlined below. From this clustering, we created a sub-network to visualize the interactions of all the members of the chosen communities.
For the pathway enrichment analysis we used a PathRankScorem, PathGeneScorem and PathScorem
as described previously [24]: 1) Each community “k” was weighted as: Wk=∑ConsenScoreik/Nk, where ConsenScoreik is the ConsenScorei of the gene “i” in the community “k” and Nk is the number of communities; 2) Each pathway “m” was weighted as: PathRankScorem=∑Wkm/Nkm, where Wkm is the
communities connected with the pathway “m”; and 3) A second weight to the pathway “m”,
PathGeneScorem , considered all the genes included in each pathway: PathGeneScorem=√〈ConsenScoreim〉
nm
Nm, where N
m is the total number of genes in the pathway “m”, while
nm is the number of those genes that are also found in the protein-protein interaction network. The
average of the ConsenScorei of all genes presents in the pathway “m” is 〈ConsenScoreim〉. The
geometrical mean between PathGeneScorem and the normalized PathRankScorem refers to the final score associated with the pathway “m” (PathScorem).
4.4. Gene validation with the OncoPPi OS network and the DRIVE project
The DRIVE project describes a comprehensive mapping of cancer genes obtained from a larger-scale gene knockdown experiment in 398 cancer cell lines. We filtrated the results of eight cell lines, all of which had pathological annotations related to bone cancer (A673, SAOS2, SJSA1, SKES1, SKNMC, SW1353, TC71, and U2OS). Subsequently, all essential genes that showed a Sensitivity Value of ≤ -3 in > 50% of the chosen cell lines, active genes that showed values of ≤ -3 in 1-49%, and inert ones showed values of ≤ -3 for 0% of cancer cells [22], were compared with our results.
Additionally, from Onco-PPI Portal (http://oncoppi.emory.edu/) [23] a cancer-focused protein-protein interaction network was generated by only considering the interactions described for bone tumor types (BT-OncoPPI). This network was comprised of 171 genes and 442 interactions. The Spearman correlation of Degreei between the BT-OncoPPI, OS-PPI and Cfinder networks were calculated.
Supplementary Materials: Supplementary materials can be found at www.mdpi.com/xxx/s1.
Author Contributions: E.T. and A.C.-A. conceived the project and wrote the manuscript. E.T. designed the algorithm. A.C.-A. and A.L.-C. implemented the algorithm and performed the data analysis. G.J.-K. and (C.P-y-M.) made substantial contributions in the discussion of the article. C.R.M., H.G.-D. and A.P. helped with study design and edited the manuscript. All authors read and approved the final manuscript.
Acknowledgments: This work was supported by Universidad de Las Américas (Quito, Ecuador), Hospital de Especialidades Eugenio Espejo, University of Coruna (Coruña, Spain) and University of the Basque Country (Bilbao, Spain). Moreover, by “Collaborative Project in Genomic Data Integration (CICLOGEN)” PI17/01826 funded by the Carlos III Health Institute from the Spanish National plan for Scientific and Technical Research and Innovation 2013–2016 and the European Regional Development Funds (FEDER).
Conflicts of Interest: The authors declare no conflict of interest.
Abbreviations
OS Osteosarcoma
GO Gene ontology
PPI Protein-protein interaction
OS-PPI Osteosarcoma protein-protein interaction network OS-comms network Sub-network based on the communality analysis
OncoPPI Protein-protein interaction network obtained from the DRIVE project
List of supplemetary tables
Table S1. Description of pathogenic OS genes Table S2. Consensus OS gene list
Table S3. Biological processes by enrichment analysis in OS consensus gene list Table S4. Biological processes of the consensus gene list using Revigo
References
1. Man, T. K.; Lu, X. Y.; Jaeweon, K.; Perlaky, L.; Harris, C. P.; Shah, S.; Ladanyi, M.; Gorlick, R.; Lau, C. C.; Rao, P. H. Genome-wide array comparative genomic hybridization analysis reveals distinct amplifications in osteosarcoma. BMC Cancer 2004, 4, 45. [doi:10.1186/1471-2407-4-45]
2. Savage, S. A.; Mirabello, L.; Wang, Z.; Gastier-Foster, J. M.; Gorlick, R.; Khanna, C.; Flanagan, A. M.; Tirabosco, R.; Andrulis, I. L.; Wunder, J. S.; et al. Genome-wide association study identifies two susceptibility loci for osteosarcoma. Nat Genet 2013, 45, 799-803. [doi:10.1038/ng.2645]
3. Kuijjer, M. L.; Hogendoorn, P. C.; Cleton-Jansen, A. M. Genome-wide analyses on high-grade osteosarcoma: making sense of a genomically most unstable tumor. Int J Cancer 2013, 133, 2512-2521. [doi:10.1002/ijc.28124]
4. Groisberg, R.; Roszik, J.; Conley, A.; Patel, S. R.; Subbiah, V. The Role of Next-Generation Sequencing in Sarcomas: Evolution From Light Microscope to Molecular Microscope. Curr Oncol Rep 2017, 19, 78. [doi:10.1007/s11912-017-0641-2]
5. Cote, G. M.; He, J.; Choy, E. Next-Generation Sequencing for Patients with Sarcoma: A Single Center Experience. Oncologist 2018, 23, 234-242. [doi:10.1634/theoncologist.2017-0290]
6. Joseph, C. G.; Hwang, H.; Jiao, Y.; Wood, L. D.; Kinde, I.; Wu, J.; Mandahl, N.; Luo, J.; Hruban, R. H.; Diaz, L. A., Jr.; et al. Exomic analysis of myxoid liposarcomas, synovial sarcomas, and osteosarcomas. Genes
Chromosomes Cancer 2014, 53, 15-24. [doi:10.1002/gcc.22114]
7. Bousquet, M.; Noirot, C.; Accadbled, F.; Sales de Gauzy, J.; Castex, M. P.; Brousset, P.; Gomez-Brouchet, A. Whole-exome sequencing in osteosarcoma reveals important heterogeneity of genetic alterations. Ann
Oncol 2016, 27, 738-744. [doi:10.1093/annonc/mdw009]
8. Vogelstein, B.; Papadopoulos, N.; Velculescu, V. E.; Zhou, S.; Diaz, L. A., Jr.; Kinzler, K. W. Cancer genome landscapes. Science 2013, 339, 1546-1558. [doi:10.1126/science.1235122]
9. Lawrence, M. S.; Stojanov, P.; Mermel, C. H.; Robinson, J. T.; Garraway, L. A.; Golub, T. R.; Meyerson, M.; Gabriel, S. B.; Lander, E. S.; Getz, G. Discovery and saturation analysis of cancer genes across 21 tumour types. Nature 2014, 505, 495-501. [doi:10.1038/nature12912]
10. Chen, X.; Bahrami, A.; Pappo, A.; Easton, J.; Dalton, J.; Hedlund, E.; Ellison, D.; Shurtleff, S.; Wu, G.; Wei, L.; et al. Recurrent somatic structural variations contribute to tumorigenesis in pediatric osteosarcoma. Cell
Rep 2014, 7, 104-112. [doi:10.1016/j.celrep.2014.03.003]
11. Gianferante, D. M.; Mirabello, L.; Savage, S. A. Germline and somatic genetics of osteosarcoma - connecting aetiology, biology and therapy. Nat Rev Endocrinol 2017, 13, 480-491. [doi:10.1038/nrendo.2017.16]
12. Rickel, K.; Fang, F.; Tao, J., Molecular genetics of osteosarcoma. Bone 2017, 102, 69-79. [doi:10.1016/j.bone.2016.10.017]
13. Tranchevent, L. C.; Capdevila, F. B.; Nitsch, D.; De Moor, B.; De Causmaecker, P.; Moreau, Y. A guide to web tools to prioritize candidate genes. Brief Bioinform 2011, 12, 22-32. [doi:10.1093/bib/bbq007]
14. Bornigen, D.; Tranchevent, L. C.; Bonachela-Capdevila, F.; Devriendt, K.; De Moor, B.; De Causmaecker, P.; Moreau, Y. An unbiased evaluation of gene prioritization tools. Bioinformatics 2012, 28, 3081-3088. [doi:10.1093/bioinformatics/bts581]
15. Moreau, Y.; Tranchevent, L. C. Computational tools for prioritizing candidate genes: boosting disease gene discovery. Nat Rev Genet 2012, 13, 523-536. [doi:10.1038/nrg3253]
16. Chen, J.; Aronow, B. J.; Jegga, A. G. Disease candidate gene identification and prioritization using protein interaction networks. BMC Bioinformatics 2009, 10, 73. [doi:10.1186/1471-2105-10-73]
17. Huang da, W.; Sherman, B. T.; Lempicki, R. A. Systematic and integrative analysis of large gene lists using DAVID bioinformatics resources. Nat Protoc 2009, 4, 44-57. [doi:10.1038/nprot.2008.211]
18. Huang da, W.; Sherman, B. T.; Lempicki, R. A. Bioinformatics enrichment tools: paths toward the comprehensive functional analysis of large gene lists. Nucleic Acids Res 2009, 37, 1-13. [doi:10.1093/nar/gkn923]
19. Supek, F.; Bosnjak, M.; Skunca, N.; Smuc, T. REVIGO summarizes and visualizes long lists of gene ontology terms. PLoS One 2011, 6, e21800. [doi:10.1371/journal.pone.0021800]
20. Szklarczyk, D.; Franceschini, A.; Wyder, S.; Forslund, K.; Heller, D.; Huerta-Cepas, J.; Simonovic, M.; Roth, A.; Santos, A.; Tsafou, K. P.; et al. STRING v10: protein-protein interaction networks, integrated over the tree of life. Nucleic Acids Res 2015, 43, (Database issue), D447-452. [doi:10.1093/nar/gku1003]
22. McDonald, E. R., 3rd; de Weck, A.; Schlabach, M. R.; Billy, E.; Mavrakis, K. J.; Hoffman, G. R.; Belur, D.; Castelletti, D.; Frias, E.; Gampa, K.; et al. Project DRIVE: A Compendium of Cancer Dependencies and Synthetic Lethal Relationships Uncovered by Large-Scale, Deep RNAi Screening. Cell 2017, 170, 577-592 e10. [doi:10.1016/j.cell.2017.07.005]
23. Li, Z.; Ivanov, A. A.; Su, R.; Gonzalez-Pecchi, V.; Qi, Q.; Liu, S.; Webber, P.; McMillan, E.; Rusnak, L.; Pham, C.; et al. The OncoPPi network of cancer-focused protein-protein interactions to inform biological insights and therapeutic strategies. Nat Commun 2017, 8, 14356. [doi:10.1038/ncomms14356]
24. Tejera, E.; Cruz-Monteagudo, M.; Burgos, G.; Sanchez, M. E.; Sanchez-Rodriguez, A.; Perez-Castillo, Y.; Borges, F.; Cordeiro, M.; Paz, Y. M. C.; Rebelo, I. Consensus strategy in genes prioritization and combined bioinformatics analysis for preeclampsia pathogenesis. BMC Med Genomics 2017, 10, 50. [doi:10.1186/s12920-017-0286-x]
25. Lopez-Cortes, A.; Paz, Y. M. C.; Cabrera-Andrade, A.; Barigye, S. J.; Munteanu, C. R.; Gonzalez-Diaz, H.; Pazos, A.; Perez-Castillo, Y.; Tejera, E. Gene prioritization, communality analysis, networking and metabolic integrated pathway to better understand breast cancer pathogenesis. Sci Rep 2018, 8, 16679. [doi:10.1038/s41598-018-35149-1]
26. Srivastava, S.; Wang, S.; Tong, Y. A.; Hao, Z. M.; Chang, E. H. Dominant negative effect of a germ-line mutant p53: a step fostering tumorigenesis. Cancer Res 1993, 53, 4452-4455.
27. Friend, S. H.; Bernards, R.; Rogelj, S.; Weinberg, R. A.; Rapaport, J. M.; Albert, D. M.; Dryja, T. P. A human DNA segment with properties of the gene that predisposes to retinoblastoma and osteosarcoma. Nature 1986, 323, 643-646. [doi:10.1038/323643a0]
28. Tsuchiya, T.; Sekine, K.; Hinohara, S.; Namiki, T.; Nobori, T.; Kaneko, Y. Analysis of the p16INK4, p14ARF, p15, TP53, and MDM2 genes and their prognostic implications in osteosarcoma and Ewing sarcoma. Cancer
Genet Cytogenet 2000, 120, 91-98. [doi:10.1016/s0165-4608(99)00255-1]
29. Gokgoz, N.; Wunder, J. S.; Mousses, S.; Eskandarian, S.; Bell, R. S.; Andrulis, I. L. Comparison of p53 mutations in patients with localized osteosarcoma and metastatic osteosarcoma. Cancer 2001, 92, 2181-2189. [doi:10.1002/1097-0142(20011015)92:8<2181::aid-cncr1561>3.0.co;2-3]
30. Vassilev, L. T.; Vu, B. T.; Graves, B.; Carvajal, D.; Podlaski, F.; Filipovic, Z.; Kong, N.; Kammlott, U.; Lukacs, C.; Klein, C.; et al. In vivo activation of the p53 pathway by small-molecule antagonists of MDM2. Science 2004, 303, 844-848. [doi:10.1126/science.1092472]
31. Stratton, M. R.; Moss, S.; Warren, W.; Patterson, H.; Clark, J.; Fisher, C.; Fletcher, C. D.; Ball, A.; Thomas, M.; Gusterson, B. A.; et al. Mutation of the p53 gene in human soft tissue sarcomas: association with abnormalities of the RB1 gene. Oncogene 1990, 5, 1297-1301.
32. Moll, U. M.; Petrenko, O. The MDM2-p53 interaction. Mol Cancer Res 2003, 1, 1001-1008.
33. Tamura, K.; Utsunomiya, J.; Iwama, T.; Furuyama, J.; Takagawa, T.; Takeda, N.; Fukuda, Y.; Matsumoto, T.; Nishigami, T.; Kusuhara, K.; et al. Mechanism of carcinogenesis in familial tumors. Int J Clin Oncol 2004, 9, 232-245. [doi:10.1007/s10147-004-0430-4]
34. Sandberg, A. A.; Bridge, J. A. Updates on the cytogenetics and molecular genetics of bone and soft tissue tumors: osteosarcoma and related tumors. Cancer Genet Cytogenet 2003, 145, 1-30.
35. Poos, K.; Smida, J.; Maugg, D.; Eckstein, G.; Baumhoer, D.; Nathrath, M.; Korsching, E. Genomic heterogeneity of osteosarcoma - shift from single candidates to functional modules. PLoS One 2015, 10, e0123082. [doi:10.1371/journal.pone.0123082]
36. Sun, L.; Li, J.; Yan, B. Gene expression profiling analysis of osteosarcoma cell lines. Mol Med Rep 2015, 12, 4266-4272. [doi:10.3892/mmr.2015.3958]
37. Shi, Z.; Zhou, H.; Pan, B.; Lu, L.; Wei, Z.; Shi, L.; Yao, X.; Kang, Y.; Feng, S. Exploring the key genes and pathways of osteosarcoma with pulmonary metastasis using a gene expression microarray. Mol Med Rep 2017, 16, 7423-7431. [doi:10.3892/mmr.2017.7577]
38. Farhan, M.; Wang, H.; Gaur, U.; Little, P. J.; Xu, J.; Zheng, W. FOXO Signaling Pathways as Therapeutic Targets in Cancer. Int J Biol Sci 2017, 13, 815-827. [doi:10.7150/ijbs.20052]
39. Shaw, R. J.; Cantley, L. C. Ras, PI(3)K and mTOR signalling controls tumour cell growth. Nature 2006, 441, 424-430. [doi:10.1038/nature04869]
40. Siqueira, M. F.; Flowers, S.; Bhattacharya, R.; Faibish, D.; Behl, Y.; Kotton, D. N.; Gerstenfeld, L.; Moran, E.; Graves, D. T. FOXO1 modulates osteoblast differentiation. Bone 2011, 48, 1043-1051.
41. Kim, H. N.; Iyer, S.; Ring, R.; Almeida, M. The Role of FoxOs in Bone Health and Disease. Curr Top Dev Biol 2018, 127, 149-163. [doi:10.1016/bs.ctdb.2017.10.004]
42. Tan, P.; Guan, H.; Xie, L.; Mi, B.; Fang, Z.; Li, J.; Li, F. FOXO1 inhibits osteoclastogenesis partially by antagnozing MYC. Sci Rep 2015, 5, 16835. [doi:10.1038/srep16835]
43. Coomans de Brachene, A.; Demoulin, J. B. FOXO transcription factors in cancer development and therapy.
Cell Mol Life Sci 2016, 73, 1159-1172. [doi:10.1007/s00018-015-2112-y]
44. Fu, Z.; Tindall, D. J. FOXOs, cancer and regulation of apoptosis. Oncogene 2008, 27, 2312-2319. [doi:10.1038/onc.2008.24]
45. Burgering, B. M.; Medema, R. H. Decisions on life and death: FOXO Forkhead transcription factors are in command when PKB/Akt is off duty. J Leukoc Biol 2003, 73, 689-701. [doi:10.1189/jlb.1202629]
46. Moriishi, T.; Kawai, Y.; Komori, H.; Rokutanda, S.; Eguchi, Y.; Tsujimoto, Y.; Asahina, I.; Komori, T. Bcl2 deficiency activates FoxO through Akt inactivation and accelerates osteoblast differentiation. PLoS One 2014, 9, e86629. [doi:10.1371/journal.pone.0086629]
47. Guan, H.; Tan, P.; Xie, L.; Mi, B.; Fang, Z.; Li, J.; Yue, J.; Liao, H.; Li, F. FOXO1 inhibits osteosarcoma oncogenesis via Wnt/beta-catenin pathway suppression. Oncogenesis 2015, 4, e166. [doi:10.1038/oncsis.2015.25]
48. Tamborero, D.; Gonzalez-Perez, A.; Perez-Llamas, C.; Deu-Pons, J.; Kandoth, C.; Reimand, J.; Lawrence, M. S.; Getz, G.; Bader, G. D.; Ding, L.; et al. Comprehensive identification of mutational cancer driver genes across 12 tumor types. Sci Rep 2013, 3, 2650. [doi:10.1038/srep02650]
49. Mendoza, M. C.; Er, E. E.; Blenis, J. The Ras-ERK and PI3K-mTOR pathways: cross-talk and compensation.
Trends Biochem Sci 2011, 36, 320-328. [doi:10.1016/j.tibs.2011.03.006]
50. Xu, Y.; Li, N.; Xiang, R.; Sun, P. Emerging roles of the p38 MAPK and PI3K/AKT/mTOR pathways in oncogene-induced senescence. Trends Biochem Sci 2014, 39, 268-276. [doi:10.1016/j.tibs.2014.04.004] 51. De Luca, A.; Maiello, M. R.; D'Alessio, A.; Pergameno, M.; Normanno, N. The RAS/RAF/MEK/ERK and the
PI3K/AKT signalling pathways: role in cancer pathogenesis and implications for therapeutic approaches.
Expert Opin Ther Targets 2012, 16 Suppl 2, S17-27. [doi:10.1517/14728222.2011.639361]
52. Han, G.; Wang, Y.; Bi, W. C-Myc overexpression promotes osteosarcoma cell invasion via activation of MEK-ERK pathway. Oncol Res 2012, 20, 149-156. [doi:10.3727/096504012x13522227232237]
53. Samatar, A. A.; Poulikakos, P. I. Targeting RAS-ERK signalling in cancer: promises and challenges. Nat Rev
Drug Discov 2014, 13, 928-942. [doi:10.1038/nrd4281]
54. Daw, N. C.; Chou, A. J.; Jaffe, N.; Rao, B. N.; Billups, C. A.; Rodriguez-Galindo, C.; Meyers, P. A.; Huh, W. W. Recurrent osteosarcoma with a single pulmonary metastasis: a multi-institutional review. Br J Cancer 2015, 112, 278-282. [doi:10.1038/bjc.2014.585]
55. Lamora, A.; Mullard, M.; Amiaud, J.; Brion, R.; Heymann, D.; Redini, F.; Verrecchia, F. Anticancer activity of halofuginone in a preclinical model of osteosarcoma: inhibition of tumor growth and lung metastases.
Oncotarget 2015, 6, 14413-14427. [doi:10.18632/oncotarget.3891]
56. Diepenbruck, M.; Christofori, G. Epithelial-mesenchymal transition (EMT) and metastasis: yes, no, maybe?
Curr Opin Cell Biol 2016, 43, 7-13. [doi:10.1016/j.ceb.2016.06.002]
57. Jiang, W. G.; Sanders, A. J.; Katoh, M.; Ungefroren, H.; Gieseler, F.; Prince, M.; Thompson, S. K.; Zollo, M.; Spano, D.; Dhawan, P.; et al. Tissue invasion and metastasis: Molecular, biological and clinical perspectives.
Semin Cancer Biol 2015, 35 Suppl, S244-S275. [doi:10.1016/j.semcancer.2015.03.008]
58. Gross, A. C.; Cam, H.; Phelps, D. A.; Saraf, A. J.; Bid, H. K.; Cam, M.; London, C. A.; Winget, S. A.; Arnold, M. A.; Brandolini, L.; et al. IL-6 and CXCL8 mediate osteosarcoma-lung interactions critical to metastasis.
JCI Insight 2018, 3. [doi:10.1172/jci.insight.99791]
59. Liang, C.; Li, F.; Wang, L.; Zhang, Z. K.; Wang, C.; He, B.; Li, J.; Chen, Z.; Shaikh, A. B.; Liu, J.; et al. Tumor cell-targeted delivery of CRISPR/Cas9 by aptamer-functionalized lipopolymer for therapeutic genome editing of VEGFA in osteosarcoma. Biomaterials 2017, 147, 68-85. [doi:10.1016/j.biomaterials.2017.09.015] 60. Weekes, D.; Kashima, T. G.; Zandueta, C.; Perurena, N.; Thomas, D. P.; Sunters, A.; Vuillier, C.; Bozec, A.;
El-Emir, E.; Miletich, I.; et al. Regulation of osteosarcoma cell lung metastasis by the c-Fos/AP-1 target FGFR1. Oncogene 2016, 35, 2948. [doi:10.1038/onc.2015.420]
62. Yu, Y.; Luk, F.; Yang, J. L.; Walsh, W. R. Ras/Raf/MEK/ERK pathway is associated with lung metastasis of osteosarcoma in an orthotopic mouse model. Anticancer Res 2011, 31, 1147-1152.
63. Himelstein, B. P.; Asada, N.; Carlton, M. R.; Collins, M. H. Matrix metalloproteinase-9 (MMP-9) expression in childhood osseous osteosarcoma. Med Pediatr Oncol 1998, 31, 471-474. [doi:10.1002/(sici)1096-911x(199812)31:6<471::aid-mpo2>3.0.co;2-m]
64. Liu, Y.; Wang, Y.; Teng, Z.; Chen, J.; Li, Y.; Chen, Z.; Li, Z.; Zhang, Z. Matrix metalloproteinase 9 expression and survival of patients with osteosarcoma: a meta-analysis. Eur J Cancer Care (Engl) 2017, 26. [doi:10.1111/ecc.12364]
65. Guleria, A.; Chandna, S. ATM kinase: Much more than a DNA damage responsive protein. DNA Repair
(Amst) 2016, 39, 1-20. [doi:10.1016/j.dnarep.2015.12.009]
66. Shiloh, Y.; Ziv, Y. The ATM protein kinase: regulating the cellular response to genotoxic stress, and more.
Nat Rev Mol Cell Biol 2013, 14, 197-210.
67. Awasthi, P.; Foiani, M.; Kumar, A. ATM and ATR signaling at a glance. J Cell Sci 2016, 129, 1285. [doi:10.1242/jcs.188631]
68. Ray, A.; Blevins, C.; Wani, G.; Wani, A. A. ATR- and ATM-Mediated DNA Damage Response Is Dependent on Excision Repair Assembly during G1 but Not in S Phase of Cell Cycle. PLoS One 2016, 11, e0159344. [doi:10.1371/journal.pone.0159344]
69. Blackford, A. N.; Jackson, S. P. ATM, ATR, and DNA-PK: The Trinity at the Heart of the DNA Damage Response. Mol Cell 2017, 66, 801-817. [doi:10.1016/j.molcel.2017.05.015]
70. Kovac, M.; Blattmann, C.; Ribi, S.; Smida, J.; Mueller, N. S.; Engert, F.; Castro-Giner, F.; Weischenfeldt, J.; Kovacova, M.; Krieg, A.; et al. Exome sequencing of osteosarcoma reveals mutation signatures reminiscent of BRCA deficiency. Nat Commun 2015, 6, 8940. [doi:10.1038/ncomms9940]
71. Nabetani, A.; Ishikawa, F. Alternative lengthening of telomeres pathway: recombination-mediated telomere maintenance mechanism in human cells. J Biochem 2011, 149, 5-14. [doi:10.1093/jb/mvq119] 72. di Masi, A.; Cilli, D.; Berardinelli, F.; Talarico, A.; Pallavicini, I.; Pennisi, R.; Leone, S.; Antoccia, A.;
Noguera, N. I.; Lo-Coco, F.; et al. PML nuclear body disruption impairs DNA double-strand break sensing and repair in APL. Cell Death Dis 2016, 7, e2308. [doi:10.1038/cddis.2016.115]
73. Lallemand-Breitenbach, V.; de The, H. PML nuclear bodies: from architecture to function. Curr Opin Cell
Biol 2018, 52, 154-161. [doi:10.1016/j.ceb.2018.03.011]
74. Pickett, H. A.; Reddel, R. R. Molecular mechanisms of activity and derepression of alternative lengthening of telomeres. Nat Struct Mol Biol 2015, 22, 875-880. [doi:10.1038/nsmb.3106]
75. Voisset, E.; Moravcsik, E.; Stratford, E. W.; Jaye, A.; Palgrave, C. J.; Hills, R. K.; Salomoni, P.; Kogan, S. C.; Solomon, E.; Grimwade, D. Pml nuclear body disruption cooperates in APL pathogenesis and impairs DNA damage repair pathways in mice. Blood 2018, 131, 636-648. [doi:10.1182/blood-2017-07-794784] 76. Neumann, A. A.; Watson, C. M.; Noble, J. R.; Pickett, H. A.; Tam, P. P.; Reddel, R. R. Alternative lengthening
of telomeres in normal mammalian somatic cells. Genes Dev 2013, 27, 18-23. [doi:10.1101/gad.205062.112] 77. Dilley, R. L.; Verma, P.; Cho, N. W.; Winters, H. D.; Wondisford, A. R.; Greenberg, R. A. Break-induced
telomere synthesis underlies alternative telomere maintenance. Nature 2016, 539, 54-58. [doi:10.1038/nature20099]
78. Kim, J. Y.; Brosnan-Cashman, J. A.; An, S.; Kim, S. J.; Song, K. B.; Kim, M. S.; Kim, M. J.; Hwang, D. W.; Meeker, A. K.; Yu, E.; et al. Alternative Lengthening of Telomeres in Primary Pancreatic Neuroendocrine Tumors Is Associated with Aggressive Clinical Behavior and Poor Survival. Clin Cancer Res 2017, 23, 1598-1606. [doi:10.1158/1078-0432.CCR-16-1147]
79. Singhi, A. D.; Liu, T. C.; Roncaioli, J. L.; Cao, D.; Zeh, H. J.; Zureikat, A. H.; Tsung, A.; Marsh, J. W.; Lee, K. K.; Hogg, M. E.; et al. Alternative Lengthening of Telomeres and Loss of DAXX/ATRX Expression Predicts Metastatic Disease and Poor Survival in Patients with Pancreatic Neuroendocrine Tumors. Clin Cancer Res 2017, 23, 600-609. [doi:10.1158/1078-0432.CCR-16-1113]
80. Liau, J. Y.; Tsai, J. H.; Jeng, Y. M.; Lee, J. C.; Hsu, H. H.; Yang, C. Y. Leiomyosarcoma with alternative lengthening of telomeres is associated with aggressive histologic features, loss of ATRX expression, and poor clinical outcome. Am J Surg Pathol 2015, 39, 236-244. [doi:10.1097/PAS.0000000000000324]
82. Liekens, A. M.; De Knijf, J.; Daelemans, W.; Goethals, B.; De Rijk, P.; Del-Favero, J. BioGraph: unsupervised biomedical knowledge discovery via automated hypothesis generation. Genome Biol 2011, 12, R57. [doi:10.1186/gb-2011-12-6-r57]
83. Wu, X.; Jiang, R.; Zhang, M. Q.; Li, S. Network-based global inference of human disease genes. Mol Syst
Biol 2008, 4, 189. [doi:10.1038/msb.2008.27]
84. Pinero, J.; Queralt-Rosinach, N.; Bravo, A.; Deu-Pons, J.; Bauer-Mehren, A.; Baron, M.; Sanz, F.; Furlong, L. I. DisGeNET: a discovery platform for the dynamical exploration of human diseases and their genes.
Database (Oxford) 2015, 2015, bav028. [doi:10.1093/database/bav028]
85. Fontaine, J. F.; Priller, F.; Barbosa-Silva, A.; Andrade-Navarro, M. A. Genie: literature-based gene prioritization at multi genomic scale. Nucleic Acids Res 2011, 39, (Web Server issue), W455-461. [doi:10.1093/nar/gkr246]
86. Jourquin, J.; Duncan, D.; Shi, Z.; Zhang, B. GLAD4U: deriving and prioritizing gene lists from PubMed literature. BMC Genomics 2012, 13 Suppl 8, S20. [doi:10.1186/1471-2164-13-S8-S20]
87. Guney, E.; Garcia-Garcia, J.; Oliva, B. GUILDify: a web server for phenotypic characterization of genes through biological data integration and network-based prioritization algorithms. Bioinformatics 2014, 30, 1789-1790. [doi:10.1093/bioinformatics/btu092]
88. Yang, H.; Robinson, P. N.; Wang, K. Phenolyzer: phenotype-based prioritization of candidate genes for human diseases. Nat Methods 2015, 12, 841-843. [doi:10.1038/nmeth.3484]
89. Cheng, D.; Knox, C.; Young, N.; Stothard, P.; Damaraju, S.; Wishart, D. S. PolySearch: a web-based text mining system for extracting relationships between human diseases, genes, mutations, drugs and metabolites. Nucleic Acids Res 2008, 36, (Web Server issue), W399-405. [doi:10.1093/nar/gkn296]
90. Yue, P.; Melamud, E.; Moult, J. SNPs3D: candidate gene and SNP selection for association studies. BMC
Bioinformatics 2006, 7, 166. [doi:10.1186/1471-2105-7-166]
91. Shannon, P.; Markiel, A.; Ozier, O.; Baliga, N. S.; Wang, J. T.; Ramage, D.; Amin, N.; Schwikowski, B.; Ideker, T. Cytoscape: a software environment for integrated models of biomolecular interaction networks.