Article
1
A moving 3D laser scanner for automated
2
underbridge inspection
3
Marco Tarabini1*, Hermes Giberti2, Silvio Giancola1, Matteo Sgrenzaroli3, Remo Sala1, Federico
4
Cheli1.
5
1 Politecnico di Milano, Dipartimento di Meccanica, Via La Masa 1, Milano, Italy
6
2 Università degli Studi di Pavia, Dipartimento di Ingegneria Industriale e dell’Informazione, via Ferrata 5,
7
27100, Pavia, Italy.
8
3 Gexcel - Geomatics & Excellence, Via Branze 45 - 25123 Brescia, Italy
9
* Correspondence: [email protected]; Tel.: +39-02-2399-8808
10
Abstract: Recent researches proved that the underbridge geometry can be reconstructed by
11
mounting a 3D laser scanner on a motorized cart travelling on a walkway located under the bridge.
12
The walkway is moved by a truck and the accuracy of the bridge model depends on the accuracy of
13
the trajectory of the scanning head with respect to a fixed reference system. In this paper, we
14
describe the metrological characterization of a method that uses non-contact systems to identify the
15
relative motion of the cart with respect to the walkway; the orientation of the walkway with respect
16
to the bridge is determined using inclinometers and optical rails, while the position of the truck with
17
respect to the bridge is measured using a conventional odometer. The measurement uncertainty
18
of the proposed system was initially evaluated by numerical simulations and successively verified
19
by experiments in laboratory conditions. The complete system has then been tested in operative
20
conditions; the validity of the proposed approach has been demonstrated by comparing the
21
geometry of buildings reconstructed with the proposed system with the geometry obtained with a
22
static scan. Results evidenced that the errors are approximately 6 mm.
23
Keywords: laser; construction monitoring; measurements; uncertainty; bridge inspection
24
25
1.Introduction
26
The automation of bridge inspections is the focal point of several studies [1-7], given that many
27
existing highway bridges were built in the 60s [1] and the inspection procedures are becoming
28
extremely expensive [2]. The visual inspection of concrete bridges performed by skilled technicians
29
has different limitations generated by the discretional margins in the identification of the concrete
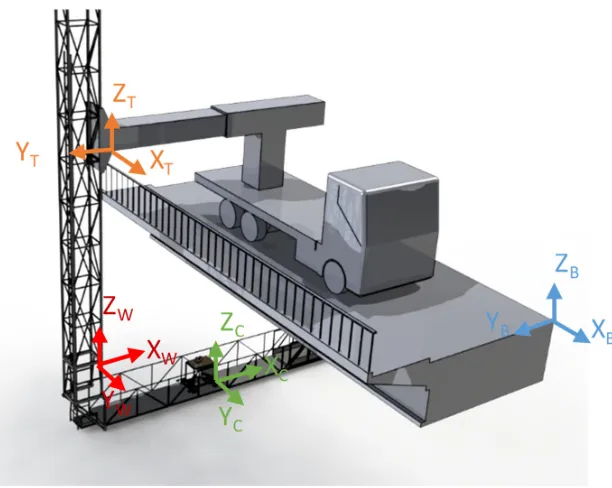
30
defects. According to McCrea et al. [3], metallic bridges are typically monitored using non-destructive
31
techniques while concrete bridges are mainly monitored using visual analyses, given the difficulty of
32
creating inspection systems capable of detecting defects of a few millimetres on constructions of
33
hundreds of meters. One of the most promising techniques is the analysis of images as proposed by
34
Yu et al. [7], but great limitations derive from the difficulty in associating the exact position to each
35
image; despite different works [8-10] focused on the methods for managing the huge amount of data
36
deriving from image analysis, these methods do not provide any geometrical information about the
37
bridge.
38
The idea of using a moving laser scanner to reconstruct the underbridge geometry has been
39
proposed and validated [1,2], but the accuracy of the reconstruction was not sufficient, with
40
geometrical errors of approximately ±70 mm. The main source of error was the large uncertainty in
41
the reconstruction of the scanning head trajectory and orientation; in the literature, the objects’
42
egomotion has been measured with several different approaches [11-16] and the technique that grew
43
more rapidly is the Visual Odometry (VO) [11], the process in which the motion of a vehicle (or
44
subject) is detected starting from the images acquired by a single or multiple cameras. The estimation
45
of a vehicle motion from images was pioneered by Moravec in the 1980s [16] and the term VO was
46
introduced in 2004 by Nister thanks to the similarity to wheel odometry, which incrementally
47
estimates the motion of a vehicle by integrating a wheel rotation [11,15]. As outlined by Scaramuzza
48
and Fraundorfer in their review on VO [15], the technique is effective only if there is sufficient
49
illumination in the environment and the static scene has enough features to allow the identification
50
of the relative motion; the framerate has to be large enough to allow the images overlap. VO can
51
provide relative position error ranging from 0.1 to 2%. This capability makes VO an interesting
52
alternative to the conventionally used techniques (global positioning system, inertial measurement
53
units, and laser odometry). The early VO studies were motivated by the NASA Mars exploration
54
program to measure the rovers’ motion and, in general, this technique is the preferred choice in
55
environments where the global positioning system is not available or does not provide for the
56
required accuracy.
57
The present study was developed to identify the position of a cart moving on the walking
58
platform of a bridge inspection truck, as shown in Figure 1. The cart is equipped with a 3D laser
59
scanner used to reconstruct a 3D map of the underbridge using a helical scan. The mathematical
60
formulation of the problem and the preliminary experimental results were presented in references
61
[1,2,17,18]. The accuracy in the reconstruction of the underbridge geometry (cloud of points) obtained
62
in the tests was limited, mainly because of the limited accuracy of the system used to identify the
63
position of the cart on the walkway, which was based on the hypothesis of small cart roll, pitch and
64
yaw.
65
66
Figure 1 Scheme of the cart moving on the by-bridge walkway
67
The system used to identify the relative position between the cart reference system (with
68
subscript C in Figure 1) and the origin of the by-bridge walkway (with subscript W in Figure 1) was
69
described in ref. [17], while the relative positions between the bridge reference system (subscript B),
70
the truck reference system (subscript T) and the walkway reference systems will be identified with
71
the methods described in this paper. Additionally, the position of a laser scanner placed over the cart
72
was estimated calculating the relative position of the laser head relative to the cart (boresight
73
operation), to determine the position of the laser scanner used to acquire 3D Points in helical mode.
74
Different issues prevented the adoption of existing techniques:
75
• GPS cannot be used because of the limited accuracy and because of the poor signal quality on
76
the surface immediately below the bridge deck;
77
• The classical VO can fail because of the lack of features of the surrounding environment (flat
78
underbridge), non-controlled environment.
• Inertial Measurement Units were the baseline solution at the beginning of the project, but the
80
long measurement duration induced relevant drift problems;
81
• The use of the encoder-based odometer for the identification of the cart position lead to poor
82
results because of the wheels’ slippage;
83
• Vision systems for the measurement of cart position (pattern matching techniques to track the
84
position of the cart using fixed cameras or trinocular stereoscopic systems using markers) were
85
also viable solutions; the worsening accuracy of 3D reconstruction at the increasing distances
86
evidenced in tests performed in controlled conditions [19] was not acceptable for our
87
application.
88
89
Simultaneous Localization and Mapping (SLAM) techniques focusing on the cart position on the
90
walkway is difficult to implement because the relative motion between the cart, the walkway, the
91
truck frame, and the bridge implies that different parts of the images are moving in different
92
directions.
93
The problem was solved by developing a custom system entirely based on noncontact
94
techniques, given the positive results evidenced numerical simulations. The breakdown of the
95
uncertainty budget (identified with the technique described in ref. [20]) evidenced the necessity of
96
considering the nonlinear terms in the rotation matrices, given that the linearization-induced errors
97
were close to 20 mm. The effects of the tilt uncertainties were generally larger than those of
98
uncertainties in distance measurements. Laboratory experiments permitted validating the entire
99
measurement procedure, which involved also the conversion of raw data acquired by the Faro 3D
100
scanning head into a cloud of points. The RMS of the planarity error was 6 mm, a value three times
101
smaller than that obtained with the previous configuration.
102
2.Method
103
The position of the scanning head can be identified applying roto-translations starting from the
104
position of the truck:
105
= … ( )
106
Where
107
= 0 1
108
R01 and T01 are respectively the rotation matrix (3x3) and the translation vector (3x1) which
109
describe the position of a reference system with respect to the previous one. The rotation matrix R
110
cannot be linearized and the rotations:
111
=
1 −
1 −
− 1
112
The system that measures the cart position with respect to the walkway is set-up with:
113
• a laser distance meter and two laser pointers located at the beginning of the by-bridge walkway;
114
• a camera on the cart which observes the three spots on the projection plane;
115
• two cameras on the cart observing sideward and downwards; and
116
• an encoder for the closed-loop control of the cart motor
117
The scheme of the measurement chain is shown in Figure 2; the three laser beams generate three
118
spots on the projection plane; the central one is the laser distance meter, while the other two are used
119
as optical rails. The three lasers are aligned with the cart motion direction, so that the displacement
120
of the three points on the projection plane is limited. The downward and the lateral cameras observe
121
respectively a metering tape fixed to the walkway and the walkway handrail.
124
Figure 2 Scheme of the measurement chain
125
With the proposed setup, the cart position is identified as follows:
126
• the fore-and-aft motion (XC in Figure 1) is determined by the laser range finder located at the
127
beginning of the walkway;
128
• the lateral and vertical motion of the cart are measured by the spot camera, which identifies the
129
translation from the position of the central spot;
130
• the cart roll is measured by the spot camera, observing the rotation of the two external laser
131
spots
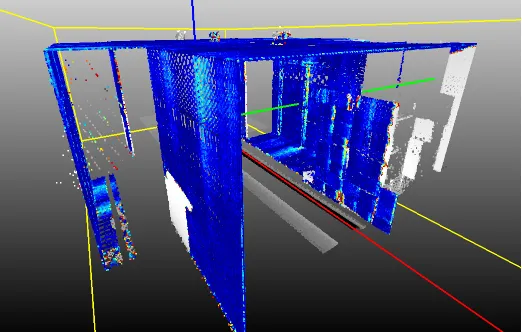
132
• the cart pitch and yaw are measured respectively by the lateral and the vertical cameras,
133
observing linear objects parallel to the cart motion.
134
In the actual method implementation, there is no data fusion between the information of the
135
different measurement systems: the lateral camera, for instance, can be used to identify also the
136
vertical cart displacement but, at this initial stage, we decided to keep the method as simple as
137
possible. As in any vision system, the quality of the image is crucial for obtaining reliable
138
measurements. In our case, the biggest problem is probably related to the large variation of lighting
139
and viewing condition of the scene, since at the beginning and at the end of the bridge the cameras
140
may be exposed to the direct sunlight while below the bridge the lighting condition may be very
141
poor.
142
Regarding the phase shift laser scanner, it was positioned over the cart. The laser scanner can
143
work in two modes: i) spherical mode, and ii) helical mode. In the first mode, the laser scanner
144
acquires the 3D coordinates of the visible points around the scanner head in a field of view of 310°
145
(vertical) x 360° (horizontal).
146
In the second mode, the horizontal axe is fixed and the laser can acquire 310° vertical sections;
147
the combination of the cart movement and the scanner vertical rotation guaranteed a 3D acquisition.
148
To use the scanner in helical mode given the cart trajectory, the relative position between cart and
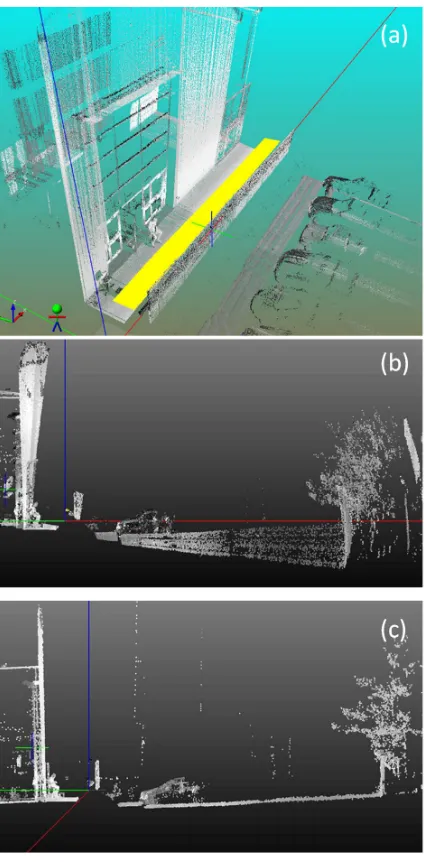
149
laser scanner head must be determined; a boresight technique was used for this purpose. 4 targets
150
detectable form the laser scanner were positioned jointly liable with the cart. The next paragraphs
151
describe the measurement subsystems and the actions taken to obtain reliable measurements.
152
2.1. Experimental setup
153
The three cameras used for the identification of the cart roll, pitch and yaw are manufactured by
154
IDS (uEye UI-5240CP-M-GC); the image resolution is 1280x1024 pixels and the maximum frame rate
155
is 25 Hz. A LabVIEW-based software running on an embedded PC captures the images, that are
156
analyzed offline in order to tune the algorithms in case of non-standard lighting conditions.
157
2.1.1.Laser pointers and Camera
158
The cart position along the X axis (direction of motion, almost perpendicular to the projection
159
plane) is detected by the laser range finder (FAE LS121 FA, range 100 m, resolution 0.1 mm). The cart
160
lateral and vertical motions (Y and Z axes in Figure 3(a)), as well as the cart roll are measured by
161
analyzing the image captured by the camera. The translations are measured by the position of the
162
central spot and the two external spots are used to identify the cart roll. The scheme of the
163
measurement setup is shown in Figure 3.
164
Walkway Reference System Spot Camera
Bounded path Cart reference
system
Downward Camera
Lateral Camera Projection
165
166
Figure 3: Laser spots on the projection plane (a) and scheme of the cart rotation measurement (b)
167
Since the camera sensor is not parallel to the observation plane, the system was calibrated by
168
observing a grid with known geometry (diameter 6 mm, grid pitch 25 mm), so that the result of
169
measurement is an array of spots coordinates in physical units. In order to obtain good images
170
independently from the sunlight conditions, the camera deputed to observe the 3 spots has a
171
bandpass filter from 635 to 646 nm, given that the three lasers have a wavelength of 639 nm (red
172
color). The alignment between the three lasers strongly affects the measurement accuracy and
173
consequently we developed a fit-to-purpose calibration procedure (described in section 2.2).
174
The coordinates of the three laser spots are identified using blob detection algorithm, based on
175
a classical image thresholding paired by a blob analysis. The threshold level was set to 30 (8-bit
176
grayscale image) and the lookup region of interest (ROI) is rearranged dynamically, since between
177
an acquisition and the other the movement should not exceed 30 pixels. This value corresponds to a
178
displacement lower than 15mm in 40 ms; the value was obtained with experiments performed by
179
fixing an accelerometer on the cart and analyzing the maximum velocity. This procedure allowed a
180
reduction of the image processing time, which is in the order of a few milliseconds per frame.
181
2.1.2.Lateral and Vertical camera
182
The vertical camera was located in order to observe a roller meter below the cart; also in this
183
case, the camera was equipped with an infrared lighting system and an infrared filter. The camera
184
was calibrated observing the calibration grid, in order to measure the displacements and the rotations
185
in physical coordinates. The position of the roller meter was coincident with the walkway axis
186
(maximum error smaller than 2 mm); a scheme of the measurement method is shown in Figure 4.
187
188
189
Figure 4: Scheme of the system for the measurement of the cart yaw (a) and extraction of the yaw
190
angle from the image (b)
191
The yaw angle is measured by a custom edge detection algorithm: the grayscale levels image is
192
divided into columns (5 pixels wide). Data of each column is processed using a moving average
193
performed on a 15 x 5 pixels window. All the points in which the grey-scale level variation is larger
194
than 10 are used for the edge detection; the cart yaw angle is measured by fitting the points in a least
195
square sense. The slope is bounded between ±5° and the region of interest for the calculation the
196
threshold is limited to 20 rows above or below the one computed at the previous step; these values
were chosen after the analysis of the maximum yaw in operative conditions. With this approach, the
198
image processing time is approximately 15 ms.
199
A similar system has been used also for the measurement of the pitch angle. The reference line
200
is the walkway handrail, and the edge used for the identification of the pitch is the one between the
201
handrail and the background. Starting from the top of the image, the derivative of the intensity has
202
been computed on the image averaged on a 5 x 5 window. Preliminary analyses showed that with
203
the proposed experimental setup the edge is the best line fitting the points exceeding the level of 20
204
grayscale units/pixel. The angle is constrained between ±9°. The region of interest for the calculation
205
of this line is limited to 80 pixels above or below the previously calculated line. The image processing
206
time is approximately 30 ms. Examples of the images used for the identification of the cart pitch and
207
yaw are shown in Figure 5.
208
209
210
Figure 5: Pictures for the identification of the car yaw (a) and pitch (b).
211
2.2. System calibration and Uncertainty Budget
212
The system calibration is necessary for both the transformation of the images coordinates into
213
physical coordinates (camera calibration) and for the compensation of the bias errors due to the
non-214
idealities of the measurement system (system calibration). The camera calibration was performed by
215
acquiring the image of the calibration grid and compensated for the perspective and nonlinear
216
(optical) distortions of the cameras; the standard nonlinear compensation algorithm of LabVIEW was
217
used in all the analyses.
218
The system calibration procedure included the experimental evaluation of the measurement
219
uncertainty and the compensation of the bias errors [20-23]. The latter were significant only in the
220
“laser spot and cameras” subsystem, where the lasers’ misalignment results in a drift of the cart
221
position and a linearly increasing roll angle. The calibration was performed by comparing the tilt
222
measured by the laser spots and camera to that measured by a reference inclinometer (dual axis
223
SEIKA SBG2U, full-scale ±10° and linearity deviation lower than 0.01°) at different distances (from 1
224
to 10 m). The error due to the laser misalignment was derived by plotting the difference between the
225
angle measured by the inclinometer and that measured by the vision system as a function of the
226
distance. The linear component of the trend (approximately 2° after 10 meters in our prototype) was
227
subtracted from the measurements performed in operative conditions; as later discussed, the error is
228
large because of the limited quality of the optical setup but does not limit the method accuracy given
229
that, being repeatable, can be compensated.
230
The uncertainties of the different components of the measurement chain were evaluated as the
231
standard deviation measured in repeatability conditions (given that all the systematic errors outlined
232
in the calibration are compensated). Uncertainty of the laser distance meter was verified at distances
233
of 2.5, 5, 10 and 15 m. Tests results evidenced a standard uncertainty of 0.3 mm.
234
Uncertainty of the displacements measured by the cameras were evaluated under repeatability
235
conditions, i.e. by observing the spots and edges when the cart was not moving. Uncertainty of the
236
displacement measurement performed by the laser spot and vision system was 0.1 mm, which
237
corresponded to 1/5 of the pixel size (0.5 mm). The resulting uncertainty of the yaw angle is 0.04°.
238
The uncertainty of pitch and yaw angles was measured by imposing known rotations of ± 5° to
239
an aluminum profile and using the edge detection algorithms described in this paper. The standard
240
uncertainty was 0.03°; this value is probably an underestimation of the value that can be obtained in
operating conditions, since the background during the edge detection did not varied during the
242
calibration tests. Furthermore, the algorithm starts from the assumption that the edge to be detected
243
is an ideal line, and in the current method implementation, the lack of linearity of the edge results in
244
a reduction of the method accuracy. The summary of the uncertainties reported in this section are
245
summarized in Table 1.
246
Table 1: Summary of the uncertainties obtained with the proposed method
247
Quantity Uncertainty
Displacement x (motion) 0.3 mm
Displacement y (lateral) 0.1 mm
Displacement z (vertical) 0.1 mm
roll 0.03°
pitch 0.03°
yaw 0.04°
248
2.3. Laser scanner boresight
249
The laser scanner (Faro 3D) boresight calibration consists in finding the roto-translation between
250
the Laser reference system and the cart reference system, as seen in the upper part of Figure 6. The
251
transformation is obtain by scanning a set of 4 nonaligned markers set fixed on the cart with the
252
laser scanner mounted on the cart and with another laser scanner that observes the cart with the
253
markers.
254
255
256
Figure 6: Laser Scanner reference systems on the cart (left) and 3D scan of the set of 4 markers
257
located on the cart (as seen from the laser scanner, right)
258
An example of a 360° view acquired by the FARO laser scanner located on the cart is shown in
259
Figure 8.
261
Figure 7: 360° view of the scan performed in GEXCEL laboratories
262
3.Results
263
The system (cart + laser scanner) has been used for acquiring a known geometry of two
264
environments: i) an indoor corridor and ii) external facade. In both the cases, the geometry of the two
265
environments has been reconstructed by the Faro 3D laser scanner located on the moving cart (mobile
266
acquisition) was compared to the geometry measured by the same Faro laser scanner placed in a fixed
267
position (tripod/static acquisition) along the corridor respectively and at the center of the façade. The
268
error of the proposed method was quantified by creating a reference mesh (triangulated model) out
269
from the static scan, and calculating the distance between the reference triangle and the closer 3D
270
point acquired in the mobile mode. The results of the inspection procedure performed indoor are
271
shown in Figure 8.
272
273
274
Figure 8: Reconstruction of the corridor
275
Results in the reconstruction of the corridor geometry are summarized in Figure 9 (that shows
276
the corridor observed from above). The plot shows that the errors are generally smaller than 4 mm;
277
as the value is obtained with a regular ground surface and in controlled light conditions, larger values
278
are expected in real tests.
281
Figure 9: 2D map extracted from the 3D reconstruction of the corridor
282
The second series of tests was performed outdoor in conditions that are more similar to those
283
expected under the bridges; the setup for the method validation is shown in Figure 10. The Faro 3D
284
scanning head was mounted on the instrumented cart moving forth and back over a non-flat terrain
285
simulating the by-bridge. A roller meter was fixed on the ground and two linear metal rods (lateral
286
rails) were fixed on a fence. The cart moved for approximately 15 m and then returned to its original
287
position. The cart nominal speed was 1.2 m/s, a value 20% larger than the ideal speed identified by
288
imposing a point density of 1600 points /dm2 with the resolution set to ¼ (helical scans rate 95 Hz).
289
290
291
Figure 10: Pictorial views of the experimental setup used for the method validation
292
Successively, the planarity error of the facade was evaluated as the difference the static and the
293
mobile acquisitions. Results are summarized in Figure 11, that shows the cloud of point obtained
294
before the tilt compensation (part a and b) and after the compensation (part c) of all the systematic
295
errors. One can notice that the progressive twist of the façade is recovered after the laser
296
misalignment compensation. The RMS value of the error (distance between static and dynamic scan)
297
was lower than 6 mm; the error increased on the higher part of the façade and was constant at
different distances from the measurement origin (position of the laser pointers). The possible causes
299
of the planarity error evidenced in this section, the method limitations and the possible
300
improvements are discussed in section 4.
301
302
303
304
Figure 11: Images of the facade reconstructed by the moving cart without the lasers misalignment
305
compensation (a and b) and after the misalignment compensation (c).
306
4.Discussion
307
Results evidenced that the RMS error of the observed building façade (6 mm outside, less than
308
4 mm inside) is compatible with that of the methods existing in the literature [24]. The uncertainty is
309
large in comparison with the uncertainty of the cart position, and numerical simulations [18]
310
evidenced that the error is mainly due to a combination of tilt error of the cart and large distance
311
between the cart and the observed surface (3 to 10 m). The position error increases linearly with the
312
distance between the scanning head and the measured surface. In real experimental conditions the
313
error is supposed to be smaller as the distance from the bridge surface is lower than 2 m. In the real
314
by-bridge usage, the accuracy can be increased by considering only the points placed at a limited
315
distance from the scanning head, given that the simultaneous cart and truck motion allows observing
316
the same point from different cart/truck positions.
The accuracy of the angles’ measurements can be increased by improving the image quality. The
318
increase of image resolution is not possible since (without increasing significantly the
319
instrumentation cost) this choice would limit the camera framerate and consequently the cart speed
320
(that strongly affects the cart vibration [1,2]). The uncertainty of the edge detection algorithms can be
321
reduced by increasing the contrast between the edges and the background; consequently the tests in
322
actual working conditions were performed by painting the walkway surface of a special opaque
323
paint, as shown in the lower part of Figure 10.
324
Given that the most limiting factor is the accuracy of the roll angle, the latter could be increased
325
by adopting a procedure similar to the one used to measure the pitch and yaw angles, i.e. by replacing
326
the two laser pointers with a laser line. In order to obtain a decent contrast with the projection plane,
327
the laser aperture should be large enough to fill the entire projection plane at the smaller distance
328
(approximately 1 m) and should have enough power to ensure a sufficient contrast at the distance of
329
20 m. A similar result can be obtained by replacing the two laser pointers with an array of pointers
330
and adopting a least square procedure to identify the roll angle with a better accuracy. With our
331
experimental setup, the parallelism of the three lasers was limited by the poor planarity of the optical
332
bench and the usage of 3 lasers instead of the external ones did not increase the measurement
333
accuracy significantly.
334
Also the position uncertainty can be reduced by adopting data fusion procedures [25-27], given
335
that the lateral and vertical displacements can be detected by the vertical and lateral cameras
336
respectively and the odometry can be performed by analyzing the images of the vertical camera
337
(which observes the roller meter). The theoretical uncertainty reduction in case of average of two
338
measures with similar uncertainty is √2 [28,29]; however, the increase of accuracy in the final
339
application (reconstruction of the underbridge geometry) would be limited, given that the angles can
340
be measured only by one camera at a time.
341
Many limitations of the proposed measurement system for the identification of the bridge
342
geometry derive from the odd surface on which the cart is moving and the easiest solution would be
343
ensuring a smoother motion of the cart. For obvious safety reasons it is impossible to modify the
344
structure of the walkway, that is telescopic and can be folded on the truck during the transport phase.
345
Since the by-bridge is used for ordinary road maintenance, the non-slip aluminum on the floor is
346
often in poor conditions, and the telescopic structure of the walkway prevents the use of linear guides
347
(rails) that would ensure a limited roll, pitch and yaw of the cart.
348
The results presented in this paper evidenced that the mechanical design of the entire structure
349
can be optimized by increasing the quality of the optical bench and by modifying the design of the
350
cart, introducing passive or active suspension systems in order to limit the vibration of the 3D
351
scanning head. These improvements are deserved to forthcoming studies, given that the accuracy of
352
6 mm on a 15 by 10 meters surface was judged sufficient for the identification of macroscopic
353
structural damages.
354
5.Conclusions
355
This paper described an original technique for the identification of the motion of a moving cart
356
on bounded trajectories. The proposed solution is based on a simple optical system; after the drift
357
compensation, the accuracy does not increase with the distance of the cart from the origin and the
358
method is therefore convenient for the reconstruction of the underbridge geometry. Results showed
359
that the uncertainty of the position is approximately 0.3 mm in the direction of motion of the cart and
360
close to 0.1 mm in the lateral and vertical directions. The uncertainty of the tilt angles, after the
361
compensation of the linear guides’ misalignment, was lower than 0.05°. The proposed method can be
362
used in any application where it is necessary to identify the position of an object along a
quasi-363
rectilinear path and the accuracy can be increased by using cameras with larger resolution and by
364
adopting high quality laser pointers/ laser distance meters. The method validation was eventually
365
performed mounting a 3D laser scanner on a cart moving forth and back on a non-flat surface. The
366
RMS error in the reconstruction of a corridor structure and of a building façade (15 by 10 meters)
were respectively 4 and 6 mm; the values are promising for the final application of the system, given
368
that it was obtained with the cart moving at a speed 20% larger than the actual one.
369
Acknowledgments: Authors gratefully acknowledge SINECO SPA for the financial support of this activity.
370
Author Contributions: Hermes Giberti and Federico Cheli conceived the method. Remo Sala designed the
371
experiments. Silvio Giancola, Hermes Giberti and Marco Tarabini performed the experiments. Marco Tarabini
372
and Hermes Giberti analyzed the data. The paper was written by Marco Tarabini and Silvio Giancola.
373
Conflicts of Interest: The authors declare no conflict of interest
374
References
375
376
1. Zanoni, A.; Maninetti, G.; Cheli, F.; Garozzo, M. Development of a Computer Vision
377
Tracking System for Automated 3D Reconstruction of Concrete Bridges, ASME 2014
378
12th Biennial Conference on Engineering Systems Design and Analysis, American
379
Society of Mechanical Engineers: 2014; , pp. V003T15A012-V003T15A012.
380
2. Giberti, H.; Zanoni, A.; Mauri, M.; Gammino, M. Preliminary study on automated concrete
381
bridge inspection, ASME 2014 12th Biennial Conference on Engineering Systems
382
Design and Analysis, American Society of Mechanical Engineers: 2014; , pp.
383
V003T15A011-V003T15A011.
384
3. McCrea, A.; Chamberlain, D.; Navon, R. Automated inspection and restoration of steel
385
bridges—a critical review of methods and enabling technologies.
Autom Constr 2002,
386
11
, 351-373.
387
4. Hugenschmidt, J. Concrete bridge inspection with a mobile GPR system.
Constr Build
388
Mater 2002, 16
, 147-154.
389
5. Adhikari, R.; Moselhi, O.; Bagchi, A. Image-based retrieval of concrete crack properties
390
for bridge inspection.
Autom Constr 2014, 39
, 180-194.
391
6. Busca, G.; Cigada, A.; Mazzoleni, P.; Tarabini, M.; Zappa, E. Static and dynamic
392
monitoring of bridges by means of vision-based measuring system, Conference
393
Proceedings of the Society for Experimental Mechanics Series, 2013; , pp. 83-92.
394
7. Yu, S.; Jang, J.; Han, C. Auto inspection system using a mobile robot for detecting concrete
395
cracks in a tunnel.
Autom Constr 2007, 16
, 255-261.
396
8. Brilakis, I.; Fathi, H.; Rashidi, A. Progressive 3D reconstruction of infrastructure with
397
videogrammetry.
Autom Constr 2011, 20
, 884-895.
398
9. Zhu, Z.; German, S.; Brilakis, I. Detection of large-scale concrete columns for automated
399
bridge inspection.
Autom Constr 2010, 19
, 1047-1055.
400
10. Abudayyeh, O.; Al Bataineh, M.; Abdel-Qader, I. An imaging data model for concrete
401
bridge inspection.
Adv Eng Software 2004, 35
, 473-480.
402
11. Nistér, D.; Naroditsky, O.; Bergen, J. Visual odometry, Computer Vision and Pattern
403
Recognition, 2004. CVPR 2004. Proceedings of the 2004 IEEE Computer Society
404
Conference on, IEEE: 2004; , pp. I-652-I-659 Vol. 1.
405
12. Stein, G.P.; Mano, O.; Shashua, A. A robust method for computing vehicle ego-motion,
406
Intelligent Vehicles Symposium, 2000. IV 2000. Proceedings of the IEEE, IEEE: 2000;
407
13. Rolland, J.P.; Davis, L.; Baillot, Y. A survey of tracking technology for virtual
409
environments.
Fundamentals of wearable computers and augmented reality 2001, 1
,
67-410
112.
411
14. Portugal-Zambrano, C.E.; Mena-Chalco, J.P. Robust range finder through a laser pointer
412
and a webcam.
Electronic Notes in Theoretical Computer Science 2011, 281
, 143-157.
413
15. Scaramuzza, D.; Fraundorfer, F. Visual odometry [tutorial].
Robotics & Automation
414
Magazine, IEEE 2011, 18
, 80-92.
415
16. Moravec, H.P.
Obstacle avoidance and navigation in the real world by a seeing robot
416
rover. 1980
.
417
17. Giancola, S.; Giberti, H.; Sala, R.; Tarabini, M.; Cheli, F.; Garozzo, M. A non-contact
418
optical technique for vehicle tracking along bounded trajectories.
JOURNAL OF
419
PHYSICS CONFERENCE SERIES 2015
, 1-13.
420
18. Giberti, H.; Tarabini, M.; Cheli, F.; Garozzo, M. Accuracy Enhancement Of A Device
421
For Automated Underbridge Inspections, IMAC XXXIV, A Conference and Exposition
422
on Structural Dynamics, , Orlando, Florida2016; .
423
19. Fossati, F.; Sala, R.; Basso, A.; Rocchi, M.G.D. A multicamera displacement
424
measurement system for wind engineering testing.
FLORENCE ITALY JULY 19t h-23r
425
d
, 217.
426
20. Moschioni, G.; Saggin, B.; Tarabini, M.; Hald, J.; Morkholt, J. Use of design of
427
experiments and Monte Carlo method for instruments optimal design.
Meas J Int Meas
428
Confed 2013, 46
, 976-984.
429
21. Joint Committee for Guides in Metrology (JCGM) GUIDE 98-3/suppl.1:2008 Evaluation
430
of measurement data - Supplement 1 to the Guide to the expression of uncertainty in
431
measurement - Propagation of distributions using a Monte Carlo method.
2008
.
432
22. Tarabini, M.; Saggin, B.; Scaccabarozzi, D.; Moschioni, G. The potential of
micro-433
electro-mechanical accelerometers in human vibration measurements.
J Sound Vibrat
434
2012, 331
, 487.
435
23. Bich, W.; Cox, M.G.; Harris, P.M. Evolution of the ' Guide to the Expression of
436
Uncertainty in Measurement '.
Metrologia 2006, 43
, S161.
437
24. Müller, M.; Surmann, H.; Pervölz, K.; May, S. The accuracy of 6D SLAM using the AIS
438
3D laser scanner, Multisensor Fusion and Integration for Intelligent Systems, 2006 IEEE
439
International Conference on, IEEE: 2006; , pp. 389-394.
440
25. Hall, D.L.; Llinas, J. An introduction to multisensor data fusion.
Proceedings of the IEEE
441
1997, 85
, 6-23.
442
26. Taniguchi, M.; Tresp, V. Averaging regularized estimators.
Neural Comput 1997, 9
,
443
1163-1178.
444
27. Ferrari, D.; Giberti, H. A genetic algorithm approach to the kinematic synthesis of a
6-445
DoF parallel manipulator, Control Applications (CCA), 2014 IEEE Conference on,
446
IEEE: 2014; , pp. 222-227.
447
28. Moschioni, G.; Saggin, B.; Tarabini, M. 3-D Sound Intensity Measurements: Accuracy
448
Enhancements With Virtual-Instrument-Based Technology.
Instrumentation and
449
29. Silvestri, M.; Confalonieri, M.; Ferrario, A. Piezoelectric actuators for micro positioning
451
stages in automated machines: experimental characterization of open loop
452
implementations.
FME Transactions 2017, 45
, 331-338.
453